Insurance complaints statistics by state come from each state's insurance regulator, and only some publish them in a form you can analyse. Texas publishes every complaint its Department of Insurance has closed since 2012 as open data: in 2025 it closed 22,564, confirmed 31% against the company, took a median 84 days to close them and recorded claim delays in 41%. New York reports totals and outcomes by type of insurance: 39,064 insurance complaints closed in 2025, 26% with a positive outcome. Nationally, the NAIC combines states' closed, confirmed complaints into reports by reason, coverage and disposition. For an insurer, these figures are a public mirror: the department's count of complaints against the company should reconcile with its own register, which Insurance Complaint Management, Botminds' complaint software, keeps as each complaint is logged.
Texas, complaints closed by the Department of Insurance in 2025
22,564
complaints closed
31%
confirmed against the company or licensee
84days
median from receipt to closing
41%
cited delays in claims handling
Which states publish insurance complaint statistics?
Texas publishes the most: four complaint datasets on the state's open data portal, with rows updated on 27 October 2026. TDI describes them on its own page: one row per complaint, one row per person or organisation named in a complaint, totals, and "counts for confirmed complaints and policies in force by company name and line of coverage", which is the basis of Texas's complaint index. Each complaint carries its coverage, who filed it, its reasons, its disposition, whether it was confirmed and its dates.
New York publishes aggregates. The Department of Financial Services' annual enforcement report gives insurance complaints received and closed, the share with a positive outcome and the amount recovered, by type of insurance, and its consumer guide ranks health insurers by upheld complaints relative to premiums. Nationally, the NAIC says it "compiles closed, confirmed complaint information about insurance carriers from state insurance departments", searchable by state, company and type of insurance for the past three years.
Insurance complaints by line: auto leads, health is confirmed most often
Auto complaints are the largest group in Texas, but health complaints are the most likely to be confirmed. Of the 2025 closures, 9,982 concerned automobile insurance and 5,591 homeowners, each confirmed in about 27 to 28% of cases. Accident and health complaints numbered 4,420 and were confirmed in 47%, and life and annuity complaints in 35%.
Texas 2025: complaints closed, confirmed and how long they took, by coverage
| Coverage | Closed | Confirmed | Median days to close | Most common reason |
|---|---|---|---|---|
| Automobile | 9,982 | 27.2% | 79 | Customer service, claim handling (64%) |
| Homeowners | 5,591 | 27.8% | 113 | Customer service, claim handling (57%) |
| Accident and health | 4,420 | 46.8% | 66 | Denial of claim (38%) |
| Life and annuity | 1,207 | 35.0% | 64 | Customer service, policyholder service (46%) |
| Miscellaneous | 703 | 20.8% | 99 | Customer service, claim handling (29%) |
| Liability | 474 | 20.0% | 81.5 | Customer service, claim handling (47%) |
| Fire, allied lines and commercial multi-peril | 187 | 28.3% | 119 | Customer service, claim handling (58%) |
| All coverages | 22,564 | 31.3% | 84 | Customer service, claim handling (51%) |
Homeowners complaints take longest: a median 113 days from receipt to closing, against 66 for health. Property claims involve inspections, estimates, contractors and sometimes appraisal, and a complaint about one usually waits on the claim. Overall, 68% of Texas's 2025 complaints took more than 60 days to close, which is the department's review time; the insurer's own answer is due in 15.
How often complaints are confirmed, line by line
A confirmed complaint is one the department found the company in the wrong on, and it is the number that feeds the complaint index. The NAIC's definition, adopted in 2008, counts a complaint as confirmed when the department finds a violation of law, regulation or the policy terms, or when "The complaint and entity’s response, considered together, indicate that the entity was in error." That second limb makes the insurer's own response part of the test.
Share of Texas's 2025 complaints confirmed against the company, by line
Automobile (9,982)
- Confirmed · 27.2%
- Not confirmed · 72.8%
Homeowners (5,591)
- Confirmed · 27.8%
- Not confirmed · 72.2%
Accident and health (4,420)
- Confirmed · 46.8%
- Not confirmed · 53.2%
Life and annuity (1,207)
- Confirmed · 35%
- Not confirmed · 65%
Who complains differs by line, and so does who wins
The person filing changes the complaint. In Texas's 2025 auto complaints, 39% came from third parties, typically the other driver pursuing a liability claim, and 9% from attorneys; only 42% came from the insured. Homeowners complaints were 75% from the insured. In accident and health, 33% came from providers and 12% from third-party billing services, so a third of health complaints are really payment disputes between businesses.
Who filed Texas's 2025 complaints, by line, and how often each filer's complaints were confirmed
| Line or filer | Largest filer groups | Confirmed |
|---|---|---|
| Automobile | Insured 41.5% · third party 38.9% · attorney 9.3% | 27.2% (line) |
| Homeowners | Insured 74.7% · other 18.8% · relative 3.0% | 27.8% (line) |
| Accident and health | Insured 45.0% · provider 32.8% · billing service 12.4% | 46.8% (line) |
| Filed by a provider (all lines) | 1,533 complaints | 52.3% |
| Filed by the insured (all lines) | 11,605 complaints | 29.6% |
| Filed by a third party (all lines) | 4,189 complaints | 24.4% |
Providers' complaints were confirmed more than half the time, which helps explain the health line's high confirmed share: a provider disputing a payment usually arrives with the claim, the codes and the dates. For an insurer reading its own data, that is a prompt to separate provider complaints from member complaints before comparing either with the state.
How Texas complaints ended
TDI records up to several dispositions per complaint, and money changed hands, or was promised, in a large share. In 2025, 20% of closed complaints carried "Claim Settled", 13% "Additional Payment Expected" and 11% "Additional Monies Received"; together with premium refunds and cash surrenders, 45% carried at least one disposition of that kind. At the same time, 35% carried "Company Position Upheld" and 69% "Information Furnished".
The dispositions are the department's description, not a verdict on the money, and one complaint can be both upheld on one point and settled on another. Read together with the confirmed flag, they show what the complaint process produces in Texas: a correction or payment in many cases, and a finding against the company in about three in ten.
Insurance complaint trends: Texas, 2019 to 2026
The volume of complaints Texas closes has risen since 2022, and the share confirmed has risen faster. In 2024 TDI closed 17,367 complaints and confirmed 27.3%; in 2025, 22,564 and 31.3%. By 27 October 2026 it had already closed 21,638, confirmed at 28.2%. In 2021 the confirmed share was 12.8%.
Complaints closed by TDI each year, and the share confirmed
The mix moved too. Accident and health complaints led every year to 2020; from 2021, automobile complaints led, and since 2023 homeowners complaints have outnumbered health complaints. A complaints team benchmarking against Texas should compare like with like: a carrier's auto complaints against the state's auto complaints, not its whole book against the state's total.
New York: a different measure of the same thing
New York measures outcomes rather than confirmations. DFS closed 39,064 insurance complaints in 2025 and obtained a positive outcome, money or other relief, in 10,336, about 26%, recovering more than $121 million. Prompt-pay complaints were 60% of the total. The breakdown by type, and what it means for someone deciding whether to complain, is in does filing a complaint with the insurance commissioner work in NY.
For health insurers, New York goes further. Its 2026 consumer guide, built on DFS's 2025 data, reports for each HMO the complaints closed, the complaints upheld and premiums, and ranks them by upheld complaints per million dollars of premium. Across the HMOs listed, DFS closed 682 complaints and upheld 307 of them, against $6,805 million of premium: a ratio of 0.0451 upheld complaints per million dollars.
Which insurance company has the most complaints?
Usually the largest one, which is why raw counts mislead. A company with half a state's auto policies will draw more complaints than a company with 1% of them even if it treats people better. Regulators therefore divide a company's share of complaints by its share of the market. In Texas's 2025 index table, the two largest auto insurers, which together held about half of the state's auto policies, had complaint indexes of 0.30 and 0.66, below the average of 1.00.
The index has its own traps, especially for small companies, where one complaint can push it above 6. How to read it, and how to compute your own, is in what is a good NAIC complaint index. A league table of company names is less useful than either measure, and this guide does not reproduce one.
What insurance complaints data cannot tell you
Public complaint data is a regulator's record, so it counts what reached the regulator, in the regulator's terms. Four cautions apply before using it as a benchmark. It counts complaints filed with the department, not the complaints a company received directly. Its confirmed flag is the department's judgment, and states apply the NAIC definition with their own practice. Its years are years of closing: about 26% of the complaints Texas closed in 2025 were received in 2024. And a complaint naming several parties appears once per party in TDI's all-data file, so counts must be made on distinct complaint numbers.
None of this makes the data less useful; it makes it a mirror rather than a scorecard. The register is where the company's own complete count lives, and the comparison is useful precisely because the two are built differently.
How to hold your own register against the public data
Treat the department's data as an external count of your department complaints and reconcile it every month. Examiners will do the same at the next examination: the NAIC handbook (2017 edition) tells them to reconcile the company's register with the department's list. A carrier that does it first finds the complaint that never reached the register while it can still be fixed.
Five checks a complaints team can run against Texas's open data
- Count
Department complaints against your companies, by month of receipt, against your register’s department complaints. Every gap is a name to find.
- Confirmed share
Your confirmed complaints by line against the state’s: 27% auto, 28% homeowners, 47% health in 2025.
- Reasons
Map your reason codes to TDI’s and compare shares; a reason you rarely record that TDI records often is a coding gap.
- Time
Your response dates against each department’s clock, and TDI’s closing dates against your closing dates.
- Index
Recompute your complaint index from TDI’s policy counts and confirmed complaints by line, and watch it monthly rather than yearly.
Insurance Complaint Management and the public mirror
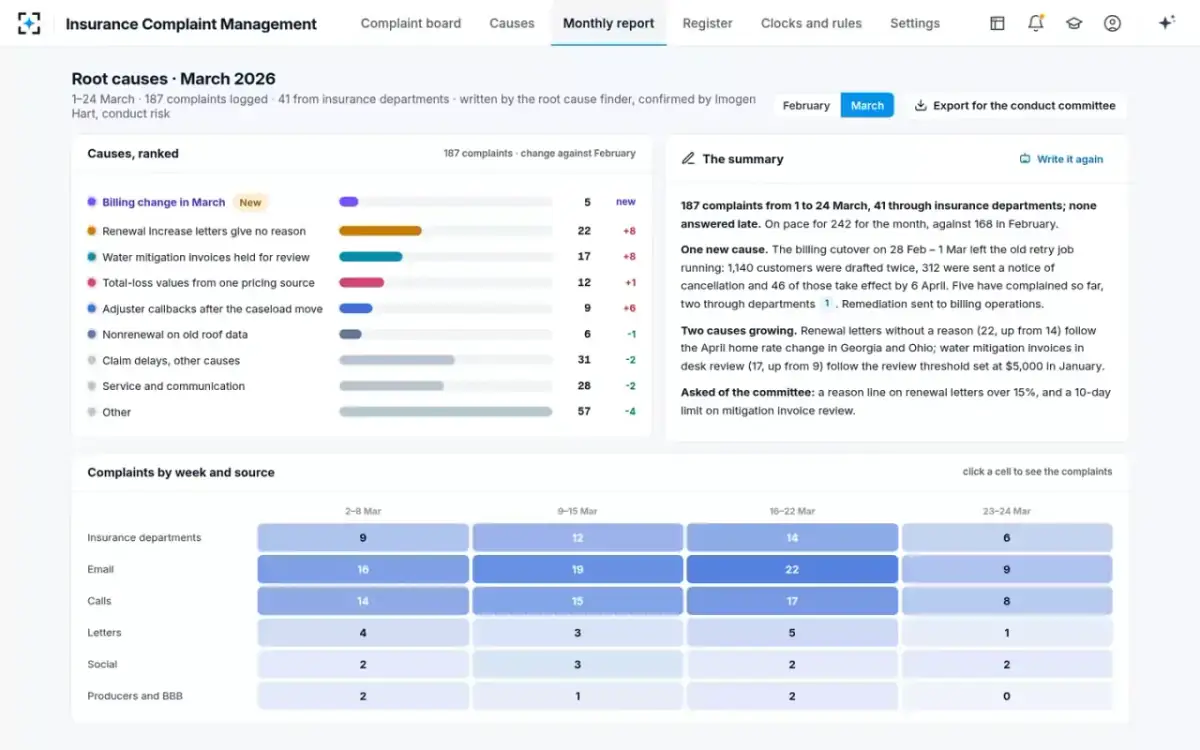
The register the solution keeps carries the fields the public data uses: line, nature, source, disposition and time to process, with every reason a complaint gives. That makes the reconciliation mechanical. The monthly report ranks causes against the previous month and shows complaints by week and source, so the trend a regulator will see in its own data is visible inside the company first.
Insurance Complaint Management’s monthly report: causes ranked, complaints by week
What the solution does not do is read the regulator's data for you; a team that wants the Texas comparison downloads it from the portal. What it removes is the other half of the work: a register that is complete, coded consistently and current on the day the comparison is made. The register's own requirements are set out in complaint register requirements for an insurance company.
Questions people ask
How many insurance complaints are there in the USA each year?
No single public count combines every state's figures in a downloadable form. The NAIC compiles closed, confirmed complaints from state departments for lookup by state, company and coverage; at state level, Texas closed 22,564 in 2025 and New York 39,064.
Where can I get insurance complaints data?
From state regulators. Texas publishes complaint-level open data with coverage, reasons, disposition and dates; New York publishes annual totals and outcomes by type of insurance; the NAIC's Consumer Insurance Search shows closed, confirmed complaints by company.
What is the Texas Department of Insurance complaint database?
A set of four datasets on the Texas Open Data Portal: complaints with one row each, the same with every party named, complaint totals, and confirmed complaints with policies in force by company and line, which yields the complaint index.
What were the insurance complaint statistics for 2024?
In Texas, TDI closed 17,367 complaints in 2024 and confirmed 27.3% of them, up from 18.0% in 2023. Automobile complaints were the largest group, with 7,729 closed.
What do most insurance complaints in Texas say?
Most are about claims. In 2025, 51% cited customer service in claim handling, 41% claim delays, 31% an unsatisfactory settlement or offer and 18% a denial; most complaints carried more than one reason.