The client onboarding metrics that matter most to an asset manager are time from award to funded account, split by station and by who was holding the file, and the fees each week of that time leaves unearned. A management fee charged on assets earns nothing until assets arrive, so a $1.4 billion mandate at a blended 12 basis points loses about $32,500 of fee revenue for every week it waits, and the client carries its own cost of an allocation not yet in place. Around those two numbers sit the quality metrics that explain them: how many requests the client received, how many came back complete, and how many holds and disagreements each file produced. Botminds' Institutional Client Onboarding records every station's owner, waiting-on party and date, so these metrics come from the work itself rather than from a quarterly survey of the team.
The figures on this page come from the solution's fictional sample manager, Quillfield Capital, and are sample data, estimates or design targets, each labelled. No regulator or independent study publishes onboarding times for institutional mandates, so the method matters more than any benchmark.
The fee cost of one week before funding
Annual fee at the agreed schedule
Σ (assets in each tier × tier rate)
Sample: $500m × 14 bp + $900m × 11 bp = $1,690,000 a year on $1.4bn.
Billing
Weekly fee
annual fee ÷ 52
Sample: about $32,500 a week, about $6,500 a business day.
Finance
Weeks unfunded beyond target
(actual − target funding date) ÷ 7
Measured against the date agreed with the client, not the day the work started.
Onboarding manager
The client's cost
target exposure − what it holds, over the gap
Positive or negative; real either way, and the reason the client asks.
Client and consultant
Which client onboarding metrics matter for an asset manager?
Five carry most of the information: time to fund, the share of that time each party held the file, slack against the funding date, requests to the client per mandate, and the share of those answered completely the first time. Each one can be computed from timestamps a well-run onboarding already creates; none needs a survey.
They differ from the metrics a retail or wealth platform tracks, where volume is high and each account small. An institutional manager may run a few dozen onboardings at once; the sample firm had 46 in flight, $20.9 billion to fund across 17 countries, with 10 due to fund in the next 30 days. With so few, averages hide the story. A median and the slowest decile, read mandate by mandate, are more useful than a dashboard total.
The onboarding manager's numbers, as the day starts
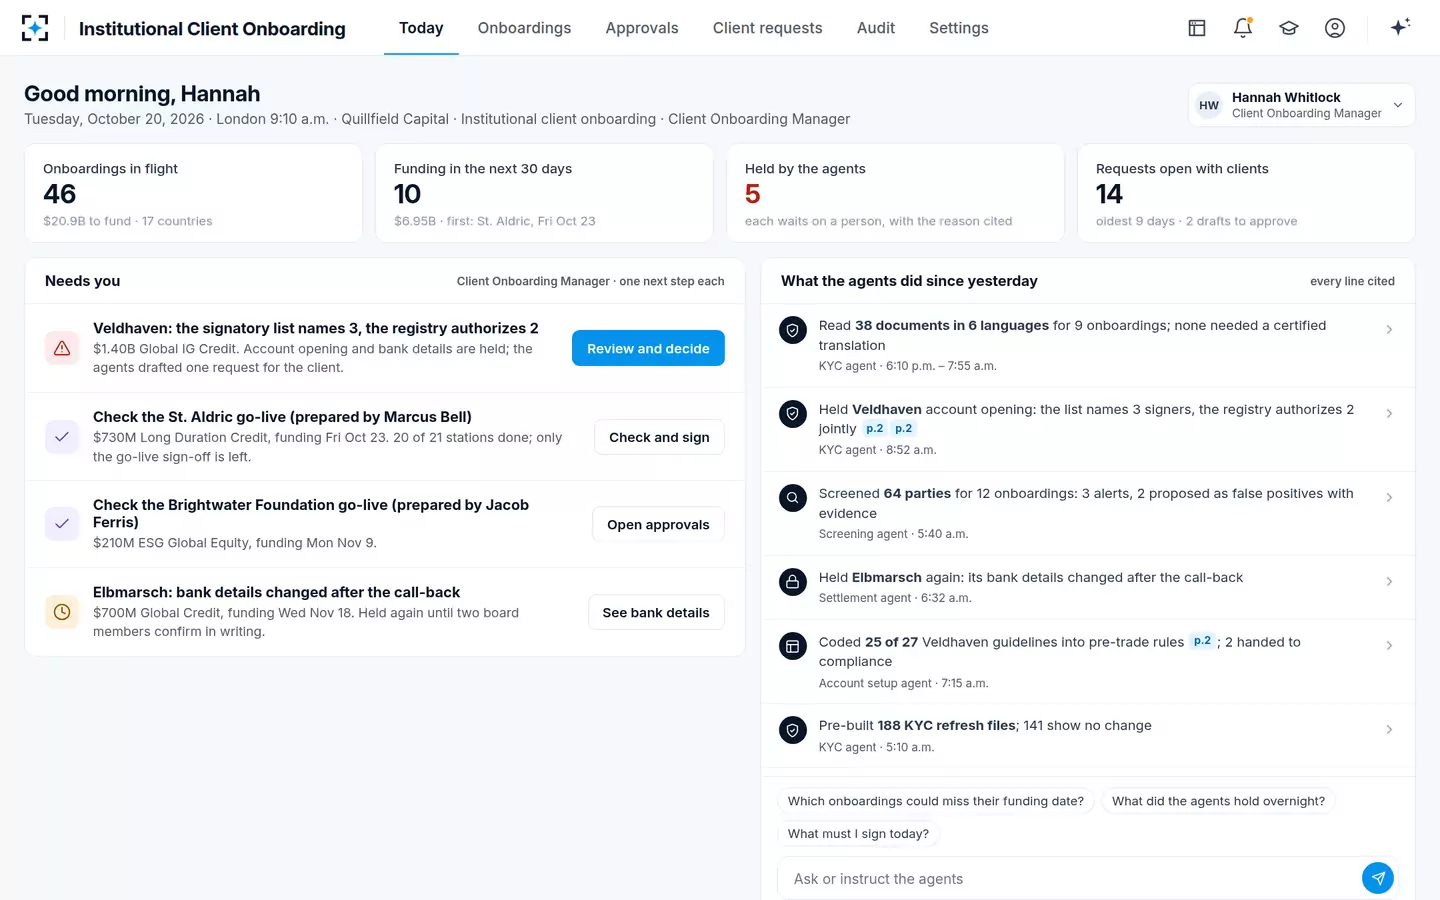
What does a week of onboarding delay cost?
For the manager, one week of the annual fee: mandate size times the blended fee rate, divided by 52. For the client, the difference between the return on the allocation it decided to make and the return on what it holds while it waits. The first is certain and easy to compute; the second can be positive or negative, which is why managers tend to ignore it and why clients and consultants do not.
The manager's cost is not a loss on paper only. An asset-based fee is charged on assets under management, so a week without assets is a week of revenue that does not come back later; the mandate does not run a week longer at the end. On the sample schedule, a funding date that slips from 20 to 27 November costs about $32,500. Across a book the numbers add up quickly. If the 10 sample mandates funding in the next 30 days, $6.95 billion in total, carried a blended 12 basis points, which is our assumption for illustration, each week of delay across all of them would be worth about $160,000.
Fees not yet earned on one $1.4 billion mandate, by weeks of slip
The client's cost has a different shape. The research on how plan sponsors hire managers suggests why it is easy to overstate and hard to ignore: a study of the hiring and firing decisions of 3,400 plan sponsors from 1994 to 2003 found that sponsors tend to hire managers after strong excess returns, and that those returns do not, on average, continue after the hire (Goyal and Wahal, Journal of Finance, 2008). The waiting period therefore is not a missed rally to price; it is a period in which the client holds an allocation it decided to change. The honest measure is tracking against the new mandate's benchmark from the target funding date, reported to the client as a fact rather than an apology.
Why is time to fund a better metric than time to open?
Because an account can be open for weeks before it can take money or trade. Custody and cash accounts are one line of six; the signer proof, the call-back on bank details, the coded guidelines and the go-live sign-off all have to finish too. A metric that stops at account opening reports success while the fee clock is still at zero.
The Veldhaven sample shows the gap. Its custody account opened on 16 October and its euro cash account on 19 October, more than a month before the planned funding on 20 November. On day 22 of 53 the go-live sign-off still listed five open prerequisites, among them every signer proven, the bank details called back and the MLRO's approval of the risk rating. Time to open was done; time to fund was the number at risk.
How do you measure onboarding time without a benchmark?
Measure your own last twelve months of mandates, from the award date in the CRM to the date assets arrived, and split each one by station and by who held it. No regulator or independent study publishes institutional onboarding times, and vendor surveys mix client types and definitions, so your own files are the only benchmark that means anything.
The method is four steps. First, fix the two end points: award as logged in the CRM, and funding as the date the custodian confirmed assets in the account. Second, list the stations each mandate passed through and date each one's start and finish. Third, tag each interval with who held it: the client, an internal team, or a third party such as the custodian or the outgoing manager. Fourth, report the median and the slowest decile, mandate by mandate, and the share of the total each party held. In the sample firm's estimate the client's own documents and decisions are the largest share, which is a reason to change how the client is asked, not a reason to blame the client.
The same onboarding, split by station: every block shrinks, none disappears
By hand, 71 days
- Client documents and answers · 28%
- KYC and screening · 21%
- Signers and bank details · 17%
- Accounts and trading · 15%
- IMA, guidelines, fees · 14%
- Tax forms · 5%
With the solution, 45 days
- Client documents and answers · 27%
- KYC and screening · 20%
- Signers and bank details · 16%
- Accounts and trading · 18%
- IMA, guidelines, fees · 15%
- Tax forms · 4%
Read the two bars together and the point is that shares barely move while the total falls. The agents shorten every block, and none disappears: the client still has to sign, the custodian still has to open accounts. What shrinks is the time each block spends waiting for a translator, an email reply or a second request. That is also why the solution's target is stated as fewer days from award to funded, about 35% fewer, rather than as the elimination of any one step.
Which quality metrics explain the days?
Four: requests per mandate, first-time-right requests, holds per mandate with their reasons, and disagreements between two independent readings. Each one is a cause of elapsed time that the time metric alone cannot show.
Requests per mandate is the most actionable. Every separate request to a client starts its own cycle inside the client's organisation, and when the answer needs a board, each cycle can take weeks. On the Veldhaven sample, three teams would each have written about one signer problem; one board decision fixed all three, so the solution sent one request instead of three. First-time-right measures the other half: the share of requests the client could answer completely without coming back with a question.
One request in plain words, with the date it protects
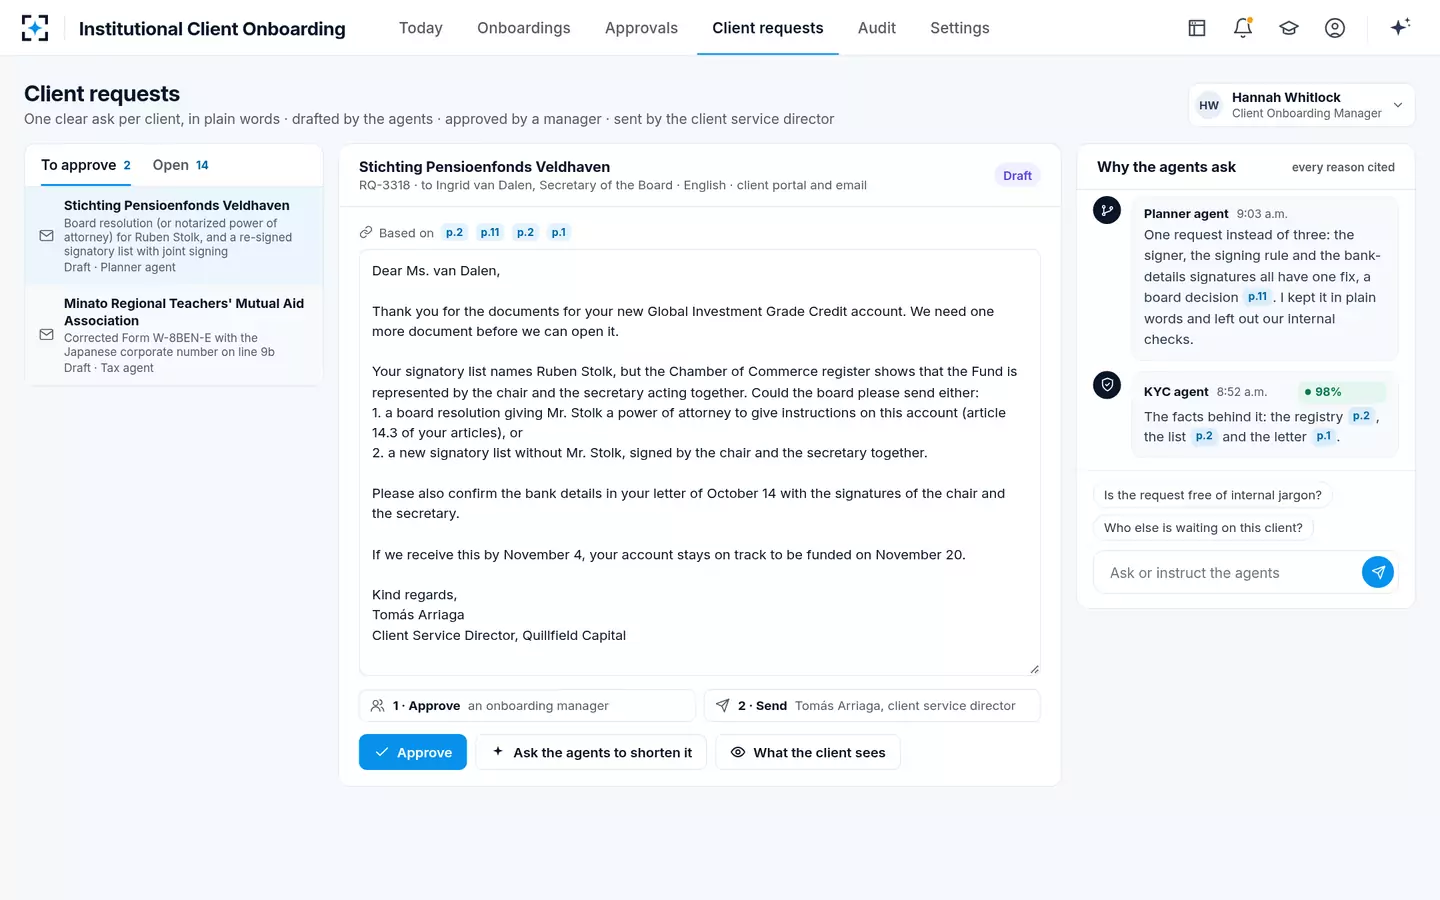
Holds and disagreements are quality metrics for the manager's own work. A hold that cites its reason and the person it waits on can be cleared; one that sits in an inbox cannot. Disagreements between two independent readers of the same document, such as the two readings of the Veldhaven fund's pension assets, measure how often the source itself is ambiguous; their resolution time measures how quickly a person settles them.
Does the first invoice count as an onboarding metric?
It should. The fee schedule is loaded into billing during onboarding, and the first invoice is the first test of whether it was loaded as the IMA says. SEC examiners have found advisers billing outside their agreements: in June 2026 the Division of Examinations reported fees calculated out of line with advisers' Form ADV disclosures or their written agreements, whether the original agreement, a renegotiated fee arrangement or a fee addendum (SEC Division of Examinations, risk alert, 9 June 2026).
"First invoice matches the IMA" is therefore a one-line metric with an outsized value: a share of new mandates whose first bill needed no correction. In the sample, the billing set-up line shows the schedule with its tiers, and the go-live sign-off cannot complete until the fee schedule is in billing. How the agreement's fee terms are read and checked in the first place is the work of Investment Management Agreement Review, and what a billing error costs once found is worked through in its own guide.
How should onboarding targets be set for each station?
Back from the funding date, station by station, rather than as one number for the whole process. A single target, such as "fund within 45 days", gives no one a deadline until it is missed. A latest-finish date for each station, worked back from the date agreed with the client, tells each owner what they must deliver and when, and turns the total into something that can be managed day by day.
The sample shows how the dates fall out. Working back from Friday 20 November, the Veldhaven board's resolution was due by Wednesday 4 November, which left time for the call-back, the bank-details approval and the go-live sign-off and check. The Planner agent recomputes that slack each morning; the mandate had 11 business days of it on day 22, and the owner is warned when a station goes two days into negative slack. A target per station is also the honest way to use the solution's design target of about 35% fewer days: it is reached, or not, one station at a time, and the scorecard should show which stations moved.
What should an onboarding scorecard show each month?
One page per month, with each metric defined so that two people would compute the same number. The scorecard below is a starting point; the sample column is the fictional manager's, and every row is drawn from the stations and timestamps the work already leaves behind.
An onboarding scorecard with a formula and an owner for each line
| Metric | Formula | Owner | Sample |
|---|---|---|---|
| Time to fund | Median and slowest decile of days from CRM award to assets confirmed by the custodian | Head of onboarding | 71-day median last year (baseline) |
| Waiting share by party | Days held by the client, internal teams and third parties ÷ total days | Onboarding manager | About 20 of 71 days waiting on the client (estimate) |
| Mandates at risk | Mandates with negative slack to the funding date, counted weekly | Onboarding manager | Owner warned at two days of negative slack |
| Requests per mandate | Requests sent to the client ÷ mandates funded | Client service director | One request instead of three on Veldhaven |
| First-time-right requests | Requests answered completely without a follow-up ÷ requests sent | Client service director | Measured once live |
| Reader disagreements | Values where two independent readings differ ÷ values extracted; median days to resolve | KYC lead | 1 of the Veldhaven file's values |
| Bank details proven | Accounts funded only after a call-back and a second person ÷ accounts funded | Operations control | Target: every one |
| First invoice right | First invoices needing no correction ÷ new mandates billed | Billing manager | Measured once live |
The design targets the scorecard is built to measure
35%
fewer days from mandate award to funded account
0
accounts funded to bank details without a call-back and a second person
1
request to the client instead of three on the sample mandate
A scorecard is only as good as the timestamps under it, which is why the measurement belongs in the system that runs the work. The guide to the asset management client onboarding process maps the stations these metrics are computed over, and best client onboarding software for asset managers shows how to baseline them on last year's mandates before a first live onboarding. The full sample mandate is on the Institutional Client Onboarding page.
Questions people ask
How long should the onboarding process take for an institutional client?
There is no published standard. A useful target is the date agreed with the client and its consultant at award, worked back station by station, rather than a market average. The fictional manager in these guides had a 71-day median and a design target of about 35% fewer days.
What are client onboarding KPIs?
They are the numbers a firm uses to judge its onboarding: time to fund, waiting share by party, mandates at risk, requests per mandate, first-time-right requests, disagreements between readers, bank details proven and first invoice right. Each should have a formula and an owner. A KPI without a formula becomes an opinion within a quarter.
Should onboarding time be measured in business or calendar days?
Calendar days for time to fund, because fees and the client's exposure accrue every day. Business days for slack against a deadline, because that is how the work is scheduled. The sample uses both: a 71-day calendar median and 11 business days of slack on day 22 of the Veldhaven mandate.
Are there client onboarding statistics for asset managers?
No regulator or independent study publishes institutional onboarding times or loss rates. Figures that circulate usually come from vendor surveys with mixed samples and definitions. A firm's own twelve months of mandates, measured as on this page, is a better basis for a decision.
What does client onboarding success look like?
The account is funded on the date agreed at award, the client was asked for each thing once, every signer and bank detail was proven before money moved, and the first invoice matched the agreement. Each of those is measurable. Speed without the last three is a risk rather than a success.