A typical liquidity stress testing Excel example has three tabs: the fund's positions sorted into liquidity buckets by how many days each takes to sell, a redemption shock such as 15% of net assets over five days, and a calculation that divides the assets sellable within the horizon by the outflow to give a redemption coverage ratio. It is quick, transparent and accepted by many committees, and it answers a narrower question than ESMA's guidelines ask, because it usually leaves out the fund's own holders, margin calls, stressed trading volumes and the order in which the fund would really sell. The fairest way to judge a replacement is not a demonstration but a replay: run last quarter's funds and scenarios through the new approach, set the results beside the spreadsheet's line by line, and accept only differences that can be explained. Botminds' Liquidity Stress Testing is offered on exactly that basis, a pilot on a past quarter of your own positions, register and fund documents.
What the spreadsheet is being compared with
1day
Botminds' target from completed runs to signed committee papers
6 → 1days
Botminds' estimate of one cycle's assembly and checking, by hand and with the agents
214figures
in the sample quarter's 64-page committee papers, each linked to the run that produced it
A liquidity stress testing Excel example, worked through
Take a hypothetical $1 billion bond fund that deals daily. The spreadsheet buckets its holdings by days to sell at normal volumes, applies a 15% outflow over five days, and counts what can be sold within those five days. The arithmetic below is ours and the fund is illustrative, not the solution's sample.
The spreadsheet: buckets, a shock and a coverage ratio
| Bucket | Share and value | Days to sell (normal) | Counts within five days? |
|---|---|---|---|
| Cash | 3% · $30 million | 0 | Yes |
| Government bonds | 20% · $200 million | 1 | Yes |
| Investment-grade corporate bonds | 35% · $350 million | 2–5 | Yes |
| High-yield bonds | 32% · $320 million | 6–20 | No |
| Private placements and other | 10% · $100 million | Over 20 | No |
| Result | Sellable within five days $580 million ÷ outflow $150 million | — | Coverage ratio 3.9: pass |
Nothing in that table is wrong. Each bucket can be defended, the shock is larger than most funds have ever seen, and a coverage ratio of 3.9 suggests a wide margin. ESMA would recognise the shape: its guidelines treat time to liquidity and liquidation cost as the two main ways to model the asset side, and the redemption coverage ratio as a fair summary of whether a fund's assets can meet what its liabilities demand (ESMA34-39-897, paragraphs 43 and 70). The problem is what the three tabs do not contain.
What the spreadsheet leaves out
Four things, each defensible to omit on its own and each large. Add them one at a time to the same hypothetical fund and the coverage ratio falls from 3.9 to just above 1, without a single cell in the spreadsheet's format changing.
The same fund's coverage ratio as the missing assumptions go in
The fifth omission is the sale order, which the coverage ratio hides entirely. The spreadsheet counts the most liquid assets first; a fund that actually sold that way would leave the investors who stay with a portfolio of high-yield bonds and private placements. The FCA found exactly this in its 2023 review and recommended a pro rata slice instead, with real stresses applied to volumes and participation rates (FCA, July 2023). Why a model can pass and still be wrong works through the sale-order effect on the solution's sample fund.
Can a spreadsheet meet ESMA's liquidity stress testing guidelines?
In principle, yes: the guidelines prescribe outcomes, not tools, and are to be applied in proportion to each fund's nature, scale and complexity (paragraph 7). In practice, the spreadsheet above would struggle with several explicit expectations: investor type and concentration as risk factors (paragraph 50), "other types of liabilities" such as margin calls (paragraph 57), and simulated "reductions in asset liquidity" in stressed conditions, without assuming that a portfolio sells at an asset's whole daily volume unless the evidence supports it (paragraph 39). A spreadsheet can contain all of these; most do not, because each one multiplies the inputs that must be pulled together by hand.
Documentation is the other weak point. ESMA's 2020 review of UCITS liquidity management found cases where "there was no documentation available or a lack of granularity/clarity was detected in various key areas such as pre-investment liquidity analyses and forecasts, design phase, escalation processes and verification of data reliability" (ESMA34-43-880). A spreadsheet's logic lives in its formulas, its versions in file names, and its approvals in email.
Can we pilot on last quarter's funds?
Yes, and it is the most informative pilot available, because last quarter already has an answer your committee accepted. Replaying it removes the two things that make vendor demonstrations hard to judge: invented data and invented scenarios. The pilot runs your funds, through your scenarios plus any the agents propose from your register, under your policy's settings, and its results are set beside the spreadsheet's for the same date.
ESMA's guidelines give a governance reason to do this anyway. The LST policy must provide for a periodic review of the test, with its results documented and a way to amend the policy when the review calls for it (paragraph 24(e)), and the FCA's good practice includes "A thorough end to end process test or 'war gaming' ... to simulate large redemptions followed by implementation of a 'lessons learned' exercise". A replay of last quarter is that review, with a second method as the challenger.
A four-week liquidity stress testing pilot on last quarter, week by week
Four weeks is enough for a range of a few dozen funds if the extracts are ready; a larger range takes the same steps with more funds in each. The plan below is the one we propose, with what the agents do and what your team does in each week.
A four-week pilot of Liquidity Stress Testing on last quarter: what the agents do and what your team does
- Connect and loadWk 1
- ReplayWk 2
- Explain differencesWk 3
- Draft papersWk 4
- Supply extractsWk 1
- Approve scenariosWk 2
- ReconcileWk 3
- Dry run, decideWk 4
The plan front-loads the data and back-loads the judgement on purpose. Week 3 is where a pilot succeeds or fails: every difference between the spreadsheet's result and the agents' result should come with an explanation, a classification that moved, a holder the spreadsheet did not see, a margin call it left out, and your team decides whether each explanation is right. A difference nobody can explain is a finding against whichever method produced it.
What data does a liquidity stress testing pilot need?
The same data last quarter's spreadsheet used, plus the register. Concretely: positions at the quarter-end date from the order management system; the transfer agent's register with holder types and as much daily or weekly flow history as exists; market liquidity data, volumes, bid-ask spreads and dealer quotes, from the vendors you already use; official net assets and share classes; margin, eligible collateral and credit line allocations; and the documents that set the rules, the LST and liquidity management tool policies, prospectuses and supplements.
Two practical points decide how fast week 1 goes. Extracts are enough; a pilot does not need live connections. And the register matters more than any other input: if holders sit behind nominee or platform accounts, the pilot can only model concentration as far as the register shows it, which is worth knowing before the first run. Where funds are domiciled in the EU and the US, the solution keeps EU funds' data in the EU region and US funds' data in the US.
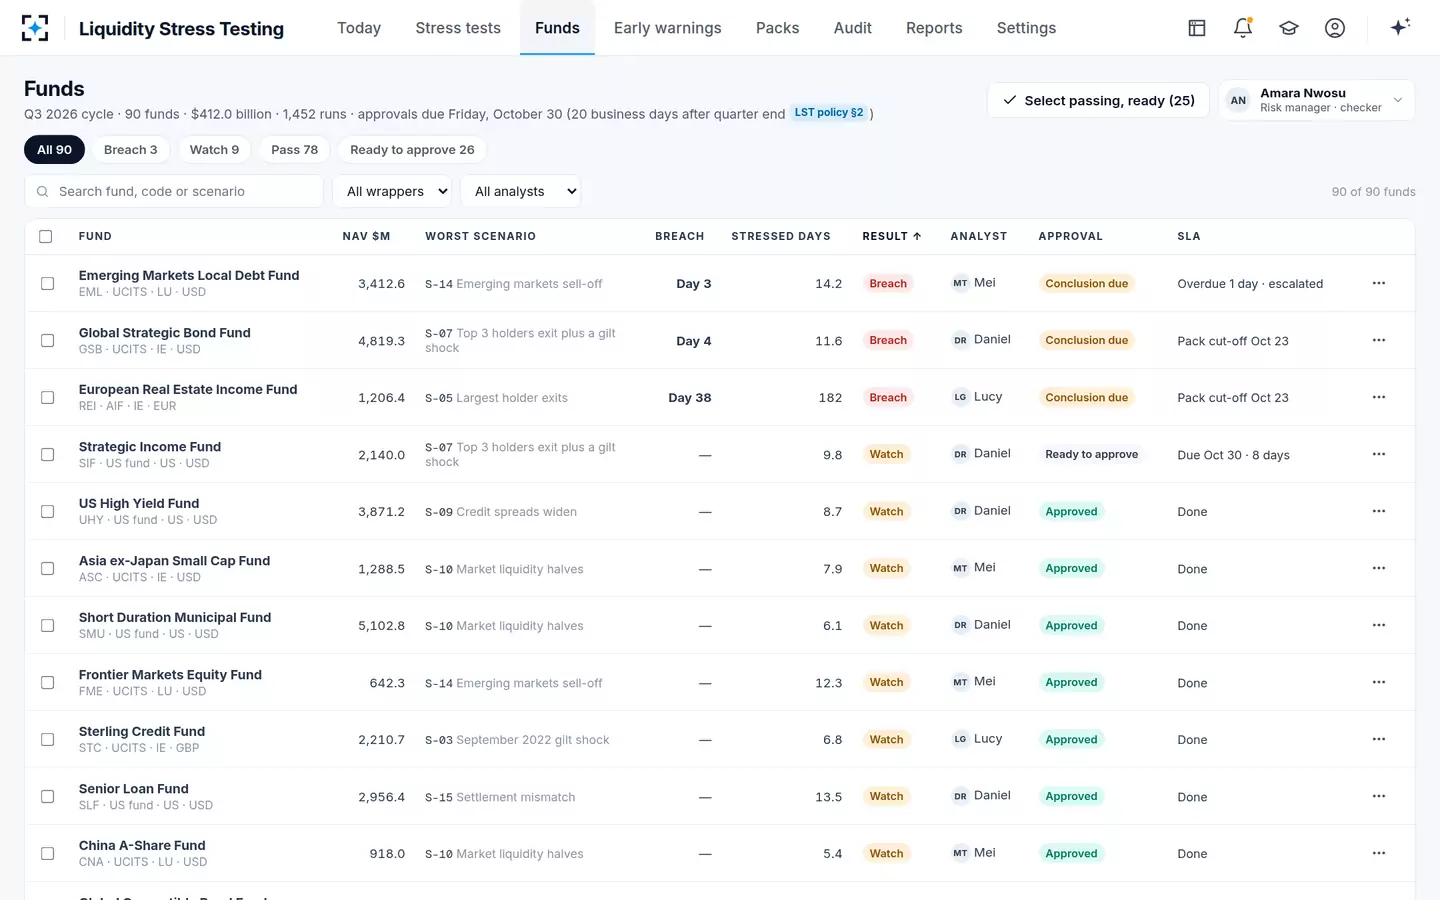
The replayed quarter as a fund queue in Liquidity Stress Testing
How do we compare the pilot to our spreadsheet?
Measure by measure, fund by fund, with the explanation as the unit of comparison rather than the number. The comparison below is the template we use.
Comparing last quarter's spreadsheet with the pilot's replay
Your spreadsheet, last quarter: One coverage ratio per fund and scenario.
The pilot's replay, same date: The day highly liquid assets run out, the coverage ratio each day, and why.
Your spreadsheet, last quarter: A percentage outflow per scenario.
The pilot's replay, same date: Outflows built from the register: holder types, concentration and history.
Your spreadsheet, last quarter: Often none.
The pilot's replay, same date: Margin, collateral, credit line allocation and settlement gaps, day by day.
Your spreadsheet, last quarter: Most liquid first, usually implicit.
The pilot's replay, same date: Both orders, with the policy's order primary and the cost to each group of investors.
Your spreadsheet, last quarter: Stale or missing inputs fixed by hand, often silently.
The pilot's replay, same date: Stale inputs flagged; results provisional until a proxy is approved.
Your spreadsheet, last quarter: Formulas, file versions and email approvals.
The pilot's replay, same date: Every figure linked to its run; every approval with its reason on the audit trail.
The differences a replay usually finds, and how to read them
Most differences between a spreadsheet and a fuller model fall into five kinds, and each points to a different decision. Reading them by kind, rather than fund by fund, is the quickest way through week 3.
Five kinds of difference between last quarter's spreadsheet and the replay
| Kind of difference | Typical cause | What it asks of the committee |
|---|---|---|
| Earlier breaking day | A holding that is liquid in normal markets moves tier in the scenario's own shock, as the sample fund's gilts did. | Whether the policy should classify by scenario, not by normal-market bucket. |
| Larger outflow | Holders from the register replace a percentage shock: concentration, investor type, a holder's own history. | Whether the scenario library reflects who owns each fund. |
| New cash calls | Margin, collateral, a shared credit line or settlement timing appear for the first time. | Whether derivatives users and funds on shared lines need tighter floors. |
| Provisional results | Inputs the spreadsheet rolled forward are flagged as stale. | Which data sources need a second provider or a documented proxy. |
| Same day, different cost | Sale order: most liquid first against a pro rata slice. | Which order the policy makes primary, and how remaining investors are protected. |
Not every difference favours the fuller model. A replay can also show a scenario the agents proposed that your risk manager judges implausible, or a proxy price your desk knows is wrong. Those belong in the reconciliation too: the pilot's job is to show which method describes your funds better, and the answer is allowed to be "both, for different questions".
Which past quarter should a pilot replay?
The most recent one, plus one that hurt. The most recent quarter has complete data and fresh memories, so differences can be checked with the people who made the original calls. A stressed quarter shows whether the method would have seen trouble coming: for sterling and euro bond funds, the third quarter of 2022; for most fixed income funds, the first quarter of 2020; for a fund that had its own bad month, that month.
ESMA's warning applies to the choice: history is one input, not the whole library, because the next stress need not look like the last (paragraph 31). A pilot that only replays history tests the method's memory, not its imagination, so the scenario library should also include the forward-looking scenarios the agents propose from today's register, approved or rejected by your risk manager like any other.
What pass and fail tests should a pilot have?
Decide them before the pilot starts and write them down, so the decision at the end is about evidence rather than impressions. The checklist is ours; adapt the thresholds to your range.
Eight tests to agree before a liquidity stress testing pilot starts
- Coverage
Every fund in scope runs through every scenario in the replayed quarter, with no fund left to a manual workaround.
- Explained differences
Every material difference from the spreadsheet comes with an explanation your team accepts or rejects in writing.
- Reproducibility
Any result can be recomputed from its inputs by someone on your team, without the vendor.
- Liability side
Margin, collateral and credit lines appear for every fund that has them.
- Register
Concentration and holder types appear for every fund whose register shows them, and the gaps are listed.
- Data flags
Every stale or proxy-priced input is flagged, and no result on such data is final without a person's approval.
- Separation of duties
Nobody can approve what they prepared; the approval chain matches your policy.
- Committee-ready output
The draft committee papers would pass your own review, with every figure traced to its run.
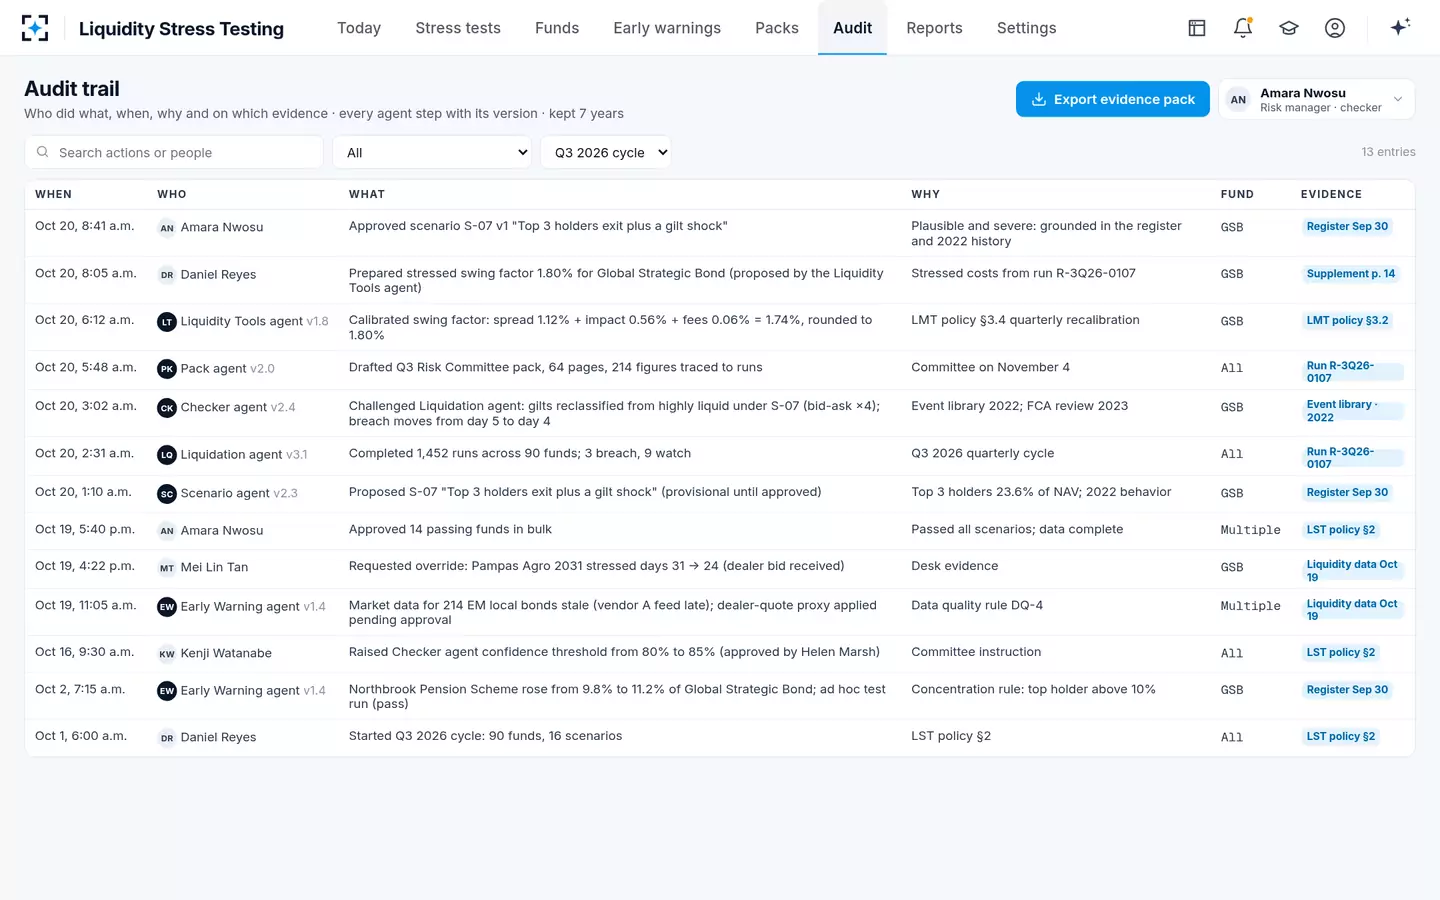
The evidence a pilot leaves behind: the audit trail in Liquidity Stress Testing
What a pilot costs, and what nobody publishes
Vendors do not publish prices for liquidity stress testing systems, and no regulator or independent study reports what fund managers spend on the quarterly cycle, so the honest comparison is with your own costs. Count the person-days your team spends on each cycle, the market data you already pay for, and the time from quarter end to signed results. Then count what the pilot needs from your team, which in our plan is concentrated in weeks 1 and 3.
The pilot itself changes nothing in your live process. The agents propose and explain; they never activate a liquidity tool, change a swing factor, send a notice or sign, and in a replay there is nothing live for them to change. To arrange a replay of your own last quarter, start from Liquidity Stress Testing; what happens after go-live, when the test moves from the calendar to triggers, is the natural next question.
Questions people ask
What should a liquidity stress testing template include?
At minimum: positions with days to liquidate and cost in normal and stressed markets, a liability side with redemptions by holder type and other cash calls, the scenarios and their reasons, the sale order, and a daily result rather than a single ratio. ESMA's paragraph 16 lists what a model must determine, from risk factors and scenarios to how results are reported and used.
How long does a pilot take?
Our plan is four weeks for a range of a few dozen funds, with your team's time concentrated in supplying extracts in week 1 and reconciling results in week 3. Larger ranges take the same steps with more funds in each, and the deciding factor is usually how quickly the register and market data extracts can be supplied.
Who should take part in the pilot?
The analyst who builds today's spreadsheet, the head of liquidity risk who approves its results, and one portfolio manager willing to challenge the outputs. The Chief Risk Officer needs to see the dry-run committee papers in week 4, and the pass and fail tests should be agreed with whoever will sign the decision.
Can the pilot include US funds as well as UCITS and AIFs?
Yes. The same scenario runs on each fund and is checked against the rulebook that applies, UCITS and ESMA's guidelines, AIFMD, or Rule 22e-4 with the fund's highly liquid investment minimum and the 15% illiquid limit, with each check citing the rule and the fund document it relied on.
What happens to the spreadsheet after the pilot?
That is your committee's decision, and many keep it for a quarter or two as an independent challenger. A second method that is genuinely independent is valuable; ESMA asks for models and assumptions to be validated independently of portfolio management, and the spreadsheet can serve as one check among several.