The SEC financial statement data sets are quarterly bulk files of every number on the face of the financial statements that companies file with the Commission in XBRL, from 2009 to the latest quarter, published free on the SEC's website. They are the cheapest complete source of as-filed balance sheets, income statements and cash flows for US registrants, and a research data lead should use them. They are also the wrong place to look for most of what an analyst's model needs on the night a company reports: segment revenue, operating KPIs, non-GAAP reconciliations, the earnings release, and every issuer that does not file with the SEC at all. Botminds' Financial Data Extraction exists for that gap. Its agents read the 10-Q, the release and the deck page by page and put each figure into the analyst's own model with a link to its page, and they use the SEC's structured data where it helps, as a cross-check.
This guide sets out what the data sets and the SEC's XBRL APIs contain, according to the SEC's own documentation, where each one stops, and how to use them safely in a model. Where it shows the solution at work, the firm and the issuers are fictional sample data.
The SEC's free financial data in four numbers
Quarterly
refresh of the Financial Statement Data Sets; the larger notes data sets refresh monthly
< 1min
typical delay before a filing's XBRL facts reach the SEC's APIs, longer at peak filing times
11.8%
of a 10-K filer's statement line-item tags were custom, on average, in fiscal 2025
14.5%
the same average for non-accelerated filers, against 8.9% for large accelerated filers
What are the SEC financial statement data sets?
They are the numbers from companies' XBRL financial statements, flattened into four tab-delimited tables and posted as one zip file per quarter. In the SEC's words, they "provide the numeric information from the face financials of all financial statements", extracted from reports filed with the Commission in eXtensible Business Reporting Language, and presented "without change from the 'as filed' financial reports" (SEC, Financial Statement Data Sets). The series runs from 2009 to September 2026 as this is written.
The scope is precise. The documentation lists the balance sheet, income statement, cash flows, changes in equity and comprehensive income, and the footnotes printed on those statements, from submissions such as the 10-K, 10-Q, 20-F and 40-F (SEC, Financial Statement Data Sets documentation). A sister product, the Financial Statement and Notes Data Sets, goes further: it holds "the text and detailed numeric information from all financial statements and their notes", and it is posted monthly (SEC, Financial Statement and Notes Data Sets).
The four tables, and the field in each that trips up a model
| Table | What one row is | The field to read before you trust it |
|---|---|---|
| SUB (submissions) | One filing: accession number, CIK, company name, form, period, fiscal year and period focus, filer status | prevrpt: set to true when the submission was later amended, so an old figure can sit beside its correction |
| NUM (numbers) | One value: tag, period end date, duration, unit, value, and since December 2024 an axis-and-member field | qtrs: the number of quarters the value covers. A third-quarter 10-Q carries both 1 and 3 for income, and only 3 for cash flow |
| TAG (tags) | One tag: standard or the filer's own, with its label, definition, data type and debit or credit balance | custom: 1 when the filer made the tag up, so the same idea has a different name at another company |
| PRE (presentation) | One line of a statement as rendered: the statement, line order and the label the filer printed | negating: whether the printed label flips the sign, which is how a positive tagged value shows in brackets |
Two details decide whether a model built on these tables is right. The NUM table's qtrs field is "the count of the number of quarters represented by the data value", so the same tag appears once for the quarter and once for the year to date, and a query that ignores it double counts. And the value is "not scaled, it is as found in the Interactive Data file": net sales printed as 814,112 in a statement "in thousands" are stored as the full dollar amount the filer tagged, so a model kept in millions must convert, and a filer's own scaling mistake passes straight through. The SEC's structured-data staff have published reminders about scaling errors more than once. A model that joins NUM to PRE and reads labels gets the filer's printed line names; one that reads TAG gets the taxonomy's names. Neither gets the analyst's names, which is the mapping problem the KPI extraction guide takes up.
How often are the SEC financial statement data sets updated?
Quarterly, and that is the main reason they do not drive a model on results night. The SEC is explicit: "Data contained in documents filed after the last business day of a quarter will be included in the subsequent quarterly posting" (SEC). A calendar-year company's third-quarter 10-Q, filed in late October, reaches the Financial Statement Data Sets only in the file for the fourth calendar quarter, posted after that quarter closes. The notes data sets move faster, monthly, with a cut-off at 5:30 PM Eastern on the last day of the month (SEC).
For speed, the SEC offers something else: JSON APIs at data.sec.gov, open to anyone without a key or a login. The SEC says the submissions API typically lags a filing by under a second and the XBRL APIs by under a minute, longer at peak filing times (SEC, EDGAR APIs); how those feeds work as alerts, and where they stop, is covered in EDGAR alerts: what the SEC's free feeds give you. A filing that lands at 4:12 PM is therefore visible to a script at 4:13, which is fast enough for any research team. What the script sees is the next question.
What changed in December 2024
In December 2024 the SEC posted reprocessed Financial Statement Data Sets. The files were "refreshed to only include the submissions and the numeric data from the primary financial statements as rendered by the Commission", and the NUM table gained a field for segments, meaning XBRL axis and member reporting (SEC). The effect for a modeler is that the compact sets now mirror what a reader sees on the face of the statements, which makes them cleaner, and that anything in the notes, including the segment note most models are built around, belongs to the larger notes data sets.
A pipeline written before that date and never re-tested may be reading a different population of facts from the one it was built for. The layout and fields stayed the same apart from the new field, so nothing breaks loudly. The check is simple: count the rows per filing in a pre-2025 extract and a current one, and see what disappeared.
What the EDGAR XBRL APIs add, and what they leave out
The APIs add speed and convenience, and they deliberately drop the facts that are hard to compare. The company-facts, company-concept and frames APIs aggregate only facts that "Use a non-custom taxonomy (e.g. us-gaap, ifrs-full, dei, or srt)" and "Apply to the entire filing entity", which the SEC says gives them "a consistent context and meaning across companies" (SEC, EDGAR APIs). That is a sound design for screening thousands of companies. It also means a company's own line items and every segment-level figure are absent by construction.
The frames API adds a second subtlety. It returns, for each company, the fact "that most closely fits the calendrical period requested", where a quarter is a duration of 91 days plus or minus 30. Companies whose fiscal quarters end in other months are slotted to the nearest calendar quarter, and the SEC's own advice is that "Data users should be mindful different reporting start and end dates for facts contained in a frame." A 52-53 week retailer and a June year-end industrial can sit in the same frame column with different quarters behind them.
Where a research model's numbers are, and where the free data stops
| What the model needs | Financial Statement Data Sets | EDGAR XBRL APIs | Where the number actually is |
|---|---|---|---|
| Face statements of a US filer | Yes, as filed, a quarter later | Yes, standard tags only, within minutes | 10-Q or 10-K, and usually first in the earnings release |
| The quarter, not the year to date | Yes for income; cash flow is year to date | Frames slot each fact to the nearest calendar quarter | Derived: year to date less the prior year to date |
| Segment revenue and profit | Face statements only since December 2024; the segment note is in the monthly notes sets | Not included: entity-wide facts only | The segment note in the 10-Q or 10-K |
| The company's own line items | Included and flagged custom | Not included: standard taxonomies only | The statement and its notes |
| Operating KPIs: orders, backlog, book-to-bill | No | No | MD&A, the release and the investor deck |
| Adjusted EBITDA and other non-GAAP measures | No | No | The non-GAAP reconciliation in the earnings release, furnished on Form 8-K |
| Issuers that do not file with the SEC | No | No | Local exchange filings, bondholder sites and data rooms |
What is a custom XBRL tag, and how common are they?
A custom tag is an element a company creates when, in its view, the standard US GAAP taxonomy has nothing appropriate for a line it reports. The SEC permits it and is candid about the cost: "the Commission has acknowledged that the use of custom tags could potentially reduce the comparability of inter-company data", and the rules limit when a filer may create one (SEC DERA, August 10, 2026). Rule 405 puts the test plainly: a filer creates a new element "if and only if an appropriate tag does not exist in the standard list of tags".
The SEC's staff measures the result every year. In fiscal 2025, an average 11.8% of a 10-K filer's line-item tags on the financial statements were custom, and 17.0% across statements and notes together. Both are close to where they were a decade earlier: 11.3% and 21.4% in 2012. The rate also depends on who is filing, and the pattern is the one that matters for coverage.
Smaller filers make more of their own tags
That gradient points the same way as vendor coverage: the companies a structured dataset handles worst are the small ones, which are also the ones a research team is least likely to find in a commercial feed. Industry matters too. The 2025 chart puts finance, insurance and real estate filers at 14.7% custom on the statements and manufacturers at 10.4%.
Is SEC XBRL data accurate?
It is as accurate as each filer's tagging, and the SEC says so on both download pages: "we cannot guarantee the accuracy of the data sets", errors may also have been "introduced into the data sets during the process of extracting the data and compiling the data sets", and the sets "are not a substitute for such filings" (SEC). The documentation adds that the data "may contain redundancies, inconsistencies, and discrepancies relative to other publication formats."
The SEC's structured-data staff publish the recurring problems. In December 2022 they reported filers tagging the same income-statement line with different elements from one period to the next, sometimes one element in the 10-Q and another in the 10-K, and wrote that "Inconsistency of element selection hinders comparability of data across filers, and across reporting periods for each filer" (SEC, December 8, 2022). In November 2023 they found the same pattern with labels (SEC, November 3, 2023), and a 2017 reminder covers values submitted with the wrong sign (SEC, July 20, 2017). A time series pulled by tag can break where nothing in the business changed.
Quality does improve with practice. Studying the first years of the mandate, Du, Vasarhelyi and Zheng found "the number of errors per filing is significantly decreasing when a company files more times" (Journal of Information Systems 27(1), 2013). That is reassuring for seasoned large filers. It is less so for a company's first filings after an IPO, and for exactly the smaller filers the custom-tag chart singles out.
Six things a research model needs that the data sets do not carry
Set the SEC's documentation against an analyst's quarterly update and the gaps are specific. Each one is a number the model needs on results night.
The release, before the 10-Q. Many US companies publish results first in an earnings release, furnished on Form 8-K under Item 2.02, often days before the 10-Q. The release's tables are not part of the tagged financial statements the data sets draw on, so the first numbers a portfolio manager asks about are not in any of the SEC's data products. The fourth quarter has its own version of this problem: there is no 10-Q at all.
Segments in the analyst's cut. Since December 2024 the compact sets hold the face statements only, and the APIs exclude dimensional facts entirely. The segment note is in the notes sets, monthly, under axis and member tags that are often custom.
Operating KPIs. Orders, backlog, book-to-bill, same-store sales and subscribers live in MD&A, the release and the deck, none of which is tagged.
Non-GAAP measures as the analyst defines them. Adjusted EBITDA arrives in the release's reconciliation table, and the analyst's own definition may differ from the company's by one line.
Recast history. When a company re-presents prior quarters for a segment change, the new figures arrive in a later filing; the data sets keep both, and nothing marks which one the model used.
Everyone else. A quarterly statement from a company listed only in Frankfurt, a Tokyo kessan tanshin, a private 144A issuer's noteholder report: none is on EDGAR. In the solution's fictional sample, 214 of a buy-side firm's 1,186 covered issuers sit in no data vendor's set either.
Financial Data Extraction picks up the filing from EDGAR, then reads the release and the deck
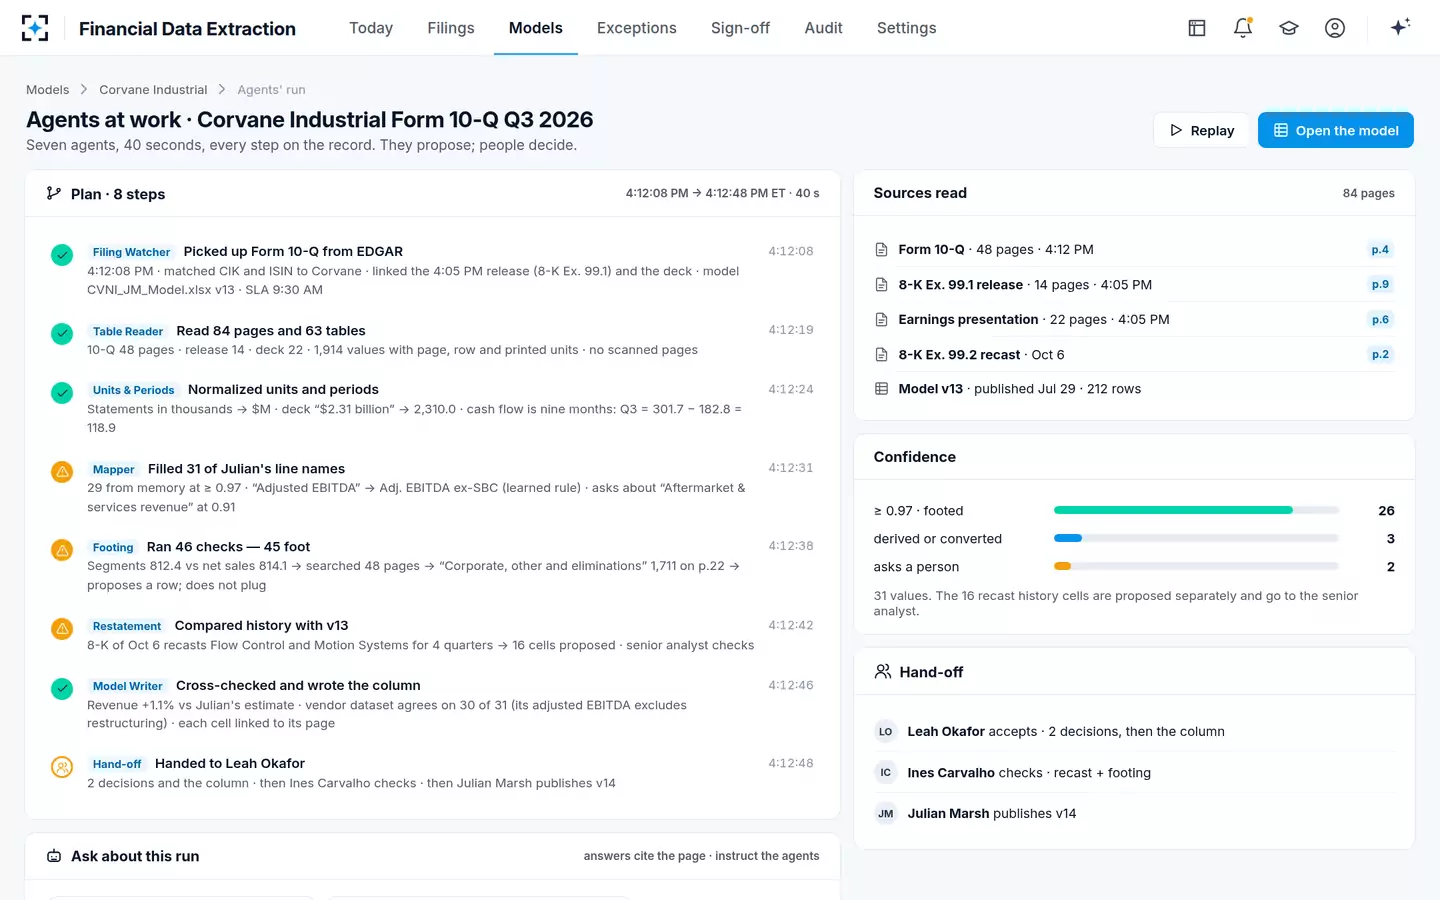
Where the free data fits beside agents that read the page
The SEC's structured data is the right tool for screening, history and cross-checks, and a weak tool for the model on the night. A sensible stack uses it for what it does well and reads the documents for the rest.
In Financial Data Extraction the Filing Watcher picks up the 10-Q from EDGAR as it is disseminated and links the release and the deck already on file. The Table Reader then records every value from all three documents with its page, row, column and printed units, and the Footing agent adds the segments to consolidated revenue. In the fictional sample, Corvane Industrial's three segments added to $812.4 million against net sales of $814.1 million; the missing $1.7 million was a corporate and eliminations line on page 22 that the analyst's model had never carried. A tag-level pull would have returned all four numbers without saying that they do not foot.
One cell's lineage in Financial Data Extraction: filing, page, row, units, mapping, checks
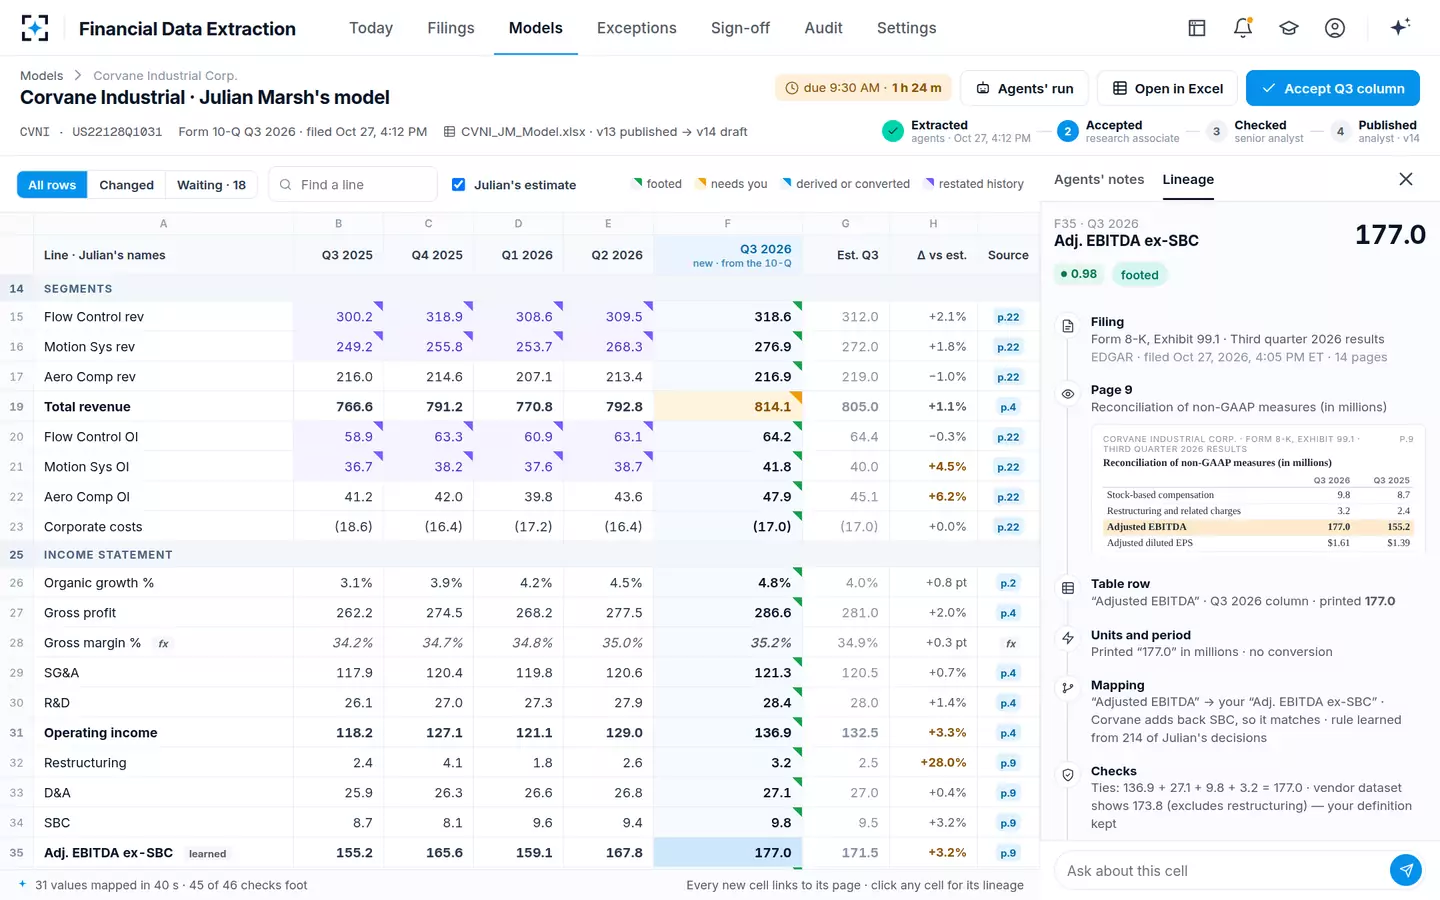
Where a structured figure exists, it is a useful second opinion. The question for a buyer is what costs more per season, the hours spent reconciling free data to the page or a tool that starts from the page, and the cost comparison of financial data extraction software works that through option by option.
Using the SEC's financial data in a model without being caught out
- Filter on qtrs, never on the tag alone
Income-statement tags carry the quarter and the year to date; cash flow in a 10-Q is year to date only.
- Convert the units yourself
Values arrive as the full amounts tagged, not in the thousands or millions printed. Compare one total with the rendered statement before loading a series.
- Flag custom tags and tag changes
A custom tag or a new element on the same line is a series break until a person says it is not.
- Keep the accession number on every value
It is the only way back to the filing, and SUB's prevrpt field says when that filing was later amended.
- Do not wait for the quarterly file
Use the APIs or the filing itself on results night; use the bulk sets for history and screening.
- Read the page for segments, KPIs and non-GAAP
They are outside the compact sets and the APIs by design.
Questions people ask
Are the SEC financial statement data sets free?
Yes. The data sets, the notes data sets and the data.sec.gov APIs are free and need no API key. Automated access must follow the SEC's fair-access policy, which caps request rates and asks every script to declare who it is in its user-agent header.
What is the EDGAR XBRL API?
It is a set of JSON endpoints at data.sec.gov: company facts (every standard-taxonomy fact a company has filed), company concept (one tag over time) and frames (one tag across all companies for a period). It is updated within about a minute of a filing being disseminated, and it includes only non-custom, entity-wide facts.
Do the SEC data sets include KPIs or segment data?
Not KPIs: operating metrics in MD&A, releases and decks are not tagged. Segment data is in the monthly Financial Statement and Notes Data Sets, under axis and member tags; since December 2024 the compact data sets hold face-statement values only, and the APIs exclude segment-level facts.
Do the data sets cover foreign companies?
Only companies that file with the SEC in XBRL, such as foreign private issuers on Forms 20-F and 40-F. A company listed only in Frankfurt, Tokyo or Seoul is not in them, and neither is a private issuer of 144A bonds.
Can a research model run on the SEC data alone?
For the face statements of large US filers, history and screening, largely yes. For results night it cannot: the release comes first and is not tagged, the bulk files update quarterly, and segments, KPIs and non-GAAP measures sit outside the compact sets.
How does Financial Data Extraction use SEC data?
The Filing Watcher picks up filings from EDGAR as they are disseminated, and the agents read the documents themselves so that every value carries its page. Structured data and a vendor dataset, where one exists, serve as cross-checks; a difference is shown to the associate rather than resolved silently.