KPI extraction is the work of pulling a company's key performance indicators, the operating metrics it reports beside its financial statements, out of its filings and presentations and into an analyst's model: orders, backlog, book-to-bill, same-store sales, subscribers, average revenue per user, and the company's own adjusted measures. It is harder than extracting the income statement because KPIs are defined by each company, sit in narrative sections and slides rather than in tagged statements, and change definition without warning. The reliable way to do it is a field-to-source map: for each line in the model, the document, page, table, unit and definition it comes from, checked every quarter. Botminds' Financial Data Extraction keeps that map for each analyst, reads the 10-Q, the release and the deck for every covered company, and asks a person whenever a metric's label or definition moves.
The worked examples come from a fictional sample company in the solution. The rules are the SEC's and ESMA's, as they stand in October 2026.
A field-to-source map for one industrial company's quarter
| Model line | Where it is printed | As printed | Into the model | The check |
|---|---|---|---|---|
| Net sales | 10-Q, statement of operations, page 4 | 814,112 (in thousands) | 814.1 | Equals the sum of segments plus the reconciling line |
| Segment revenue (three lines) | 10-Q, Note 14 Segment information, page 22 | 318.6 · 276.9 · 216.9 | Same | Adds to 812.4; the $1.7M gap is corporate and eliminations on the same page |
| Orders | Investor deck, page 6 | $862.9M | 862.9 | Book-to-bill: 862.9 ÷ 814.1 = 1.06x, as the deck prints |
| Backlog | Investor deck, page 6 | "$2.31 billion" | 2,310.0 | Scale converted; the rounding is the company's, flagged as such |
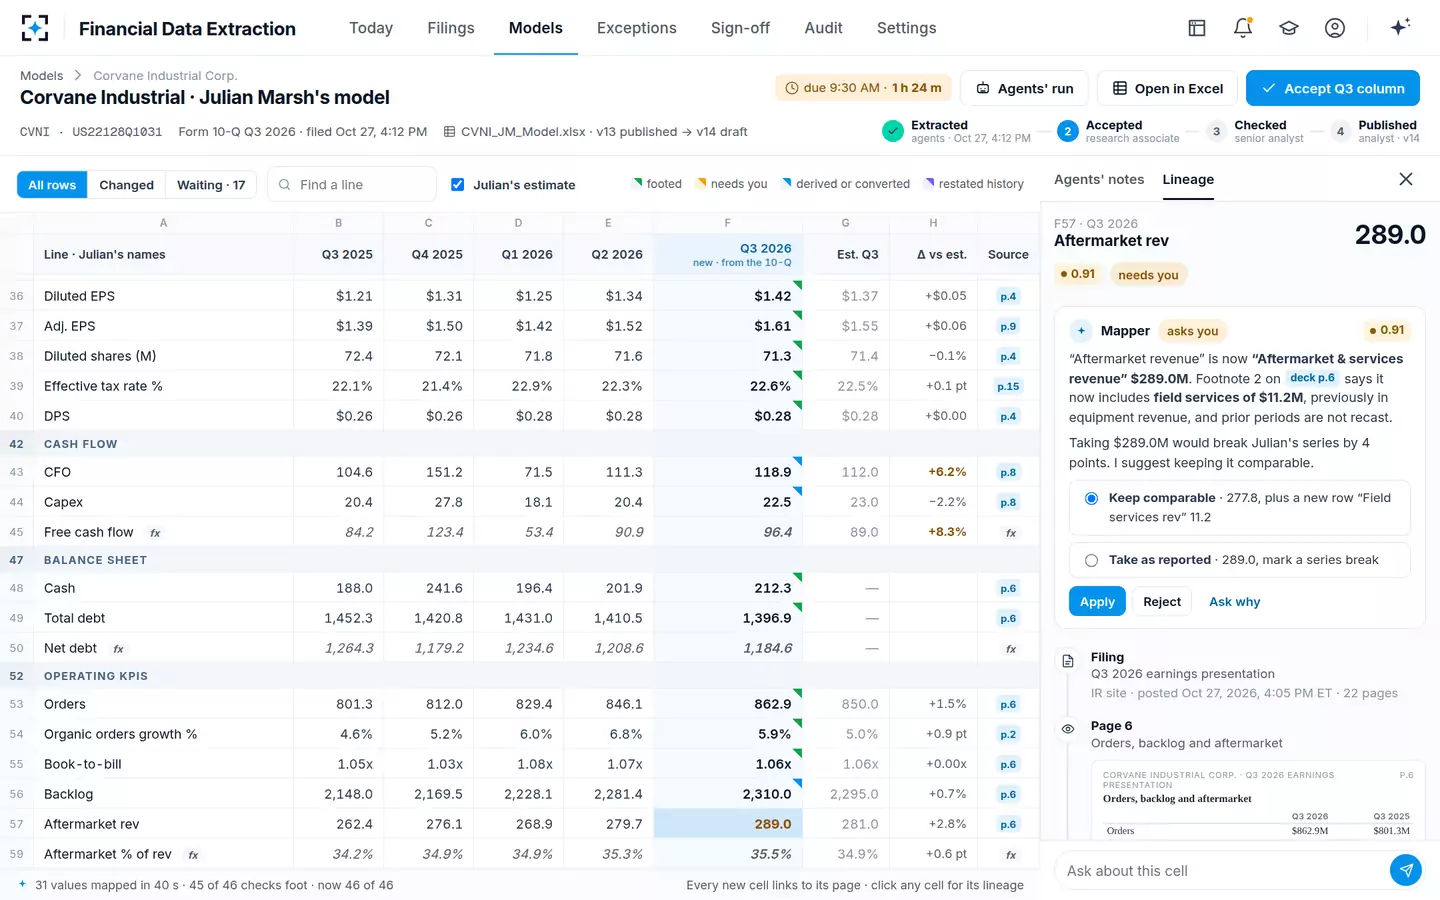
| Aftermarket revenue | Investor deck, page 6, footnote 2 | $289.0M, now including field services | 277.8 plus a new line of 11.2 | Definition changed: the series is kept comparable by a person's decision |
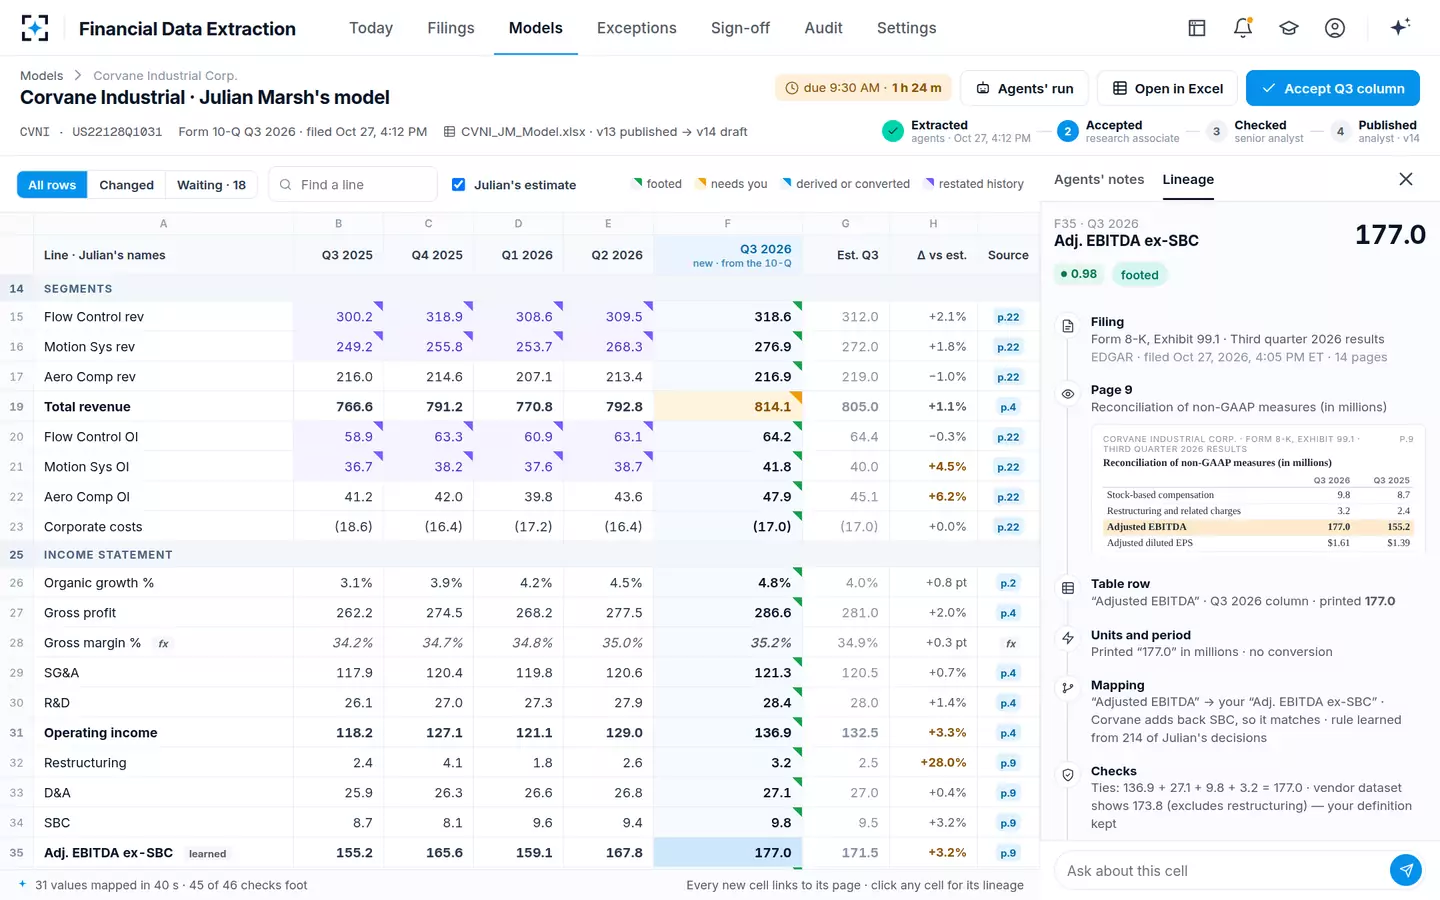
| Adj. EBITDA ex-SBC | Earnings release (8-K Exhibit 99.1), page 9 | 177.0 | 177.0 | Ties to the reconciliation: 136.9 + 27.1 + 9.8 + 3.2 |
| Cash from operations | Statement of cash flows, page 8 | 301.7 for nine months | 118.9 | Derived: nine months less six |
What is KPI extraction?
KPI extraction is financial data extraction for operating metrics: the same reading, mapping and checking applied to numbers that are not in the financial statements. The SEC's own view of why companies report them goes back to 1980. In its 2020 guidance on key performance indicators, the Commission repeated what it had said then, that "[f]or each business, there is a limited set of critical variables which presents the pulse of the business" (SEC Release 33-10751, January 30, 2020).
"[F]or each business, there is a limited set of critical variables which presents the pulse of the business."
SEC, quoted in Release 33-10751 (2020) from its 1980 MD&A proposal
Those variables are exactly what analysts model. The guidance lists examples: operating margin, same store sales, sales per square foot, total customers or subscribers, average revenue per user, daily or monthly active users, net customer additions, traffic growth and employee turnover, among others. It also notes how idiosyncratic they are: "Some companies voluntarily disclose specialized, company-specific sales metrics, such as same store sales or revenue per subscriber." An industrial company's version is orders, backlog, book-to-bill and aftermarket revenue.
Where do companies disclose KPIs?
In three places, often in this order of arrival: the earnings release, the investor presentation, and the MD&A of the 10-Q or 10-K. The release and the deck usually come on results day; the 10-Q may follow days later. The deck can carry metrics the filing does not, and it carries them as slides with footnotes, rounded, sometimes in a different unit from the release.
None of the three is in the SEC's structured data. The tagged part of a filing is the financial statements, face and footnotes, and a short list of other items; MD&A metrics, release tables and slides are outside it (what the SEC's data sets hold sets out the boundary). The SEC's XBRL APIs also leave out every company-specific tag by design, aggregating only facts that use a standard taxonomy (SEC, EDGAR APIs). For KPIs, the page is the only source.
What does the SEC expect when a company reports a KPI?
A definition, a reason and a use. The 2020 guidance says the Commission "would generally expect" a metric in MD&A to come with a clear definition of the metric and how it is calculated, a statement of why it provides useful information to investors, and a statement of how management uses it; and a company should consider whether there are "estimates or assumptions underlying the metric or its calculation" that need disclosing for the metric not to be materially misleading (Release 33-10751). The guidance applies to MD&A under Regulation S-K and, by its own terms, to MD&A in Form 20-F.
It also reaches into the company's controls. "Effective controls and procedures are important when disclosing material key performance indicators or metrics that are derived from the company's own information," the release says. For an analyst this matters in one practical way: a KPI's definition is supposed to be written down somewhere in the filing. A field-to-source map should point to that definition as well as to the number.
KPI, non-GAAP measure or GAAP line: three different rulebooks
Not every number outside the statements is a non-GAAP measure, and the difference decides what the company must print next to it. Regulation S-K says, for its non-GAAP rules, that non-GAAP financial measures exclude operating and other statistical measures (17 CFR 229.10(e)(4)), and the KPI release recalls the Commission's view that measures "such as unit sales, numbers of employees, numbers of subscribers, or numbers of advertisers are not non-GAAP financial measures". Orders and backlog fall on the KPI side. Adjusted EBITDA falls on the non-GAAP side.
Three kinds of number, three sets of rules
| GAAP line | Non-GAAP financial measure | Operating KPI | |
|---|---|---|---|
| Examples | Net sales, operating income, cash from operations | Adjusted EBITDA, adjusted EPS, free cash flow | Orders, backlog, book-to-bill, subscribers, same-store sales |
| Where defined | The accounting standards | By the company, under Regulation G and Item 10(e) | By the company, under the 2020 MD&A guidance |
| What must sit beside it | The audited or reviewed statements | The most directly comparable GAAP measure and a reconciliation | A definition, why it is useful and how management uses it |
| What a model maps it to | A fixed line, checked by footing | The analyst's own definition, tied to the reconciliation | A line whose definition is stored and compared every quarter |
For non-GAAP measures, Regulation G gives the extraction a built-in check. A company that publicly discloses one must present the most directly comparable GAAP measure and "A reconciliation (by schedule or other clearly understandable method)" of the differences (17 CFR 244.100(a)). The reconciliation is the map: an extracted adjusted figure should tie to it line by line, and an analyst whose definition differs from the company's can rebuild their own figure from the reconciling items. IFRS reporters face a new version of this from 2027, covered in the guide to management-defined performance measures under IFRS 18.
A non-GAAP figure traced to its reconciliation in Financial Data Extraction
What happens when a company changes a KPI definition?
The series breaks, whether or not the label changes, and the company may or may not recast the history. The SEC's guidance asks a company that changes how it calculates or presents a metric to consider disclosing the differences, the reasons and the effects, and adds: "Depending on the significance of the change(s) in methodology and results, the company should consider whether it is necessary to recast prior metrics to conform to the current presentation" (Release 33-10751; the staff repeat it in the Financial Reporting Manual, 9230.2). Consider is not must. A company can widen a metric and leave prior periods on the old basis.
European issuers work under firmer words. ESMA's guidelines on alternative performance measures say "The definition and calculation of an APM should be consistent over time", and where an issuer redefines one in exceptional circumstances it should explain the changes and the reasons and "provide restated comparative figures" (ESMA Guidelines on Alternative Performance Measures, ESMA/2015/1415). Even then, the restated comparatives may sit in a footnote of a slide.
In the fictional sample, Corvane Industrial's deck renamed "Aftermarket revenue" as "Aftermarket & services revenue", $289.0 million, and footnote 2 on page 6 said it now included $11.2 million of field services previously in equipment revenue, with prior periods not recast. Taking $289.0 million as reported would have shown aftermarket growth that was partly a reclassification.
A redefined KPI: two honest choices, one wrong one
Take it as reported: 289.0, the new definition
Keep the series comparable: 277.8 on the old definition, plus a new line, field services, of 11.2
Take it as reported: A jump that is partly a reclassification; the break must be marked on the series
Keep the series comparable: Like-for-like growth from 279.7 in the prior quarter
Take it as reported: The new definition, the page and a series-break flag
Keep the series comparable: The page, the footnote, the decision and who made it
Take it as reported: Entering 289.0 into the old series without a mark
Keep the series comparable: Entering 289.0 into the old series without a mark
Financial Data Extraction asks before mapping a relabeled KPI
Why KPIs are harder to extract than the financial statements
Four things make KPIs harder, and none of them is reading the digits. First, there is no checksum: a balance sheet balances and segments foot to the total, but orders do not foot to anything except, loosely, book-to-bill. Second, the label is the company's, so the same idea has different names across issuers and sometimes across quarters at one issuer. Third, the unit and rounding are the presenter's: a deck that says "$2.31 billion" gives three significant figures where the model holds five. Fourth, the definition lives in a footnote or a separate paragraph, and changes there are what break series.
That is why a KPI line needs more in its map than a statement line. The extraction itself, finding 862.9 on page 6, is the easy part. The map entry also has to carry the definition as last read, the unit and rounding as printed, and the check that relates the metric to something else the company reported. When a recast moves history instead of a definition, the same discipline applies, and the guide to recasts and restatements shows it on the segment lines.
How is a KPI map built, and how does it stay current?
It starts from the analyst's workbook, not from a template. The model already names every line the analyst cares about and, implicitly, where each came from last quarter; the first job is to write that down, line by line, as document, page, label and definition. After that, each new filing is a comparison: the same label on the same kind of page with the same definition maps without fuss, and anything that differs is a question for a person.
In Financial Data Extraction that comparison is the Mapper's job, and its memory is the analyst's own decisions. In the fictional sample run on Corvane Industrial, 29 of the 31 values it filled came from mappings it had already learned at 0.97 confidence or more, and the adjusted EBITDA line carried a rule learned from 214 of the analyst's decisions. Two went to the associate instead: total revenue, which did not foot, and the redefined aftermarket line. Below 0.92 the Mapper asks; a changed definition always asks; and it never adds or removes a row in the analyst's model on its own.
Every override a person makes carries one of ten reason codes, such as "Wrong line mapped" or "Definition differs from the analyst's", and the agents learn from the code; a person approves what they learn, and a second administrator approves any change to the thresholds. That is how the map stays the analyst's: the machine remembers what people decided, and people decide anything new.
Five rules for a KPI map that survives a season
Rules for a field-to-source KPI map
- Store the definition with the number
The SEC expects a definition; keep the text you mapped against, with its page, and compare it next quarter.
- Map to the analyst's line names, not the company's labels
The model is the analyst's. A label change at the company should not rename the analyst's line, and should not slip through either.
- Ask on every changed label or definition
Confidence that a number was read correctly says nothing about whether its meaning is the same.
- Relate each KPI to something else reported
Book-to-bill to orders and revenue; backlog to the prior backlog plus orders less revenue, which never ties exactly (cancellations, currency, revenue that never enters backlog) but should not drift without a reason.
- Keep the presenter's rounding visible
A deck figure in billions is three significant figures. Mark it, and replace it when the filing gives the exact value.
Questions people ask
Are KPIs audited?
Generally not. Operating metrics in MD&A, releases and presentations sit outside the audited financial statements. The SEC's 2020 guidance instead reminds companies that disclosure controls and procedures apply to material metrics derived from their own information.
Is adjusted EBITDA a KPI or a non-GAAP measure?
A non-GAAP financial measure: it adjusts a GAAP figure, so Regulation G requires the most directly comparable GAAP measure and a reconciliation wherever the company discloses it publicly. Operating measures such as unit sales or subscribers are not non-GAAP measures.
Can KPIs be extracted from XBRL?
Rarely. XBRL tagging covers the financial statements and their notes plus a list of specific items; MD&A metrics, release tables and slide figures are not tagged, so KPI extraction means reading the documents.
How do you extract KPIs from earnings presentations?
Read each slide with its footnotes, record the page, the printed unit and rounding, and map the figure to the analyst's line with its definition. Replace a rounded deck figure with the exact value when the 10-Q or 10-K prints it, and keep the deck as the first source.
What is KPI extraction in Financial Data Extraction?
The same seven agents that update the financial statements: the Table Reader records each metric with its page and printed units, the Mapper maps it to the analyst's own line name and asks below the confidence threshold or on any changed definition, and Units and Periods converts scale and periods with the arithmetic on the cell.