Financial data extraction software reads company filings, earnings releases and presentations and turns the numbers in them into structured data: for a buy-side research team, the new quarter's revenue, segments, cash flow, KPIs and adjusted measures in each analyst's model. A team can get those numbers three ways. Associates can type them from the documents, a data vendor can supply them in its own standardized line items, or software can extract them from the documents into the analysts' own workbooks. The licence or data fee is often not the largest part of the total cost. The others are the hours spent on companies a vendor does not cover, on re-mapping a vendor's lines to the analyst's own, and on checking that the numbers foot and that history has not moved. Botminds' Financial Data Extraction is the third kind: seven agents read each filing for every covered issuer and write a new column into the analyst's own model with every number linked to its page, and people accept, check and publish.
This guide is for the COO, head of research data or procurement lead making that choice. Wages come from the US Bureau of Labor Statistics; hours are our estimates, stated with their method; the sample firm is fictional.
Three ways to fill a research model each quarter
| Associates by hand | Vendor standardized dataset | Agents in the analyst's workbook | |
|---|---|---|---|
| Coverage | Any company that publishes anything, in any language | The vendor's universe, strongest for large listed names | Any issuer the team covers and can give the agents sources for |
| Line names | The analyst's own | The vendor's standardized items | The analyst's own, learned from the workbook |
| Speed on results night | As fast as the associate types | When the vendor processes the filing | Within minutes of the filing, then a person's review |
| Adjusted measures and KPIs | As the analyst defines them | As the vendor defines them, where covered | As the analyst defines them, tied to the company's reconciliation |
| Trace to the page | Only if someone notes it | Varies by vendor | Every value, by design |
| Main hidden cost | Hours, errors and burnout in earnings season | Hand-keying the names it skips; re-mapping to the analyst's lines | Setup: connecting workbooks and reviewing the first mappings |
What is financial data extraction software?
It is software that takes financial documents as input and produces numbers with structure as output: the value, the line it belongs to, the period, the unit and the company. Products differ mainly in three choices. What they read: SEC XBRL only, PDFs, scans, local-language filings, decks. Where they write: their own database and template, or the customer's own models. And what they keep: just the number, or the page, the row, the conversion and the checks behind it.
The last choice decides most of the cost of ownership, because a number without its source has to be checked by reopening the document. In the sample firm used throughout this series, the analyst's question that starts most of that work is the one the solution's persona puts plainly: "If a PM asks where a number came from, I need the page in one click."
Where the hours go when associates update models by hand
About two hours per company per quarter, by our estimate, and less than half of it is typing. The rest is fetching documents, checking units and periods, handling recasts and relabels, and tracing numbers for portfolio managers. The split below is the estimate Financial Data Extraction's sample firm is built on; it is not a survey, and a team should replace it with its own timing of a few real updates.
Where an associate's two hours per company go, each quarter
By hand, about 2 hours
- Pulling the 10-Q, release and deck · 12.5%
- Typing values under the analyst's line names · 37.5%
- Footing segments, units and year to date · 25%
- Recasts and relabeled KPIs · 12.5%
- Tracing numbers back for a PM · 12.5%
Wages put a floor under that time. The BLS reports a median of $103,570 a year, or $49.79 an hour, for financial analysts in 2025, across 443,100 jobs, with growth of 7% projected from 2025 to 2035 (BLS Occupational Outlook Handbook, financial analysts). Research associates sit inside that occupation; there is no separate federal series for them. The median excludes benefits and overhead, so wage-only arithmetic understates the cost.
How much does financial data extraction cost? A worked season
Take a sample firm as it runs through the solution: Quillfield Capital, a fictional buy-side firm whose research team covers 1,186 issuers, 214 of them in no vendor dataset. At two hours per issuer per quarter, updating every model by hand takes about 2,372 hours a quarter, most of it in the few weeks of earnings season. At the BLS median wage that is about $118,100 of associate time per quarter, before benefits, overhead or any analyst's own time.
One quarter's model-update hours for 1,186 covered issuers, three ways
The middle bar is the one buyers miss. A vendor dataset removes typing for the companies it covers, but the 214 it does not cover are still typed by hand, and they are disproportionately the small caps, private and 144A issuers and local-language filers where a research team's coverage can matter most. The vendor-covered names still need mapping from the vendor's standardized lines to the analyst's own, checks against the release, and a decision whenever the vendor's definition of adjusted EBITDA differs from the analyst's. None of that is in the vendor's price.
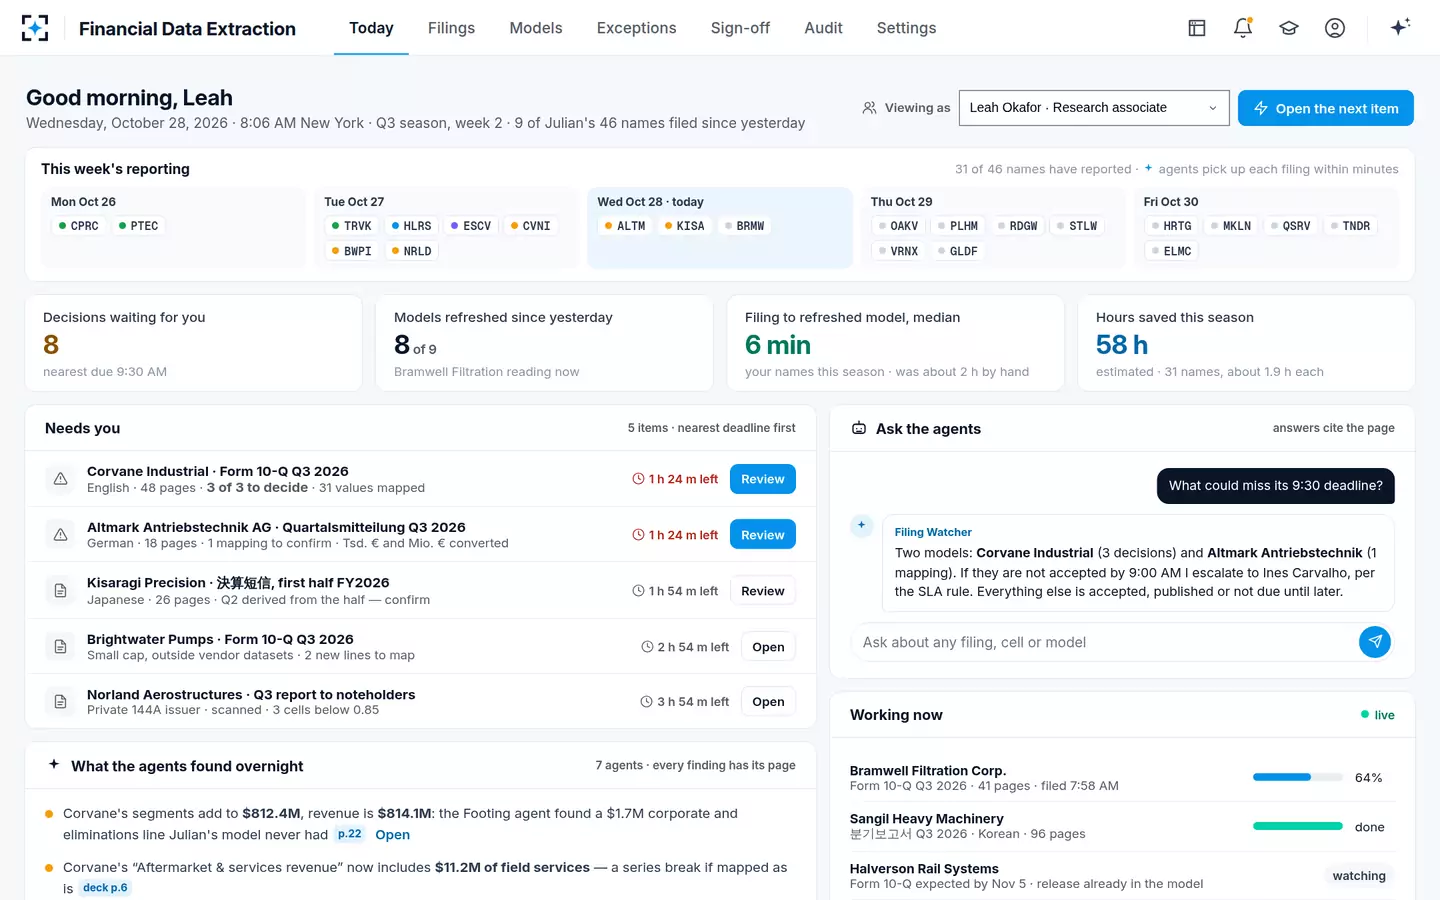
The bottom bar has its own costs: the licence, the setup, and the review time itself, which is real work. In the solution's sample season, the median time from a filing to a refreshed model was six minutes, and 96.8% of 41,286 values were accepted without an edit, which means about 1,300 were changed by a person. That review is the part of the job that should stay with people. The guide to the equity research associate's seat follows how it changes.
A research associate's morning in Financial Data Extraction
Is financial data from the SEC free?
Yes, and it should be part of any stack. The SEC's Financial Statement Data Sets and its data.sec.gov APIs are free, and the APIs need no account or key (SEC, EDGAR APIs). What is free is narrow, though. The bulk data sets update quarterly; the APIs carry only standard-taxonomy, entity-wide facts, so no company-specific lines and no segments; neither carries the earnings release, MD&A metrics or the deck; and the SEC itself disclaims any guarantee of their accuracy (SEC). The guide to the SEC financial statement data sets sets out what they hold field by field.
Free data also costs engineering time: a pipeline, monitoring, and someone who understands why a value changed when a filer switched tags. For a research team the right use is as a cross-check on the face statements of US filers and as history for screening, not as the source of the model.
Why do vendor datasets miss some companies?
Because standardizing a company's numbers is work, and vendors do it first where demand is largest. The SEC's own data show why the smaller names are harder. In fiscal 2025, an average 14.5% of a non-accelerated filer's financial-statement line tags were custom, against 8.9% for a large accelerated filer (SEC, XBRL custom tags trend, August 2026). A company that invents more of its own line items needs more human mapping before its numbers fit anyone's template, and companies that do not file with the SEC at all need someone to read them from scratch.
Standardization also changes the numbers. In the first large-scale comparison of its kind, Chychyla and Kogan compared 30 accounting line items for about 5,000 companies and found "that the values reported in Compustat significantly differ from the values reported in 10-K filings", with the alterations depending on "the type of the accounting item and company characteristics, such as industry and size" (Journal of Information Systems 29(1), 2015). A standardized figure is a vendor's judgement about how to make companies comparable. That is valuable for screening, and it is not the analyst's own definition.
Vendor standardized data and extraction into your own model, for the same quarter
Vendor standardized dataset: The vendor's definition, the same for every company: 173.8 for the sample company, excluding restructuring.
Agents in the analyst's own workbook: The analyst's definition, tied to the company's reconciliation on page 9: 177.0, restructuring added back.
Vendor standardized dataset: History restated in the vendor's view on the vendor's schedule.
Agents in the analyst's own workbook: Recast proposed cell by cell with the old values kept; a senior analyst checks.
Vendor standardized dataset: Not there; typed by hand.
Agents in the analyst's own workbook: Read like any other filer: a new $1,384K tariff surcharge line proposed into revenue with a memo row.
Vendor standardized dataset: The vendor's field and its documentation.
Agents in the analyst's own workbook: The filing, the page and the row, in one click.
Should we build or buy financial data extraction?
Build if extraction is a product you want to own; buy if it is a tool you need to use. A build has more parts than it first appears, and most of the cost is in the parts after reading.
What a build has to include, and who maintains it
| Component | What it involves | Ongoing work |
|---|---|---|
| Filing watch | EDGAR's free APIs for US filers; exchange feeds, IR sites, bondholder sites and data rooms for the rest | Every new source, every site redesign, the SEC's fair-access limits |
| Reading | Text-layer, scan and model-based extraction, in every language covered | Model upgrades, each re-tested on seeded errors |
| Mapping to analysts' names | One map per analyst, learned from decisions | Every relabel and definition change, every new analyst |
| Units, periods and footing | Scale, currency at the house rate, year to date, segment and statement footing | Each issuer's fiscal calendar and reporting pattern |
| History comparison | Every re-reported period against the published model | Recasts, restatements, IFRS 18 transitions |
| Write-back and workflow | Excel write-back with lineage; accept, check, publish; restricted-list check at publish | Workbook changes, entitlements, research system integration |
| Records | An audit trail per value and per version | Retention: five years under SEC Rule 204-2 for advisers' required records, longer if firm policy says so |
The build case is strongest for a quant team that needs a few standardized fields across thousands of companies and already runs data engineering. The buy case is strongest for a fundamental team whose value is in its own models, its own definitions and its coverage of names nobody else standardizes. The guide to AI financial modeling in the analyst's own model covers what buying should not cost: the models themselves.
What to ask a vendor before signing
Questions that expose the total cost of financial data extraction software
- How many of our covered issuers does it read today?
Count the names it cannot, and price the hours for them.
- Does it write into our models, or into its template?
A template means re-keying or re-mapping; your models are the asset.
- Whose definition of adjusted measures does it use?
The analyst's own, tied to the company's reconciliation, or the vendor's.
- Does every value link to its page?
Without it, every question from a PM costs a trip to the PDF.
- What happens when segments don't foot or history moves?
Plugging and overwriting are the two failures that reach published models.
- Who accepts, who checks, who publishes?
Maker-checker should be built in, with the restricted list checked at publish.
- Can we replay last quarter before go-live?
Against what the team typed, with planted errors, before anything is written.
- What does the audit trail export?
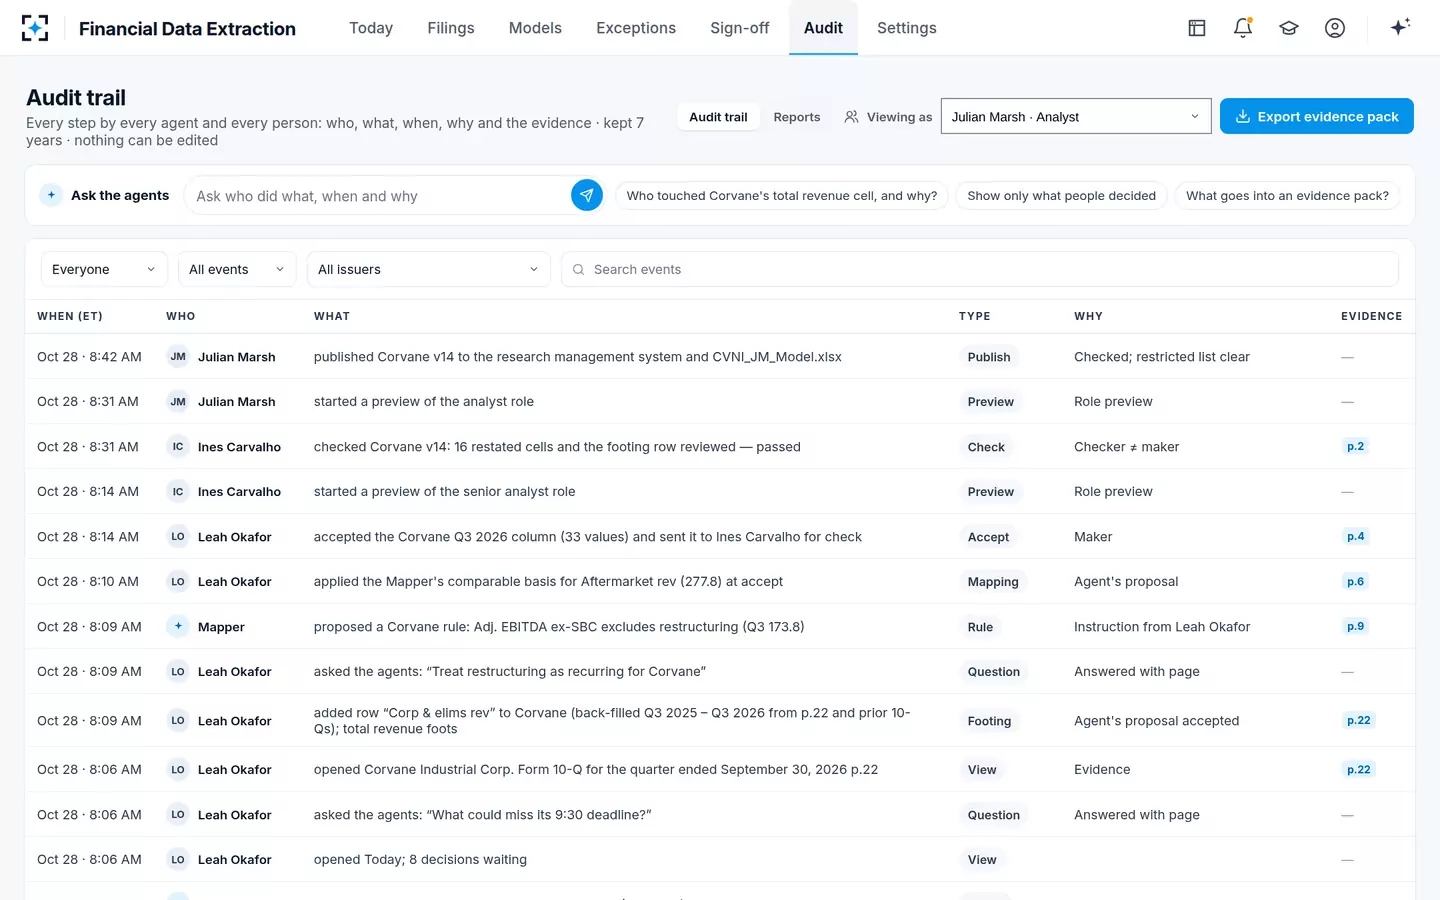
Per model version: lineage, pages, decisions, diff and agent versions.
The audit trail behind one published model version in Financial Data Extraction
Which teams Financial Data Extraction pays off for, and which it does not
It fits a fundamental research team that keeps its own models in Excel, covers names across markets and sizes, and needs each model refreshed the day a company reports with every number tied to its page. It reads SEC filings, local filings and IR material in their original languages, private and 144A packs including scans, and writes accepted columns into the analysts' own workbooks; a vendor dataset, where there is one, becomes a cross-check.
It is not a screening database of standardized fields for every listed company, and it does not replace one if that is what a quant team needs. It needs the analysts' workbooks and sources connected, and its first weeks are spent reviewing mappings. And it does not remove people: the agents propose and never accept, check or publish. Teams costing the analyst's side of earnings season, rather than the associate's, will find that arithmetic in what one covered name costs a quarter.
Questions people ask
How much does financial data extraction cost?
The licence is one part; the people's time can be larger. By our estimate a hand update takes about two hours per company per quarter, about $100 at the BLS 2025 median wage for financial analysts before benefits, and a vendor dataset still leaves the names it does not cover to be typed by hand.
How many hours do associates spend updating models?
There is no official statistic. Our working estimate for an industrials model is about two hours per company per quarter by hand, of which roughly 45 minutes is typing and the rest fetching, checking and tracing; time a few of your own updates before relying on any figure.
Is financial data extraction software the same as a data vendor?
No. A data vendor sells its own standardized dataset for the companies it covers. Extraction software reads documents you point it at; the better kind writes into your own models under your own definitions and keeps the page behind each number.
Can financial data extraction software handle private companies?
It can if it reads documents rather than relying on a public dataset. Financial Data Extraction reads bondholder reports and data-room packs, scans included, walled to the covering team; scanned values below 0.85 confidence go to a person.
Should a small research team buy extraction software?
The arithmetic scales with covered names and filings per season, not with team size. A team of three covering 120 names faces the same two hours per name per quarter; whether software pays depends on how many of those names a vendor already covers in the analysts' own definitions.