A PDF table extraction tool finds the tables in a PDF and turns them into rows and columns you can use in Excel or code. For financial statements, that is the easy half. The hard half is everything a spreadsheet cell loses: which page the number came from, which period the column covers, whether the table was "in thousands", whether brackets meant negative, and whether a smudged digit in a scan was read or guessed. A tool that delivers clean cells without that record leaves an analyst unable to defend a number when a portfolio manager asks. Botminds' Financial Data Extraction uses an agent called the Table Reader for this step. It reads every page and table of a 10-Q, an earnings release, an investor deck or a local-language filing, scans included, and records each value with its page, table, row, column and printed units; it never infers a number that is not printed, and scanned values read below 0.85 confidence go to a person with the crop.
This guide is for the research data lead or technical buyer choosing how to extract tables from financial PDFs. Its examples are fictional sample data from the solution; the research figures come from peer-reviewed and preprint benchmarks, labelled as such.
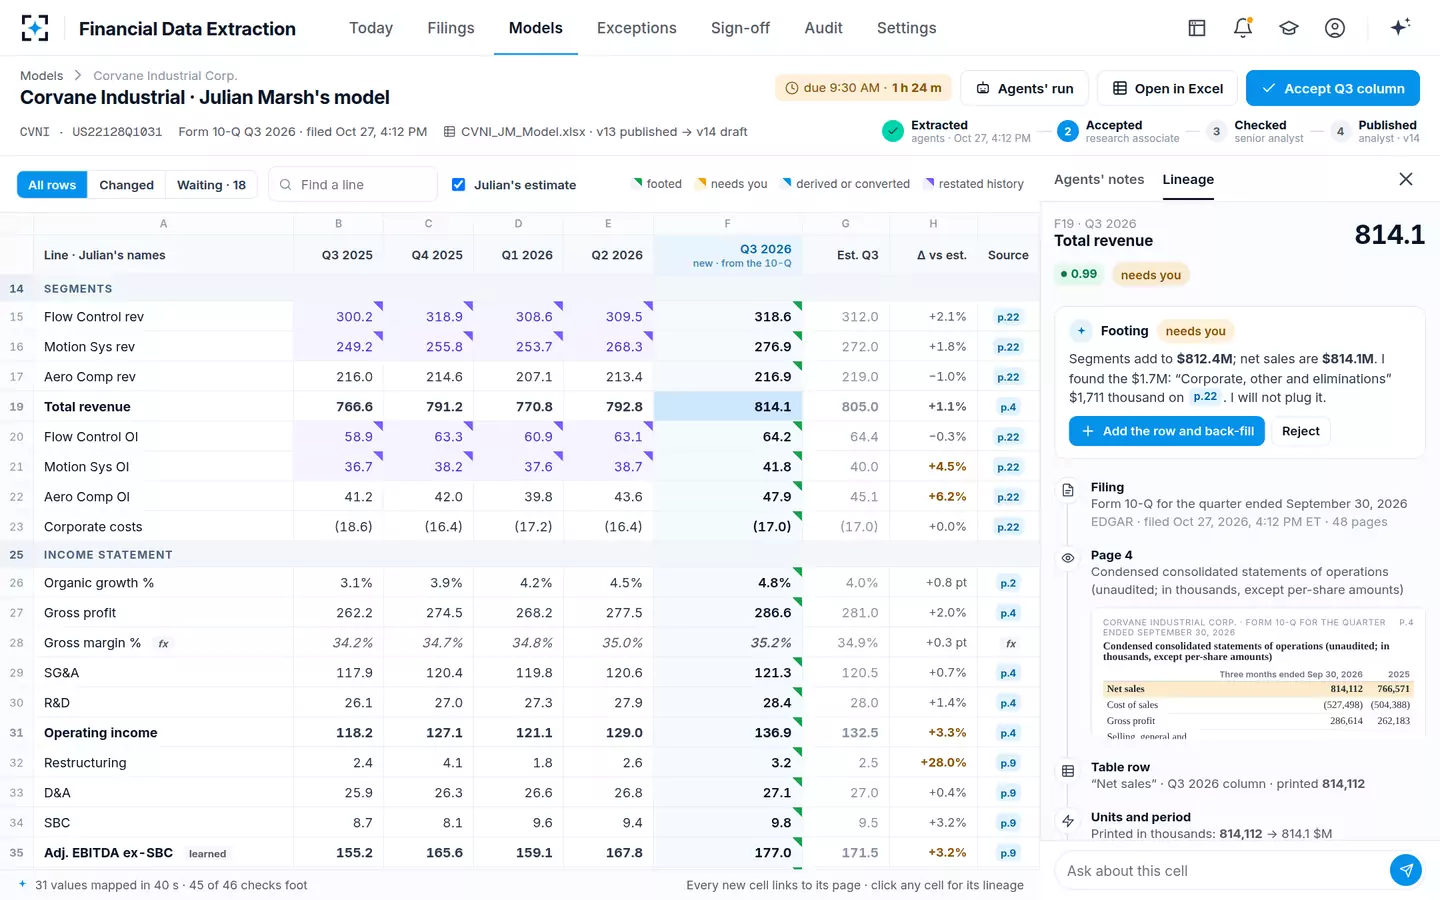
One value, fully recorded: what a table reader keeps for a single cell
- Document
- Form 10-Q for the quarter ended September 30, 2026, filed 4:12 PM
- Page
- 4 of 48
- Table
- Condensed consolidated statements of operations (unaudited; in thousands, except per-share amounts)
- Row
- Net sales
- Column
- Three months ended September 30, 2026
- Printed
- 814,112
- Units as printed
- US dollars in thousands
- Into the model
- 814.1 ($ millions), with the conversion shown
- Read confidence
- 0.99
- Checked against
- Three segments plus the corporate and eliminations line on page 22
What is the best PDF table extraction tool for financial statements?
The best one for financial statements is the one whose output you can check, not the one with the highest headline accuracy. A converter that is right on 99 cells in 100 and silent about which one is wrong forces someone to check all hundred. A reader that records where every value came from, marks the ones it is unsure of, and shows its arithmetic on anything it converted lets a person check five.
That shifts the buying question from "how accurate is it?" to four narrower ones. Does every extracted value carry its page, table, row, column and printed units? Does the tool distinguish a number it read from a number it inferred, and a blank cell from a zero? What does it do with a scan it cannot read? And can you test it on your own filings, with errors you planted, before you trust it? The last is a method in itself, set out in the guide to testing an LLM for data extraction with seeded errors.
How do you extract tables from a PDF?
There are three families of method, and most modern tools combine them. Text-layer extraction reads the characters and their positions that a digitally produced PDF already contains, and infers rows and columns from alignment; it is fast and exact on clean filings and fails on scans, which have no text layer. Optical character recognition turns page images into characters first, then does the same; it handles scans but adds misread digits. Model-based extraction, including large language models and vision models, reads the page more as a person does, which copes with irregular layouts and footnotes but can produce plausible numbers that are not on the page.
For financial statements the method matters less than what is kept. A 10-Q filed on EDGAR is an HTML document whose statements are tagged in Inline XBRL, so its numbers can be read exactly; the PDF copies people pass around are renderings of it. An earnings deck is usually a digital PDF with charts and footnotes. A private issuer's noteholder report may be a scan of a printed page. A reader that has to handle all three needs all three methods, and a record that says which one produced each value.
What a table reader must record for every value
At minimum, the location, the printed form and the period. Location is document, page, table, row label and column header. The printed form is the exact string, such as "(17.0)" or "412.386", plus the scale and currency the table declares. The period is what the column header says, three months or nine months, because the same row prints both. Without those, every later step is guesswork: the conversion to millions, the mapping to the analyst's line, the footing check and the answer to "where did this come from?"
Two further fields separate a research-grade reader from a converter. One is the confidence of the read, so that low-confidence values can be routed to a person. The other is a clear distinction between a value that is absent and a value that is zero. A recent benchmark of PDF-to-JSON extraction makes the same point in its method: its scoring treats quantities with tolerance, identifiers with exact match, and insists that "omission must be distinguished from hallucination" (ExtractBench, arXiv 2602.12247, February 2026, not peer reviewed).
Where table reading sits in Financial Data Extraction: agents propose, people decide
Agent
Filing WatcherPicks up the filing and links the release, the deck and the analyst's model.
Never: Never opens a private pack outside the covering team
Agent
Table ReaderRecords every value with page, table, row, column and printed units, in the original language.
Never: Never infers a number that is not printed
Agent
Units & PeriodsConverts scale and currency, derives quarters from year-to-date figures, shows the arithmetic.
Never: Never uses a rate other than the house rate
Agent
Mapper and FootingMaps each label to the analyst's line; adds every subtotal and finds the reconciling line.
Never: Never plugs a difference
A person decides
Research associateDecides what the agents could not settle, types any digit a scan hid, accepts the column.
A person decides
Senior analystChecks recasts and footing decisions before any version is shared.
Can AI read tables in financial statements?
It can find numbers in them well; it is less reliable at the reasoning around them, and published benchmarks say so consistently. TableQuest, built from the table-rich text of real financial reports, tested seven state-of-the-art models and found that "despite reasonable accuracy in locating facts, they often falter when required to execute more sophisticated reasoning or multi-step calculations" (Pan et al., arXiv 2412.09884, NeurIPS 2024 workshop). An earlier peer-reviewed benchmark, TAT-QA, drew its questions from real financial reports' tables and text; the best model of its day reached 58.0% F1 against 90.8% for expert humans (Zhu et al., ACL 2021). Those 2021 models predate today's, which is why the number matters less than the shape: locating a value is easier than combining values correctly.
Breadth is its own problem. ExtractBench paired 35 PDFs with JSON schemas and 12,867 evaluatable fields and found that frontier models "remain unreliable on realistic schemas", with performance falling as schemas widened, "culminating in 0% valid output on a 369-field financial reporting schema across all tested models" (ExtractBench, 2026, not peer reviewed). A whole-quarter extraction in one pass is exactly that kind of wide schema.
The design response is to keep the model's job narrow. The Table Reader reads and records; it does not add, convert or map. Arithmetic is done by Units and Periods and Footing, with the working shown; meaning is decided by the Mapper and, below threshold, by a person. FINRA's 2026 oversight report suggests the matching control to firms considering generative AI: validate model outputs and keep a person reviewing them, with regular checks for errors (FINRA, 2026 Annual Regulatory Oversight Report).
A table read back to its page: Financial Data Extraction's lineage for net sales
Can it read scanned financial statements?
Yes, with a rule for what it cannot read. Scans are where table extraction loses most: skew, low resolution, stamps and handwriting make digits ambiguous, and a model that is asked for a number tends to supply one. The safe rule is to separate reading from guessing. In Financial Data Extraction, a scanned value read below 0.85 confidence is not written; it goes to a person with the crop of the page, and the Footing agent re-checks whatever the person types against the rest of the document.
In the fictional sample, a private 144A issuer's noteholder report arrived as a 200 dpi scan, skewed on the page. The Table Reader read net revenue at 0.83, adjusted EBITDA at 0.61 because the last digit was unreadable, and capex at 0.82. All three went to the research associate with the crops, and the agent's note was blunt: "I never guess a digit: type what you see and the Footing agent re-checks it against the covenant table on p.9."
Eight table traps in a 10-Q, a deck and a German quarterly
Most extraction errors in financial tables are not misread characters. They are correct characters read in the wrong context. The eight below account for most of what an associate checks by hand.
Where financial tables mislead a reader, and what catches each
| Trap | What it looks like | What catches it |
|---|---|---|
| Scale in the header | "In thousands, except per-share amounts" printed once above the table | Recording the declared scale with every value, then converting with the arithmetic shown |
| Brackets and signs | (17.0) for a cost line; a positive cost elsewhere | Keeping the printed string. In XBRL, the SEC staff note most elements are entered as positive values, with negation done in the label |
| Two periods in one table | "Three months ended" and "Nine months ended" side by side | Reading the column header as the period, never the column position |
| Mixed units in one document | Thousands of euros on page 4, millions on page 9 | Tying the same line across pages after conversion |
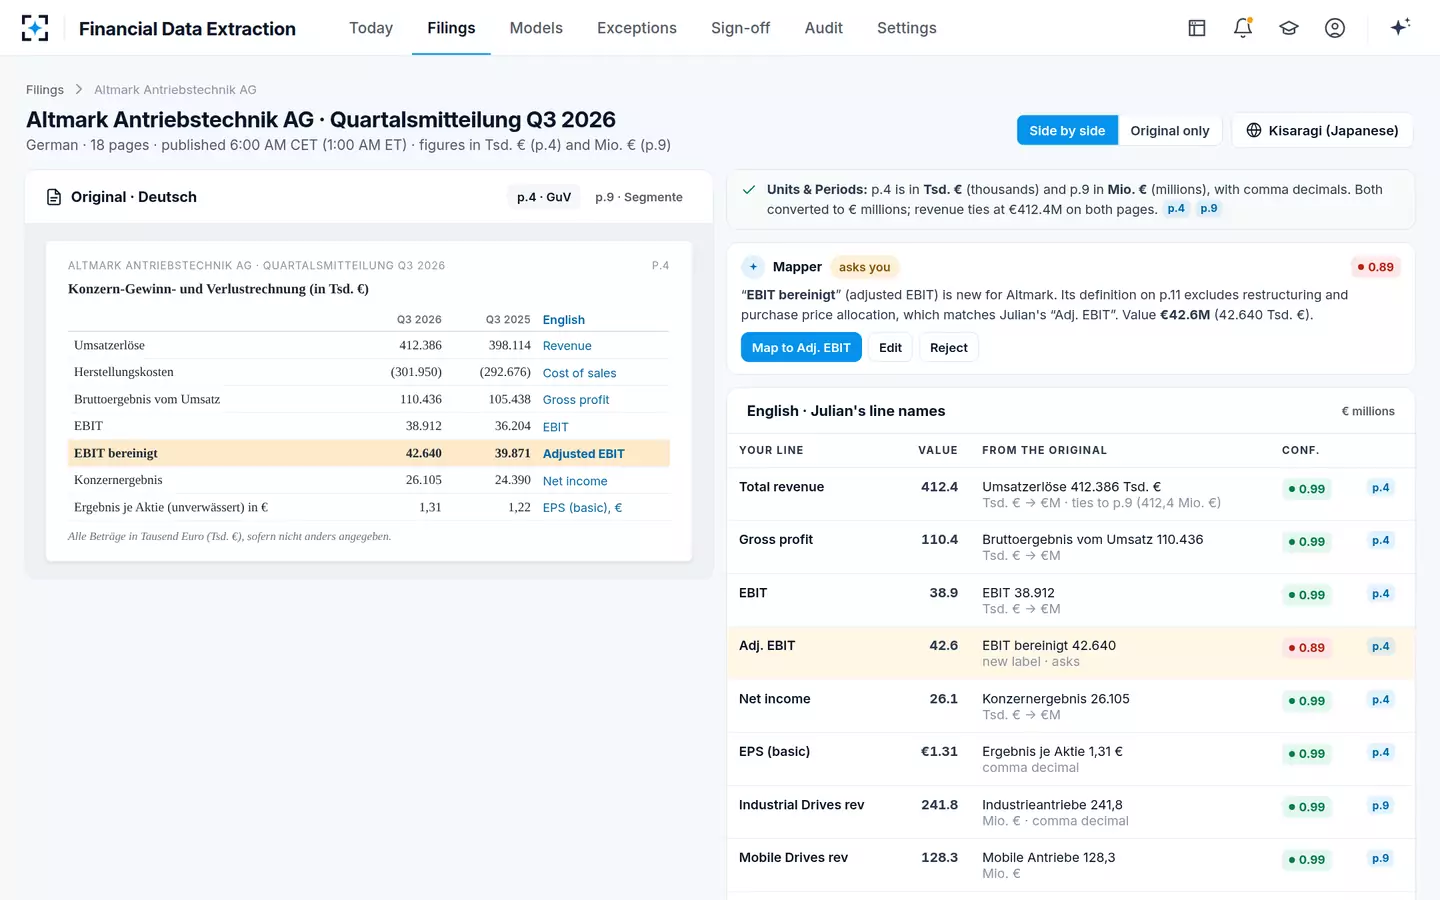
| Local number formats | 412.386 meaning four hundred twelve thousand; 1,31 meaning one point three one | Parsing by the document's language and locale, then footing |
| Footnoted definitions | A metric renamed on a slide, its new scope in footnote 2 | Reading footnotes as part of the table, and asking on any changed definition |
| Presenter rounding | "$2.31 billion" on a slide | Converting with the rounding marked, and replacing it when the filing gives the exact figure |
| Scans | A skewed 200 dpi page; a last digit lost in the fold | A confidence floor below which a person types the value from the crop |
Local formats deserve a word of their own, because they defeat tools that are excellent on English filings. In a German quarterly the same characters mean different numbers: a full stop groups thousands and a comma marks the decimal. Research on machine translation found that numerical mistranslation "is a general issue" across major commercial systems and research models (Wang et al., Findings of ACL 2021), which is why the agents read the original-language table rather than an English rendering of it. A Japanese company's English summary can also round what the original prints in full; in the solution's sample, the agents used ¥48,612 million from the Japanese original rather than the English summary's ¥48.6 billion.
A German table beside the analyst's English line names in Financial Data Extraction
From PDF to Excel, without losing the page
Most people who search for a PDF table extraction tool want the numbers in Excel. The common route, export the table to a sheet and copy the cells into the model, keeps the number and drops everything else; a month later nobody can say which page a cell came from. The alternative is to write into the workbook with the lineage attached: in Financial Data Extraction an Excel add-in writes each accepted value with a link and a note on the cell, so clicking it shows the filing, page, row, units, mapping and checks.
Writing into the analyst's own workbook also changes what "extraction" has to produce. It is not a new sheet in a vendor's layout but a new column under the analyst's own line names, beside the analyst's estimates, with the analyst's formulas left alone. The guide to AI financial modeling in the analyst's own model covers that half.
What to ask before you buy a PDF table extraction tool
Twelve questions for any PDF table extraction tool used on filings
- Does every value carry page, table, row, column and printed units?
If not, every later check depends on someone reopening the PDF.
- Does it tell a blank from a zero?
An omitted value and a hallucinated zero look the same in a spreadsheet.
- Is the printed string kept beside the parsed number?
It is the only way to audit scale, sign and locale after the fact.
- How does it read the column header?
Quarter and year-to-date columns sit side by side in every 10-Q.
- What happens below its confidence floor?
The right answer is a person and a crop, not a best guess.
- Does it read scans and local languages?
Ask for a demonstration on your own worst document, not the vendor's best.
- Are footnotes read with the table?
Definitions change in footnotes; a tool that skips them maps old meanings to new numbers.
- Can you plant errors and see what it catches?
A seeded test on your own filings beats any published accuracy figure.
- Where does the output go?
Into your model under your line names, or into a template someone must re-key.
- Does it convert units with the arithmetic shown?
Every derived or converted value should say how it was derived.
- Is there an audit trail per value?
Who changed it, when, why and from which page; research records are kept for years.
- Who can change its thresholds?
A confidence floor is a control; changing it should need a second person.
Buyers comparing whole platforms rather than a single step will find a wider set of questions in AI tools for equity research: 12 questions to ask before you buy, which covers restricted lists, sign-off and records as well as extraction.
Where Financial Data Extraction fits, and where it does not
It fits a research team that keeps its own models and needs each covered company's new quarter in them the day it reports, from the 10-Q, the release, the deck, local filings and private packs, with every value tied to its page and checked by a second person. In the solution's fictional sample, a 10-Q, a release and a deck, 84 pages and 63 tables in all, are read and 31 values mapped into the analyst's column in 40 seconds, and the associate then decides the two things the agents could not settle.
It does not replace every tool that extracts tables from PDFs. If you need one table out of one document once, a desktop converter is cheaper. If you need a standardized field across thousands of companies for screening, the SEC's structured data or a data vendor's dataset is the better source; the solution uses a vendor dataset, where one exists, only as a cross-check. And it is not a way to avoid checking: the agents propose and never accept, check or publish.
Questions people ask
How accurate is PDF table extraction?
It depends on the document and the task more than the tool. Benchmarks find models locate values reasonably well but falter on multi-step reasoning, and fail on very wide schemas extracted in one pass. Measure accuracy on your own filings with planted errors, and count the errors a tool flags as well as those it misses.
How do you extract tables from a PDF to Excel?
Extract the table with its page, row and column labels, convert units explicitly, then write the values into the workbook. For financial models, write into the existing model under its own line names, and keep a link from each cell to its page so the number can be traced later.
Can AI read tables in scanned financial statements?
It can read most of a clean scan, but low resolution and skew make some digits ambiguous. A safe tool sets a confidence floor and routes anything below it to a person with the crop; Financial Data Extraction's floor is 0.85 by default.
Is XBRL better than PDF extraction for SEC filings?
For the face statements of SEC filers, XBRL gives exact, tagged values. It does not cover the earnings release, investor decks, MD&A metrics or non-SEC issuers, and custom tags make some lines hard to compare. Most research teams need both.
What does a table reader do with numbers it cannot read?
A well-designed one says so. The Table Reader in Financial Data Extraction never infers a number that is not printed; it records its confidence, and scanned values below the floor go to a person, after which the Footing agent re-checks the typed value against the rest of the document.