ESG scores are calculated in four steps. A rater chooses which environmental, social and governance issues count for a company's industry; measures each issue with indicators, some taken from company reports and some estimated; combines the indicators into category scores and the categories into a total using weights; and places the total on a scale, either absolute or relative to industry peers. The published number hides those steps, which is why two raters can score the same company far apart. Taking a score apart shows which parts are the rater's judgment, scope, weights and scale, and which part is a claim about the company that can be checked: the measurement. Botminds' ESG Research does not add another score. Its agents read the company's own documents and set each vendor's view beside them with its date, so an analyst can see which measurement a score rests on and whether the company's pages bear it out.
The structure below comes from the most detailed published study of ESG rating methods and from the disclosure list in the EU's ESG Ratings Regulation. The worked example is illustrative arithmetic, and the screens show the solution's fictional sample firm, Quillfield Capital.
What sits underneath six raters' ESG scores
709
indicators across six raters, sorted by the researchers into 64 categories
38–282
indicators per rater: the scope of one score can be seven times another’s
10%
of one rater’s categories explained 75% of its overall rating
How are ESG scores calculated? The four steps
Every ESG score passes through the same four steps, whatever the rater calls them. Berg, Kölbel and Rigobon describe a rating as "scope", the set of attributes that describe a company's ESG performance; "measurement", the indicators that produce numerical values for each attribute; and "weights" that "determine how indicators are aggregated into a single ESG rating" (Review of Finance, 2022). A fourth step, the scale, turns the aggregate into a letter, a number or a risk band.
The four steps of an ESG score, and whose judgment each one is
| Step | What happens | Whose judgment | Can you check it against the company? |
|---|---|---|---|
| 1. Scope | The rater chooses which issues count for the company’s industry: emissions, water, labour practices, board, corruption… | The rater’s | No; you can only agree or disagree with it |
| 2. Measurement | Each issue is measured with indicators: reported figures, policy checks, controversy counts, estimates | Partly the rater’s, partly the company’s | Yes: each reported value should be on a page |
| 3. Weights | Indicators roll up into categories, categories into a total, often with industry-specific weights | The rater’s | No; the EU now requires them to be disclosed for aggregated ratings |
| 4. Scale | The total becomes a letter, a number or a risk band, absolute or relative to peers | The rater’s | No; you need the scale’s definition to read it |
What are the components of an ESG score?
Indicators, grouped into categories, grouped into the E, S and G pillars. The six raters in the study used between 38 and 282 indicators each, and had different hierarchies above them: four used three pillars, one used four and one seven, with one to three levels of sub-categories in between. The researchers had to build their own taxonomy of 64 categories just to compare them, creating a category wherever "at least two indicators from different rating agencies pertain to the same attribute".
Water shows what that means in practice. The study's example lists eleven indicators from six raters that all belong to "Water": discharge into water systems, water recycling, water use, water management, water stress, water stress management, water operations, water-related risks, water intensity, water management programmes and a single undivided "Water" score. Two raters scoring "water" may be measuring intensity in one case and the existence of a programme in the other.
Scope: which issues count, and which are left out
Scope is the rater's definition of ESG for an industry, and it varies more than most users expect. Only ten categories were covered by all six raters: biodiversity, employee development, energy, green products, health and safety, labour practices, product safety, remuneration, supply chain and water. Taxes, which the authors note "could be viewed as a fundamental concern", was among the gaps. Many indicators were unique to one rater.
Scope is a legitimate choice. It becomes a problem only when a user reads a score as covering an issue it does not. A company can score well on a rating whose scope leaves out deforestation, and the score says nothing about deforestation at all. The EU now requires providers to state each rating's scope, "whether it covers an individual E, S, or G factor or whether it is an aggregated rating", and "within the E, S or G factors, specification of the topics covered" (Regulation (EU) 2024/3005, Annex III).
Measurement: the part of the score you can check
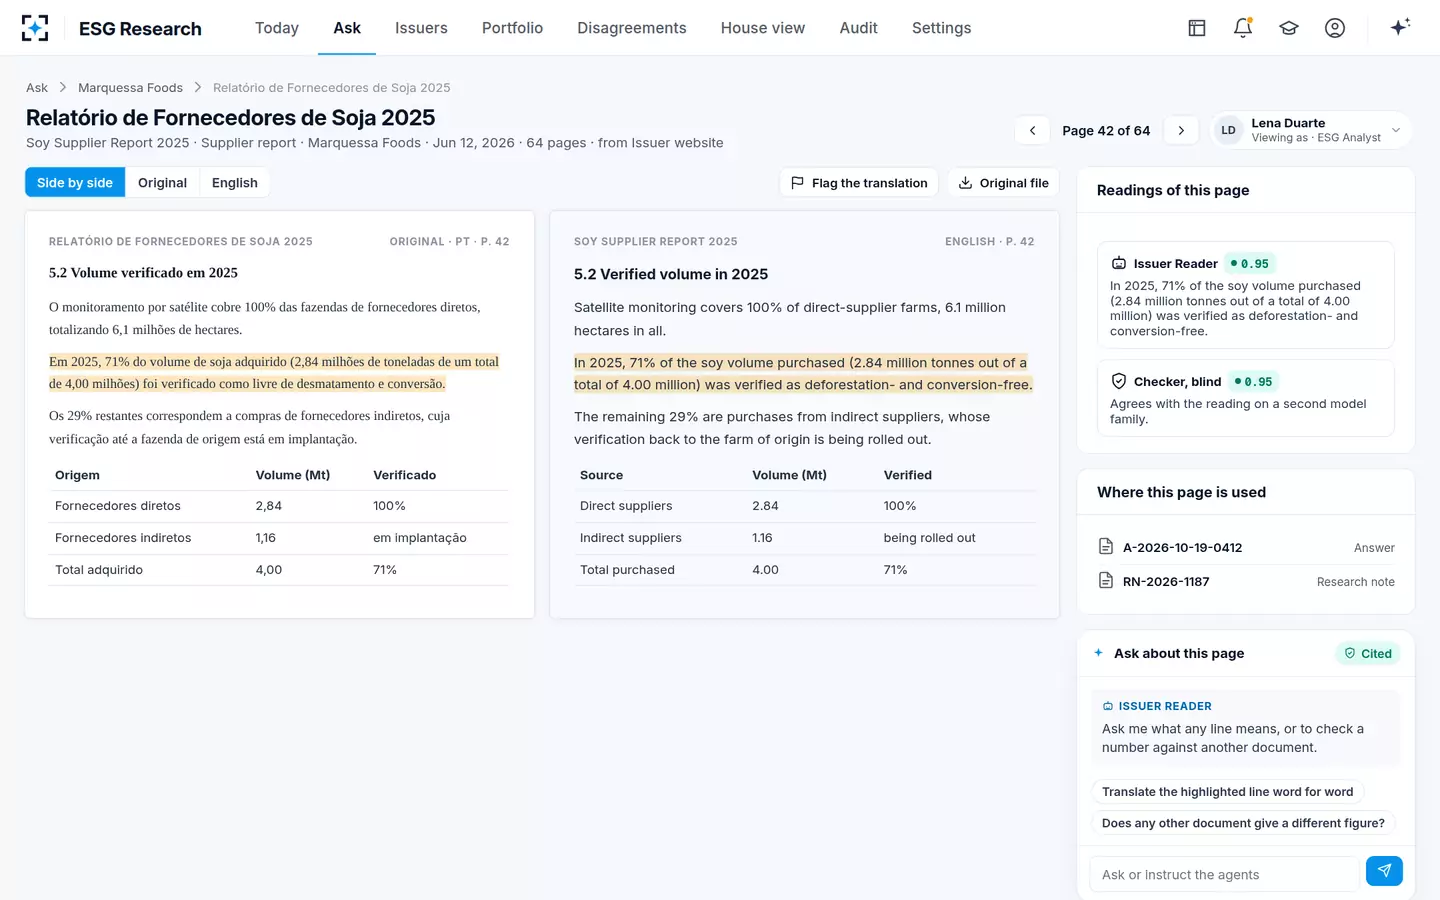
Measurement is where most disagreement comes from, and it is the only step that makes a claim about the company. The study gives the standard example: a company's labour practices "could be evaluated on the basis of workforce turnover or by the number of labor-related court cases taken against the firm". Both are measurements of labour practices; they can point in opposite directions.
Across all pairs of raters, measurement accounted for 56% of the divergence between their ratings, against 38% for scope and 6% for weights, and it was most consequential in climate risk management, product safety, corporate governance, corruption and environmental management systems. Why two raters score one company apart follows that finding further. For anyone checking a score, the lesson is practical: when a category score looks wrong, the question is which indicator produced it, and whether the company's own page supports the value.
A measurement checked at its source: the company's sentence and table, in the original and in English
Weight: how the parts add up, and why a few categories dominate
Weights turn many indicator values into one number, and they are usually set per industry: governance may weigh more for a bank, emissions more for a utility. The EU regulation asks providers of an aggregated rating to disclose "the weighting of the three overarching E, S and G categories of factors (for example 33 % for the E factor, 33 % for the S factor, 33 % for the G factor), and the explanation of the weighting method".
Weights matter less to divergence than people assume, contributing only 6% in the study, but they decide what a score is mostly about. In rater-by-rater regressions, a handful of categories explained most of some raters' totals; for one rater, the authors found, "10% of the categories explain 75% of the rating". A user who knows which categories dominate a score knows which pages to check first.
Missing data: what a blank does to a score
A missing value is never neutral; the method decides what it becomes. Some raters estimate missing inputs from models. Others penalise silence: the researchers learned from one rater that "Some raters make it impossible for firms to receive a good indicator score if they do not give an answer to the corresponding question in the questionnaire", regardless of actual performance. In both cases the score reflects the method as much as the company.
Disclosure rules now ask providers to say which they do. The EU's list requires "an overview of data processes, estimation of input data in case of unavailability and frequency of data updates". Japan's voluntary code asks endorsing providers, "if estimated data is used", to disclose "this fact and the basic methodology of estimation" (FSA, Code of Conduct, December 2022). For an analyst the rule of thumb is simple: before relying on a category score, find out whether the value behind it was reported, estimated or defaulted.
ESG score scale: absolute, relative, and what a "3" means
The same number can mean different things on different scales. Some scores are absolute, measuring exposure or performance against a fixed standard; others are relative, ranking a company against its industry peers, so a company's score can move when its peers change. The EU regulation requires providers to state "whether the rating is expressed in absolute or relative value" and "the industry classification used".
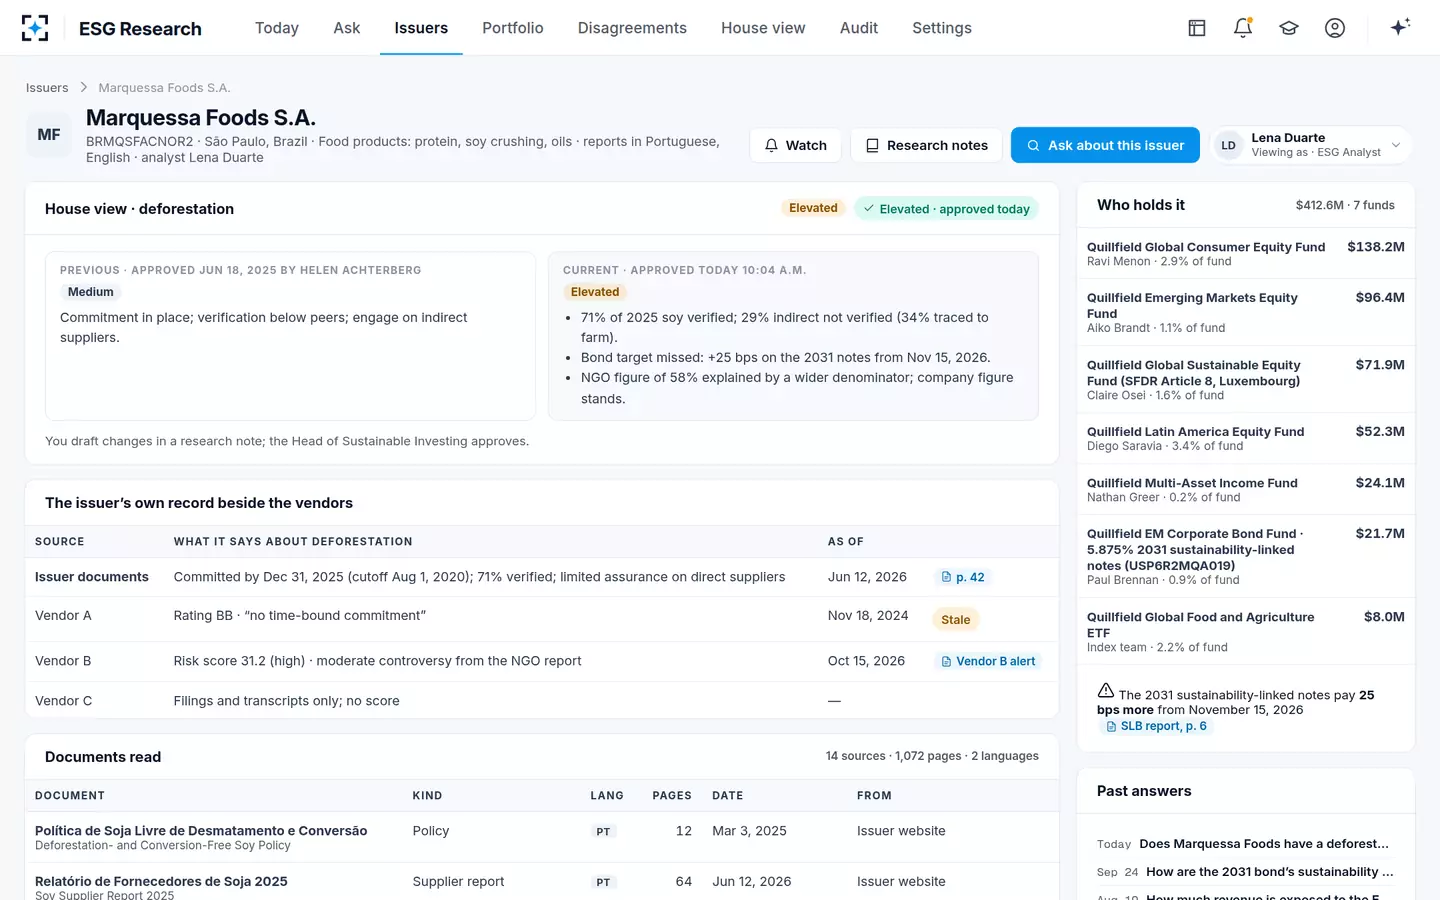
The FCA's anti-greenwashing guidance uses a scale as its example of a misleading claim. A benchmark claims to be sustainable by excluding companies with ESG ratings "lower than 3", but does not say what the rating assesses, "does not specify the scale the rating uses, which could be 1‑10", and does not explain why 3 is the threshold. "It could, in reality, not be a high bar" (FCA FG24/3, Example 6). The sample firm's issuer page shows the everyday version: one vendor rates a company "BB" and another gives it a risk score of 31.2, labelled high. Neither number can be compared with the other, or with the firm's own view, without its scale.
Two vendors, two scales, and the issuer's own pages beside them
Taking one ESG score apart: a worked example
Take an illustrative score for a food processor, built the way the steps above describe. The rater's scope for the industry is four categories. Each category score, on a 0 to 10 scale, comes from indicators; the weights are the rater's.
The rater's weights decide what the score is mostly about
Illustrative weights, food processor
- Supply chain and deforestation · 35%
- Governance · 30%
- Labour practices · 20%
- Water · 15%
One illustrative score of 5.40 out of 10, taken apart by category
Now check the measurement. Suppose the supply-chain category score of 4.0 rests on an indicator saying the company has no time-bound deforestation commitment. If the company published one after the rater's last review, as the sample company did, the indicator is stale. Re-scored at, say, 5.5, that category contributes 1.93 instead of 1.40 and the total rises to 5.93. Suppose instead a public register shows suppliers' farms under embargo that the rater has not seen; the category falls to 3.0 and the total to 5.05. The rater's scope and weights did not change in either case. Only the measurement did, and only the company's pages and the register could tell you which way.
That is why the solution never averages ratings and never treats a vendor score as a fact about the issuer. It finds the passages that bear on the categories that drive the score, and shows them beside it.
Why did our ESG score change?
A score changes for one of four reasons, and only one of them is about the company. The company's data changed: a new report, an incident, a fixed or newly found problem. The rater's method changed: new indicators, new weights, a new industry model. The peers changed, on a relative scale. Or an estimate was replaced by a reported figure, or the reverse.
The EU regulation requires providers to explain the second case to rated companies and users: "when an ESG rating has been upgraded or downgraded due to any material changes to rating methodologies, models, key rating assumptions or data sources (including estimates), the reasons for those changes and their implications for the given rating" (Regulation (EU) 2024/3005, Annex III, point 2). For an investor, the first question about any change is which of the four it was. ESG Research's Watch agent re-runs a saved question when new documents arrive and tells the owner when the answer changes, which separates a change in the company's own evidence from a change in a vendor's method.
How to check an ESG score against the company
Checking one ESG score against the company's own pages
- Read the scale definition
Absolute or relative, which peers, what the top and bottom mean. A number without its scale is not information.
- Find the categories that drive it
Ask the provider, or read the methodology summary the EU now requires. A few categories usually dominate.
- Date the inputs
For each driving category, when was the indicator last updated, and has the company published since?
- Separate reported, estimated and defaulted values
An estimate or a penalty for silence says more about the method than the company.
- Go to the page
For each reported value, find the company’s sentence or table, with its period, denominator and assurance scope.
- Check what the scope leaves out
If the decision is about deforestation, a score whose scope omits it is silent, not reassuring.
- Write the finding, not a new score
Record which measurements the company’s pages support, which they contradict, and why.
A firm that wants to publish its own score should read what the ESG ratings rules ask of in-house ratings first; a firm that wants to check the scores it buys can run the method above on its own issuers with ESG Research.
Questions people ask
What is an ESG score made of?
Indicators grouped into categories and pillars, combined with the rater's weights and placed on a scale. In one study, six raters used between 38 and 282 indicators each, 709 in all.
What is the difference between an ESG score and an ESG rating?
In EU law an "ESG score" is derived from data by a rule-based model "without any additional substantial analytical input from a rating analyst", while an "ESG opinion" involves an analyst; both count as ESG ratings under Regulation (EU) 2024/3005.
What is a good ESG score?
It depends on the scale and the scope. On a relative scale a good score means better than industry peers, not good in absolute terms; and a high score says nothing about issues outside the rater's scope.
How can I calculate an ESG score myself?
Choose the issues that matter for the industry, measure each with indicators from company reports, weight them, and define the scale. If you market the result in the EU, Annex III requires you to publish the method, data sources, estimation approach and weights.
Why do companies get different ESG scores from different raters?
Mainly measurement: raters use different indicators for the same issue. Berg, Kölbel and Rigobon attribute 56% of the divergence to measurement, 38% to scope and 6% to weights.
Can a company's ESG score change without the company changing?
Yes: through a change in the rater's method, a move in peers on a relative scale, or an estimate replaced by a reported figure. EU rules require providers to explain upgrades and downgrades caused by methodology changes.