Escrow automation should be measured on one outcome: whether each annual cycle mailed with the right figures and the right options, so that borrowers paid what they owed and no more. That breaks into four layers of KPIs: coverage (how many analyses were actually checked against their documents), accuracy (how many inputs disagreed with their source, by source and in both directions), correction (how many errors were fixed before mailing, and whether refunds and disbursements went out on time) and borrower outcome (calls per shortage notice, escrow complaints and remediation). Botminds’ Escrow Analysis Review automates the check between a cycle being generated and its print file closing, so it should be judged on those four layers, and so should any tool that claims to automate escrow.
This page is for the servicing executive who has to sign the business case. It sets out the KPIs with their formulas, the cost of escrow errors as regulators have priced them, and a return formula to fill in with your own numbers. The examples come from a fictional sample servicer, Wrenfield Home Loan Servicing, as its cycles run through the solution.
The statutory penalty is small; the remediation is not
$118
civil penalty per failure to send an escrow statement, as adjusted for 2025
$236,451
annual cap on those penalties, unless the failure was intentional
$73M
redress Nationstar agreed to pay 40,000+ borrowers in 2020, escrow failures among the allegations
$1.5M
the CFPB civil penalty in the same settlement
What should escrow automation be measured on?
Measure escrow automation on the cycle, not on the tool: what share of statements were checked, how many were wrong, how many were fixed before mailing and what happened after. Activity measures, such as analyses processed per hour or documents read, say the tool ran. They do not say the cycle went out right, and that is what borrowers, investors and examiners judge.
A KPI tree for an escrow cycle: four layers, each with its formula
| Layer | KPI | Formula | Sample December cycle |
|---|---|---|---|
| Coverage | Analyses checked against their documents | Analyses whose every projected item was matched to a bill, policy or payment ÷ analyses in the cycle | 4,812 of 4,812 (target 100%) |
| Coverage | Rules tested per analysis | Regulation X and investor rules tested ÷ rules in force, per analysis | 9 rules on every analysis |
| Accuracy | Input mismatch rate, by source | Items differing from their document ÷ items of that type | Insurance 142, tax year 88, tax amount 61, flood 37 |
| Accuracy | Direction of error | Exceptions that overstate ÷ exceptions that understate the payment | 263 over, 118 under |
| Correction | Exceptions decided before print | Exceptions approved, held or sent back ÷ exceptions found, at release | Release only at 100% |
| Correction | Surplus refunds owed and paid on time | Refunds of $50+ paid within 30 days ÷ refunds owed | 19 refunds, $6,870 |
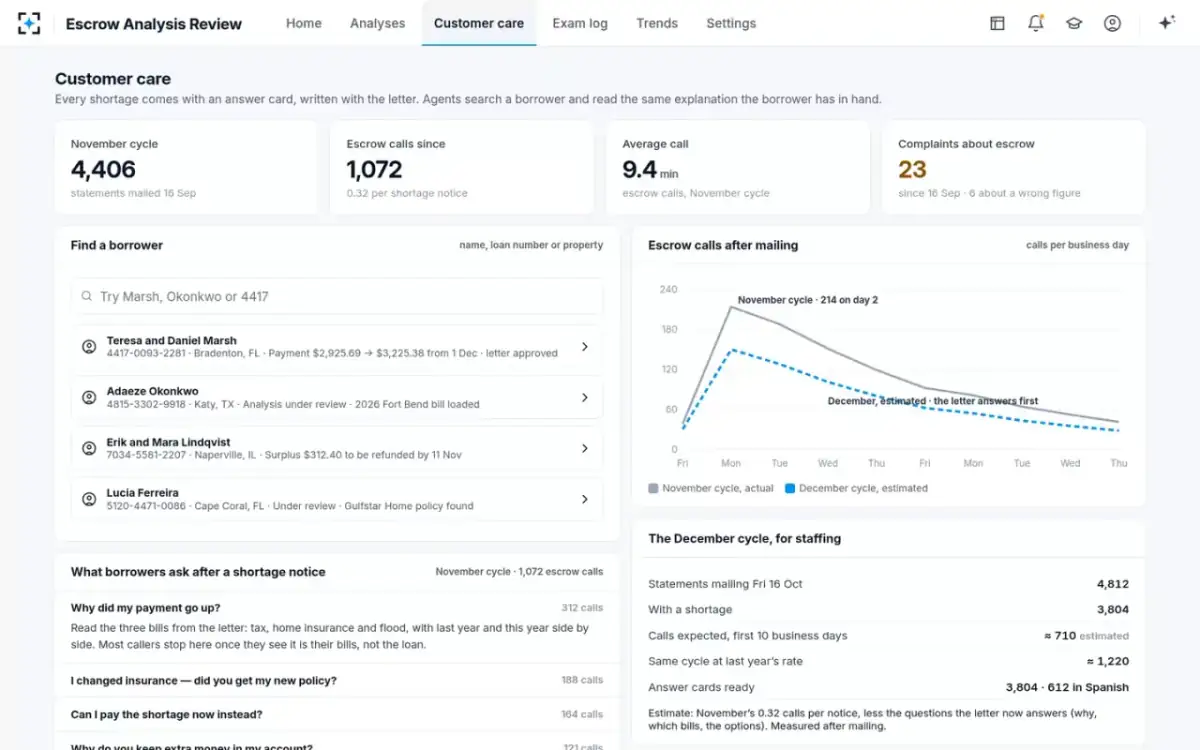
| Outcome | Calls per shortage notice | Escrow calls in the 10 business days after mailing ÷ shortage notices mailed | 0.32 in November |
| Outcome | Escrow complaints citing a wrong figure | Complaints traced to a wrong input ÷ statements mailed | 6 of 23 escrow complaints in November |
Coverage: how many statements were checked against their documents?
Coverage is the KPI most programmes cannot report honestly, because the usual check is a sample. An escrow team with a few days between the cycle running and the print file closing can open a few dozen statements by hand; the rest mail as generated. A cycle of 4,812 analyses with 50 opened has 1% coverage, whatever the quality of those 50.
Coverage should be defined strictly: an analysis counts as checked only when every projected disbursement was matched to its document, not when the analysis was opened. The distinction matters because the commonest errors, a declined renewal offer or last year’s tax bill, look normal on the screen. They are only visible beside the document.
Accuracy: input mismatch by source, in both directions
Accuracy should be reported by source and by direction, because each source has a different owner and each direction a different cost. A carrier feed that loads renewal offers as renewals is a vendor conversation; a county that certifies late is a calendar setting. In the sample cycle, one carrier feed accounted for 24 insurance mismatches overstating payments by $3,912 a month; that one line on a dashboard is worth more than a blended accuracy rate.
Direction matters because the two errors land at different times. Overstated payments produce calls and disputes within days of mailing. Understated payments produce nothing until the bill is paid, then a larger shortage at the next analysis. A programme that only tracks complaints sees the first and misses the second. The method behind these measures is in can an escrow analysis be wrong when the arithmetic is right.
How much do escrow errors cost?
Escrow errors cost far more in remediation and service than in penalties. The statutory penalty is for not sending a statement at all: $50 per failure in the statute, $118 after the 2025 inflation adjustment, capped at $236,451 a year unless the failure was intentional (12 U.S.C. 2609(d); 12 CFR 1083.1). A cycle of 4,812 statements never sent would reach the cap. A cycle sent with wrong figures does not trigger that penalty at all; it triggers everything else.
Everything else is larger. In the CFPB and state settlement with Nationstar, the allegations included that it “failed to timely disburse borrowers’ tax payments from their escrow accounts” and “failed to properly conduct escrow analyses for borrowers during their Chapter 13 bankruptcy proceedings”; the settlement called for about $73 million in redress to more than 40,000 borrowers and a $1.5 million penalty (CFPB, December 2020). In the CFPB’s 2017 lawsuit against Ocwen, which the CFPB described as allegations, the servicer had “allegedly failed to conduct escrow analyses and sent some borrowers’ escrow statements late or not at all” (CFPB, April 2017).
Service cost is the third line. The Mortgage Bankers Association’s servicing study put the fully loaded cost of servicing a performing loan at $176 in 2024, a figure that covers call centre, technology, escrow, cashiering, investor reporting and management; large servicers averaged $127 to $132 and mid-size servicers about $100 more (MBA, Servicing Operations Study). Escrow is a slice of a thin unit cost, which is why a mailing that doubles the escrow call volume shows up in the year’s numbers.
Borrower outcome: calls per shortage notice, and complaints
Calls per shortage notice is the best single outcome KPI, because it moves within days and responds to both accuracy and explanation. In the sample November cycle, 4,406 statements produced 1,072 escrow calls, 0.32 per shortage notice, averaging 9.4 minutes: about 168 hours of agent time on one mailing. The top questions were why the payment went up (312 calls), whether the servicer had the borrower’s new policy (188) and whether the shortage could be paid at once (164).
Calls expected in the first ten business days after the December mailing
Complaints are the slower signal, and the one examiners read. The Federal Reserve’s sound practices for escrow include reviewing complaints “for possible internal control weaknesses.” In the sample November cycle, 6 of 23 escrow complaints concerned a wrong figure; tracing each to the input that caused it closes the loop between the outcome layer and the accuracy layer.
Customer care’s view of a mailing: calls, minutes and the questions asked
Where the escrow team’s days go, by hand and with the check
The time an escrow team spends on a cycle goes mostly on fetching documents, not on judgement. By our estimate for one monthly cycle, pulling tax bills and confirming homeowners and flood premiums take about eight of thirteen review days by hand. The check takes most of that away and leaves the decision.
An escrow cycle’s review days, by hand and with the check
By hand · about 13 days
- Pulling tax bills and notices · 4 · 30.8%
- Confirming premiums · 4 · 30.8%
- Rerunning analyses · 2 · 15.4%
- Explanations · 2 · 15.4%
- Approval, release · 1 · 7.6%
With the check · about 3 days
- Bills · 0.5 · 16.7%
- Premiums · 0.5 · 16.7%
- Reruns · 0.5 · 16.7%
- Letters · 0.5 · 16.6%
- Approval, release · 1 · 33.3%
Building the business case: a return you can fill in
The return on escrow automation is a sum of avoided calls, avoided remediation and released analyst time, less the subscription and the oversight it needs. Each term below names who in the servicer can price it; none should be filled in from a vendor’s brochure.
The annual return on checking every escrow analysis before it mails
Calls avoided
(calls per notice before − after) × shortage notices a year × loaded cost per call
Measure the before rate on your last four cycles, and the after rate in the first ten business days of each mailing.
Customer care
Errors corrected before mailing
exceptions corrected a year × average cost to remediate one after mailing
Include refunds of overcollected escrow, reversed late fees, rework and reissued statements.
Escrow operations
Analyst days released
(review days by hand − with the check) × cycles a year × loaded daily cost
Count the days spent fetching documents, not the approval day.
Escrow manager
Subscription and set-up
annual price + one-time set-up spread over the contract
Finance
Oversight
hours on the human sample and on reviewing exceptions × loaded hourly cost
Keep a sample of 25 or more per cycle.
Compliance
Two cautions. First, the calls term depends as much on the letter as on the figures: a corrected shortage explained badly still rings the phone, which is why the solution drafts each explanation from the approved figures only. Second, the remediation term is lumpy. Most years it is small; the year a carrier feed loads offers as renewals across a whole state, it is not.
The first three cycles: baseline, side by side, then live
A business case is only as good as its baseline, and escrow has an unusually clean one: the cycles already mailed. Before anything goes live, run the check on a cycle that has mailed and compare its exceptions with the complaints, notices of error and corrections that cycle actually produced. That gives a measured exception rate by source and a list of errors that reached borrowers, which is the number the return depends on.
Three cycles to a measured return
| Cycle | What runs | What to measure |
|---|---|---|
| A cycle already mailed | The check, after the fact, on every analysis | Exceptions by source and direction; how many matched later complaints or corrections |
| The next cycle, side by side | The check and the existing hand sample, independently | Agreement between the two; exceptions the sample missed; analyst hours per cycle |
| The cycle after, live | The check before printing; analysts approve each correction | Coverage, corrections before print, calls per shortage notice in the ten business days after mailing |
Two numbers should be written down before the first live cycle: calls per shortage notice over the last four mailings, and escrow complaints citing a wrong figure over the last year. They are the before figures in the formula above, and they are the ones most often reconstructed from memory after the fact.
What to show an examiner, and a board
An examiner wants evidence that each rule was tested on each analysis and that people decided; a board wants the trend. Both can come from one log, kept as the work happens rather than assembled for the exam.
The exam log: every rule, every analysis, and the human sample beside it
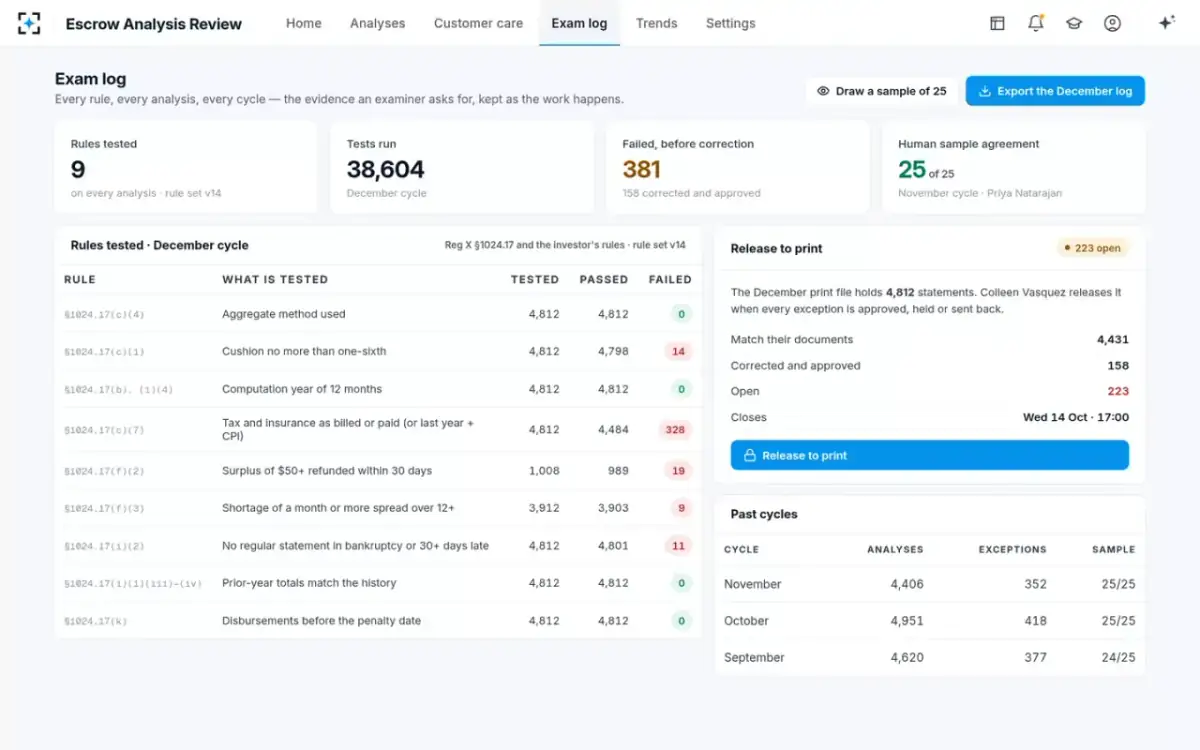
For a board, three lines tell the story: the share of analyses checked against documents, the exception rate by source over the last twelve cycles, and calls per shortage notice. For the comparison of approaches before you buy, see escrow analysis calculator, rules engine or document check; for the vendor questions, escrow analysis software and its second reader. The full solution is at Escrow Analysis Review.
Questions people ask
What is the RESPA escrow statement penalty?
For each failure to send a required initial or annual escrow statement, the civil penalty is $118 after the 2025 inflation adjustment, capped at $236,451 a year. If the failure was intentional, it is $236 per failure with no cap. The statute’s original figures were $50 and $100,000.
How many calls does an escrow shortage notice create?
No regulator publishes an industry rate. In one fictional sample cycle, 4,406 statements produced 1,072 escrow calls, 0.32 per shortage notice, peaking at 214 on the second business day. Measure your own over the ten business days after each mailing.
Do small servicers have to follow the escrow analysis rules?
Yes. The small-servicer exemptions in Regulation X cover sections 1024.38 to 1024.41, not the escrow account rules in 1024.17. A small servicer has one narrow escrow-related allowance: it may buy force-placed insurance where that costs the borrower less than paying the premium from escrow.
What is a good escrow exception rate?
There is no benchmark, and a low rate can mean a weak check. Track the rate by source and by direction over time; a rising rate in one source, such as one carrier feed or one county, is more useful than a single number. In a fictional sample cycle, 7.9% of analyses disagreed with their documents.
How do you measure whether escrow automation is accurate?
Have a person check a sample of analyses every cycle, independently, and compare conclusions with the automated check. Keep the sample size, the agreement and every disagreement, and review the disagreements before trusting the other KPIs.