The way to test a private equity waterfall model in Excel is to seed it: copy the workbook, plant one error you fear, run the checks your team normally runs, and note whether any of them caught it; then reset and plant the next. The errors worth planting are the conventions a spreadsheet hides in formulas, such as management fees left out of returnable capital, a simple accrual where the clause compounds the preferred return, a contribution dated late, a catch-up at the wrong percentage and a missed capital call. On one illustrative distribution, each of those moves between $1.0 million and $5.4 million to the general partner, and the most common review, tying the model's totals, catches none of them. Botminds' Distribution Waterfall Calculation re-runs every distribution independently from the limited partnership agreement and the capital accounts and compares it with the spreadsheet tier by tier, which is the one check in the test that catches all of them.
The test is cheap and it changes how a team reads its own model. The worked figures are illustrative arithmetic on an invented fund; the screens show the solution on sample data for a fictional manager, Quillfield Capital, whose funds and people are invented.
Six seeded errors against four checks: which ones each check can see
| Seeded error (GP gain on the test distribution) | Totals tie | Inputs tied to capital accounts | GP ≤ 20% of profit | Independent re-run from the LPA |
|---|---|---|---|---|
| Fees and expenses left out of returnable capital (+$5,372,594) | missed | caught if called capital is tied in total | caught | caught |
| A $5 million capital call left out (+$4,772,594) | missed | caught | caught | caught |
| Simple accrual where the clause compounds (+$3,772,594) | missed | missed | missed | caught |
| Preferred return at 7% instead of 8% (+$3,772,594) | missed | missed | missed | caught |
| A $20 million call dated a year late (+$2,015,539) | missed | caught only if dates are tied | missed | caught |
| Catch-up at 100% where the clause says 80% (+$1,045,482) | missed | missed | missed | caught |
Why a waterfall model in Excel needs a seeded-error test
A waterfall spreadsheet needs a seeded-error test because its usual reviews check the model against itself. Totals that sum, tiers that fill in order and LP amounts that tie to the fund are properties of any well-built workbook, right or wrong. The errors that move carry live in the conventions the formulas encode, and a review that does not re-derive the conventions from the agreement cannot see them.
Auditors look at the calculation once a year. In its 2023 private fund release the SEC described the practice: "during an annual period in which a private equity fund has sold a portfolio investment, the auditor typically reviews the fund's waterfall calculation including the calculations for return of invested capital, return of allocable expenses, the preferred return, the general partner catch-up, if applicable, and any incentive allocation, as part of the annual audit" (88 FR 63206; the rules adopted in that release were vacated in 2024). An annual audit after the money has moved is a backstop, not the check that stops an overpayment. The same examiners who read waterfalls have seen carry overcharged when the inputs were wrong: the SEC's 2020 risk alert reported carried interest overcharged because holdings were valued outside the advisers' own disclosed process (OCIE risk alert, June 23, 2020, staff observations).
A spreadsheet can be perfectly consistent with the wrong convention. Seeding is how you find out whether your review would notice.
How do you audit a waterfall model?
Audit a waterfall model in five steps: freeze a baseline, choose a test distribution that matters, plant one error at a time, run the checks you actually use, and score each check against each error. The discipline is in the second step. A test distribution that sails through the catch-up will hide half the errors, for a reason the next section shows.
A seeded-error test for a private equity waterfall model, step by step
- Freeze a baseline copy
Lock the workbook as used for the last distribution, and note the GP and LP totals it produced.
- Choose a test distribution inside the catch-up
One that pays some catch-up but does not complete it, plus one that reaches the split. Re-use a real past distribution where you can.
- Plant one error per copy
Change one cell or one input, as a careless or optimistic modeller might. Note the change in a separate key the reviewer does not see.
- Run the checks you really use
Totals, tie-out to the capital accounts, the 20% reasonableness test, a second person’s review, an independent re-run.
- Score and keep the matrix
Each error caught or missed by each check, and the dollar effect. Re-run the test whenever the model or the reviewer changes.
The reviewer should not know which error is in which copy, and at least one copy should contain no error at all. A review that flags the clean copy is telling you something too: a check that fires on correct models will be ignored by the time it fires on a wrong one.
The seeds worth planting, and what each moves
Plant the errors that occur in real models and move real money. The six in the matrix are conventions or inputs, not typos; each is the kind of choice a modeller makes once, at launch, and nobody revisits. Their effects on the test distribution range from $1.0 million to $5.4 million, against a correct GP share of $5.2 million.
What each seeded error hands the GP on one $105 million distribution
Two more seeds belong in any deal-by-deal model, though they need a deal-by-deal test fund to show a number: an unrealized write-down left out of the capital the LPs must recover first, and a realized loss on an earlier deal forgotten. In the sample manager's third quarter, write-downs left out of deal-by-deal waterfalls were the largest single cause of differences between the independent runs and the administrators' models, $1.39 million across two distributions. A seventh, for any model with fee offsets, is applying the offset after the waterfall instead of before it.
The catch-up trap: why some errors vanish from the test
Some errors disappear when the test distribution is large enough to complete the catch-up, because from then on the GP's total is pinned at 20% of cumulative profit whatever the preferred return was. An error in the preferred return then changes how the GP's share is labelled, not how large it is. Test only on a big distribution, and a model that compounds wrongly passes.
The same 'simple instead of compounded' error at six distribution sizes
The trap cuts both ways. A real distribution that lands inside the catch-up, as the sample's $48 million distribution did, is exactly where a convention error is worth most, and a model that has only ever been tested on fully caught-up results has never been tested where it matters. The sample shows the size of it: the fictional Fund III's $48 million distribution ended inside the catch-up, and a simple accrual in one cell moved $412,000 from the LPs to the GP.
Three tests worth building into any waterfall workbook
The matrix shows that tying totals catches nothing that matters, and that only an independent re-run catches everything. Between the two sit three tests any workbook can carry on its summary tab, each cheap to build and each aimed at a seed in the list.
The first is the profit identity. Once the catch-up is complete, the GP's cumulative carry must equal the carry rate times cumulative profit, everything distributed less everything called, using called capital straight from the capital accounts rather than from the model's own input column. It caught two of the six seeds in the matrix, because both overstated profit, and it costs one cell. Its blind spot is any distribution that ends inside the catch-up, where the GP is legitimately below the line.
The second is a catch-up target check: with a full catch-up at 20% carry, catch-up paid to date can never exceed a quarter of preferred return paid to date. A model whose catch-up tier is driven by a hard-coded percentage or by the wrong base fails it at once. The third is an independent preferred return schedule, one row per year or per cash flow, built in a separate sheet from the contribution dates and the clause's compounding words, and compared with the model's preferred return before each distribution. It is the only one of the three that catches a simple accrual where the clause compounds, and it is the closest a spreadsheet can come to the independent re-run without a second calculation.
None of the three replaces reading the agreement. Each encodes an assumption, a carry rate, a catch-up percentage or a compounding rule, and an assumption copied from the model rather than from the clause tests the model against itself again. Write the clause reference beside each test, and the test becomes a second reading of the agreement rather than a second copy of the spreadsheet.
Private equity waterfall Excel templates: what a template cannot know
A downloaded private equity waterfall Excel template, xls or xlsx, encodes somebody's agreement. It will have chosen whether fees are returned, how the preferred return compounds and from which date, whether the catch-up is full or partial, and whether the waterfall is whole-fund or deal-by-deal. None of those choices is visible on the summary tab, and each is a seed waiting to be planted by accident.
Before you trust a waterfall template, find these choices in its formulas
- What counts as contributed capital
All calls, or investment capital only. Look at which column feeds tier 1.
- The preferred return base and compounding
Does the accrual formula include unpaid preferred return in its base, and on which date does it compound?
- The start date of each accrual
Contribution date, call due date, or a quarter end.
- The day count
Days ÷ 365, days ÷ 360, or months ÷ 12.
- The catch-up percentage and target
Is the target a quarter of the preferred return paid (at 20% carry), or something else?
- The order of distributions applied in past periods
Capital first, then preferred return, as the tiers require.
- Where side letters enter
A different carry rate needs its own catch-up target, not a manual override on one LP’s line.
What the differences look like in practice
In the sample data the solution runs on, the fictional manager's third quarter of 2026 shows what an independent re-run turns up across a real-sized book: 76 distributions, $1.84 billion, every one run independently. Eleven differed from the administrators' models, moving $2.41 million of carry or preferred return before payment. The causes match the seed list closely.
Distribution Waterfall Calculation: one quarter's differences, by cause
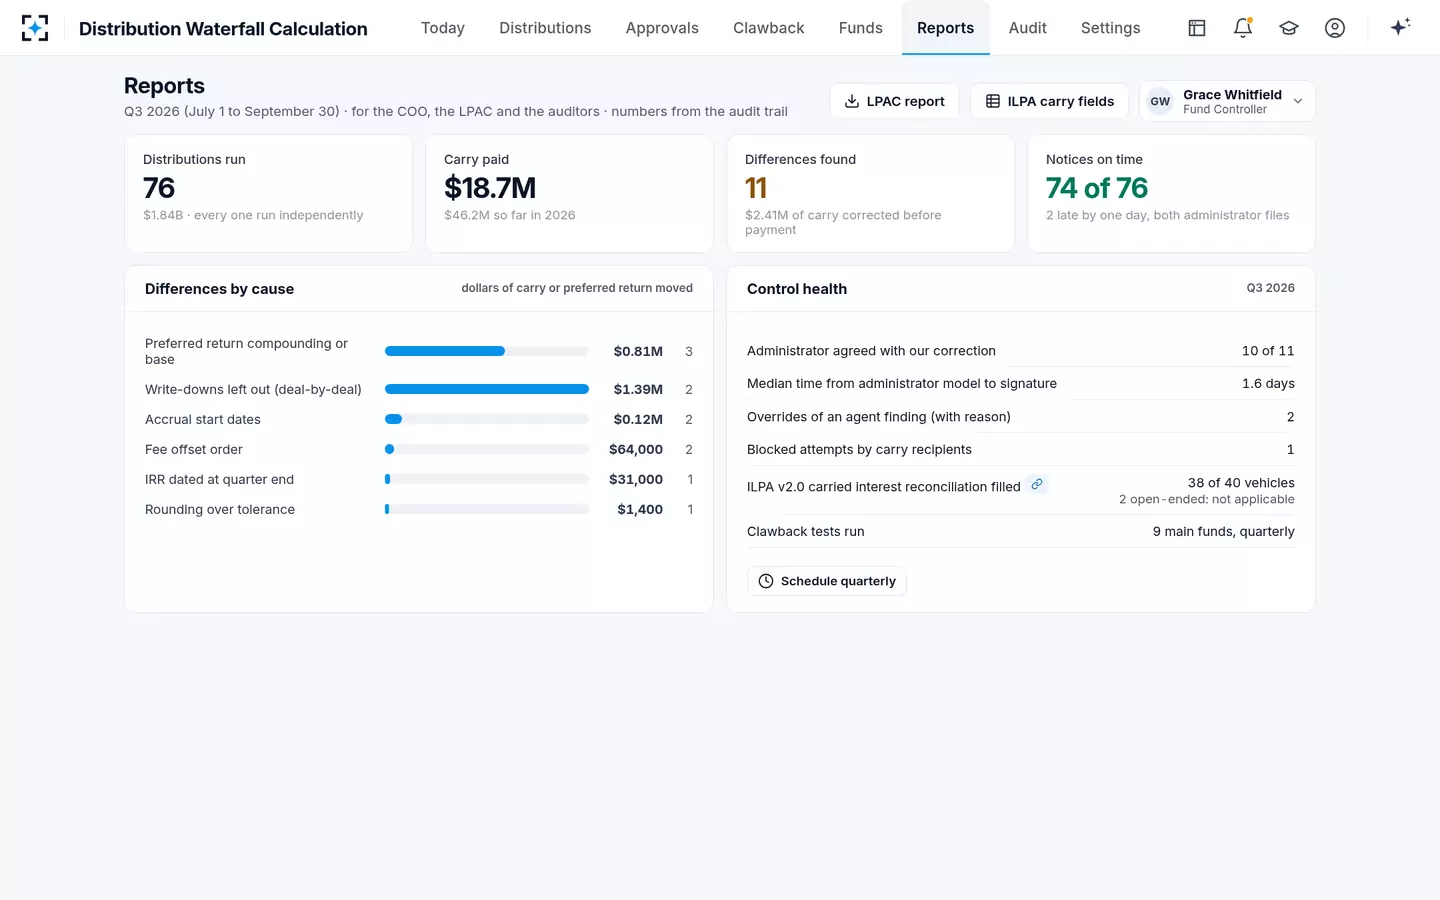
Two numbers on that screen matter for a model owner. The administrators agreed with ten of eleven corrections, which says the differences were real errors, not disputes about judgment. And overrides of an agent finding, two in the quarter, are kept with their reasons: a check is only useful if people can disagree with it, and only trustworthy if every disagreement is visible later.
How Distribution Waterfall Calculation re-runs a spreadsheet model
Distribution Waterfall Calculation turns the seeded-error test from a one-off into a standing check. The Model agent runs every distribution from the approved term table and the capital accounts, without reading the spreadsheet, so its result is the independent re-run in the matrix. The Diff agent then opens the spreadsheet, reads every formula, and compares the two tier by tier against a tolerance of $1,000 or 0.01% of the distribution, whichever is lower, in the sample manager's settings. Each difference arrives explained: the clause, the cell, the arithmetic and a drafted query.
Because the agent reads formulas rather than outputs, it can also look across. When it found the simple accrual in the fictional Fund III's model, it checked the same administrator's other models and found the same formula on the fund's Luxembourg parallel vehicle. The spreadsheet stays where it is; the team keeps using it, and the agents keep testing it. To see the re-run against your own workbooks, start from Distribution Waterfall Calculation; the arithmetic it re-performs is set out in a private equity waterfall calculation example.
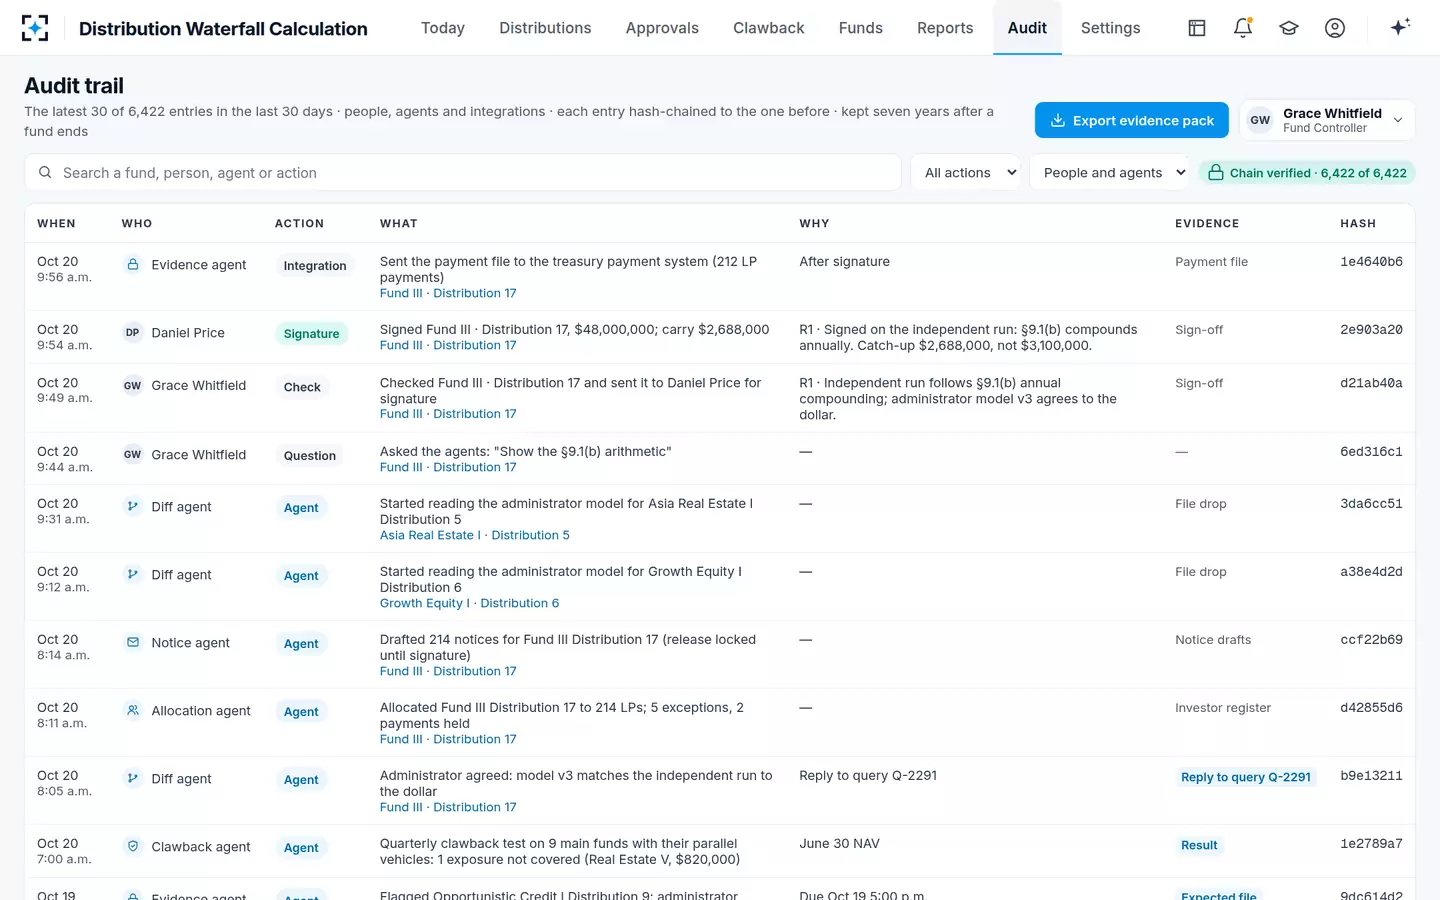
Every run, difference and decision, kept in order and chained
Questions people ask
Is Excel good enough for a private equity waterfall model?
For the arithmetic, yes. The risk is not Excel but untested conventions and a review that checks the model against itself. A model that has passed a seeded-error test, and is re-run independently for each distribution, is as good as the agreement it encodes.
How do you calculate carried interest in Excel?
Build the tiers in order on cumulative figures: unreturned capital from every call and return of capital; the preferred return accrued contribution by contribution; a catch-up target equal, at 20% carry with a full catch-up, to a quarter of the preferred return paid; and an 80/20 split of what remains. Then check that, once the catch-up is complete, the GP's carry equals 20% of everything distributed less everything called.
What does an auditor check in a waterfall calculation?
The SEC's description is that the auditor typically reviews return of invested capital, return of allocable expenses, the preferred return, the GP catch-up and any incentive allocation in a year in which the fund sold an investment. That is an annual look after the distributions were paid.
How often should a waterfall model be tested?
Seed-test it whenever the model, the reviewer or the agreement changes, and before the first distribution expected to pay carry. Re-run each distribution independently before payment; a seeded test shows the review works, the re-run shows this distribution is right.
Why did my waterfall model pass review but the GP was overpaid?
Usually because the review tied totals and inputs, which a model with the wrong convention passes, or because the review only ever saw distributions that completed the catch-up, where a preferred return error does not change the GP's total. Testing inside the catch-up exposes both.