Projections vs actuals is the test a credit memo applies before it trusts a borrower's forecast: put last year's projections beside this year's actual results, line by line, and explain every material gap before relying on next year's numbers. The comparison tells an approver how much the new projections are worth: a borrower that hit its plan has earned some trust in the next one, and one that missed it has not. Regulators have written this down for leveraged borrowers and for rating credit risk in general, and for Standard 7(a) loans the SBA requires projections with their assumptions when an application rests on them or when the latest year and interim do not show enough coverage. Botminds' Credit Memo Automation drafts each section of the memo in the bank's own template from the approved spread, the deal file and the last approved memo, every figure cited. This guide sets out the table itself and how to read it.
"Because leveraged borrowers start with high debt relative to cash flow, a bank should conduct an analysis of a leveraged borrower's past and current performance compared with projections, as well as the assumptions on which the projections are based."
OCC and FDIC, on rescinding the 2013 leveraged lending guidance, December 2025
The duty the leveraged lending rescission kept
When the OCC and FDIC rescinded the 2013 Interagency Guidance on Leveraged Lending and its 2014 FAQs on 5 December 2025, they replaced them with a short statement of principles. Two matter here. "Each bank should determine its own definition of a 'leveraged loan.'" And for those loans, the bank should compare past and current performance with projections and test the assumptions (OCC and FDIC, 2025). The Federal Reserve had not announced a rescission of its own version as of October 2026 (SR letters index), so state member banks should check which text applies to them.
The duty is older than the rescission and wider than leveraged loans. The OCC's Rating Credit Risk booklet tells examiners to "analyze how projections vary from historical performance and assess whether the borrower is likely to achieve them". It adds that "Borrowers that quickly or repeatedly fall short of their projections lack credibility", and that a conclusion that a borrower cannot perform at projected levels "should be factored into the loan's risk rating" (OCC). Projections that are not compared with outcomes are not analysis. They are the borrower's hopes, copied into the bank's file.
What the rules ask of projections in a credit memo
2years
of detailed projections a Standard 7(a) lender must analyse when the latest full year and interim do not show sufficient coverage
1.15×
coverage that projections for start-ups, new businesses and other projection-based Standard 7(a) applications must reach within two years of funding
4
scenarios the OCC names for projections: downside, break-even, best case, most likely
1
definition of a leveraged loan each bank now sets for itself
How do banks evaluate financial projections?
Against four things: the borrower's own history, the borrower's record of hitting past projections, the industry, and a downside the bank sets for itself. History comes first. In the Federal Reserve's study of risk rating at large banks, "Historical (and to a lesser extent, projected) earnings, operating cash flow, interest coverage, and leverage are typically analyzed" (Treacy and Carey, 1998). Projections earn weight only where history cannot answer the question, such as an expansion, an acquisition or a recovery.
Credit unions have the rule in regulation. A federally insured credit union's commercial loan policy must require "a borrower-prepared projection when historic performance does not support projected debt payments", supported by "reasonable rationale" and including "a projected balance sheet and income and expense statement" (12 CFR 723.4). Banks get a similar expectation from the OCC, which says more complex credits "normally should also require sensitivity analysis", from a base case to a break-even case, and "risk/reward analysis" (Rating Credit Risk). The projections-against-actuals table is how the second of the four tests, the borrower's record, gets into the memo.
Does the SBA require projections for a 7(a) loan?
Yes, in two cases, and the rule differs by loan program. For Standard 7(a) loans above $350,000, SOP 50 10 8.1 requires detailed projections with supporting assumptions for "start-ups, new businesses, and other applications based on projections", showing coverage of at least 1.15 "within 2 years from loan funding". For an existing business whose most recent full year and interim do not show sufficient coverage, the lender "must obtain from the Applicant and analyze 2 years of detailed projections including the supporting assumptions justifying relying on projections instead of historical performance" (SOP 50 10 8.1).
SBA projection rules under SOP 50 10 8.1, by loan type
| Loan type | When projections are needed | What they must show |
|---|---|---|
| Standard 7(a), above $350,000 | Start-ups, new businesses and other applications based on projections | Coverage of at least 1.15 within 2 years of funding (2 years from the end of construction for construction projects) |
| Standard 7(a), existing business | Latest full year and interim do not show sufficient coverage | 2 years of detailed projections, with assumptions that justify relying on them |
| 7(a) Small | Lender chooses projections instead of the last year-end plus interim | 12-month projections showing coverage of at least 1.10 within one year of funding |
| 7(a) MARC | Latest full year and interim below 1.15 | Two years of projections showing at least 1.15 within one year of disbursement |
Whatever the program, the SBA asks for the same evidence behind the numbers: "Justification for revenue growth, i.e., new product lines, sales channels, and new production facilities", "Justification for any reduction in expenses" and "A comparison to current industry trends". A lender that renews an SBA credit already holds last year's projections in its own file, which makes the comparison below the cheapest analysis in the memo.
What a projections-against-actuals table holds
The table has one row per line of the projection that the credit relies on, and four columns: what was projected, what happened, the variance, and the explanation with its source. Revenue and EBITDA are obvious rows. The rows that catch most problems are the uses of cash: capital expenditure, distributions and debt service. A borrower can hit its coverage by spending less on its future.
The example below is illustrative, a generic manufacturer with round numbers, not sample data from the solution. It shows what happens when the comparison is done properly.
Last year's projection against this year's actual, one illustrative borrower
| Line | Projected in last year's memo | Actual | Variance | Explanation to find |
|---|---|---|---|---|
| Revenue | $48.0M | $45.1M | −6% | Which customers or products fell short, from the sales report |
| EBITDA | $5.6M | $4.7M | −16% | Margin as well as volume: price, material cost, labour |
| Capital expenditure | $1.2M | $0.6M | −50% | Deferred or cancelled, and what that defers into next year |
| Distributions | $0.9M | $0.9M | 0% | Paid as planned despite the shortfall |
| Cash available for debt service | $3.5M | $3.2M | −9% | Arithmetic of the rows above |
| Debt service coverage | 1.46x | 1.33x | −9% | Still above a 1.25x minimum, but see capex |
| Debt to EBITDA | 2.14x | 2.55x | +0.41x | Same $12.0M of debt over lower EBITDA |
How to do a forecast vs actual variance analysis: the capex line that hides the miss
Read the table bottom up and the borrower looks fine: coverage of 1.33x against a 1.25x minimum. Read it top down and the story changes. EBITDA missed by 16%, and coverage held up only because capital spending was cut in half. Had the borrower spent the $1.2M it planned, cash available for debt service would have been $2.6M and coverage about 1.08x, below the minimum (our arithmetic).
Examiners know the pattern. The Rating Credit Risk booklet warns that "A troubled borrower will often cut capital expenditures in order to generate cash for debt service", and that such cuts "can imperil a business's future" (OCC). The memo should say plainly that coverage was met by deferral. The approver should know whether next year's projection assumes the deferred spending comes back.
How far each line missed its projection (illustrative)
Testing next year's projections against this year's miss
Once the miss is explained, the new projections should be tested against it. Three questions do most of the work. Does the new plan start from the actual base or from last year's projected one? Are the assumptions that failed last year still in the plan? Does the downside case cover at least what actually happened? The OCC wants projections "analyzed under multiple scenarios — downside, break-even, best case, most likely case — and stress-tested periodically". The 2026 lending booklet tells examiners to "consider the reasonableness of assumptions and projections" (OCC, 2026).
A projection section that passes, and one that only repeats the plan
Repeats the plan: Next year's revenue of $50.0M, from management.
Tests the plan: Next year's $50.0M is 11% above this year's actual $45.1M; last year's plan assumed 7% growth and delivered a 6% decline.
Repeats the plan: Growth from new customers.
Tests the plan: Two named customers, their contracts and start dates; the SBA asks for justification by product, channel or facility.
Repeats the plan: Capex of $1.0M.
Tests the plan: Capex of $1.0M plus $0.6M deferred from this year; coverage shown with and without the deferral.
Repeats the plan: EBITDA −10% case at 1.21x.
Tests the plan: Downside set no better than this year's actual miss of 16%; coverage and covenant cushion shown at that level.
Repeats the plan: Not mentioned.
Tests the plan: Second consecutive miss; reflected in the management factor of the grade.
Industry comparison belongs here too: a plan that assumes 11% growth in a market growing at 2% needs named customers or new capacity to explain the difference. The interagency workout statement asks for "realistic projections of the borrower's cash flow" (2023 policy statement). A projection is a claim, and the memo should show the evidence for it.
Where the table sits in Credit Memo Automation
The table needs three inputs the solution already reads: the last approved memo, which holds last year's projections, the approved spread, which holds this year's actuals, and the documents behind each variance. The memo template and its sections are a setting, and the memo writer drafts each section from the spread, the file and the prior memo with every number cited. A bank that adds a projections-against-actuals section to its template therefore gets it drafted from those sources, and reviewed and accepted by the analyst like any other.
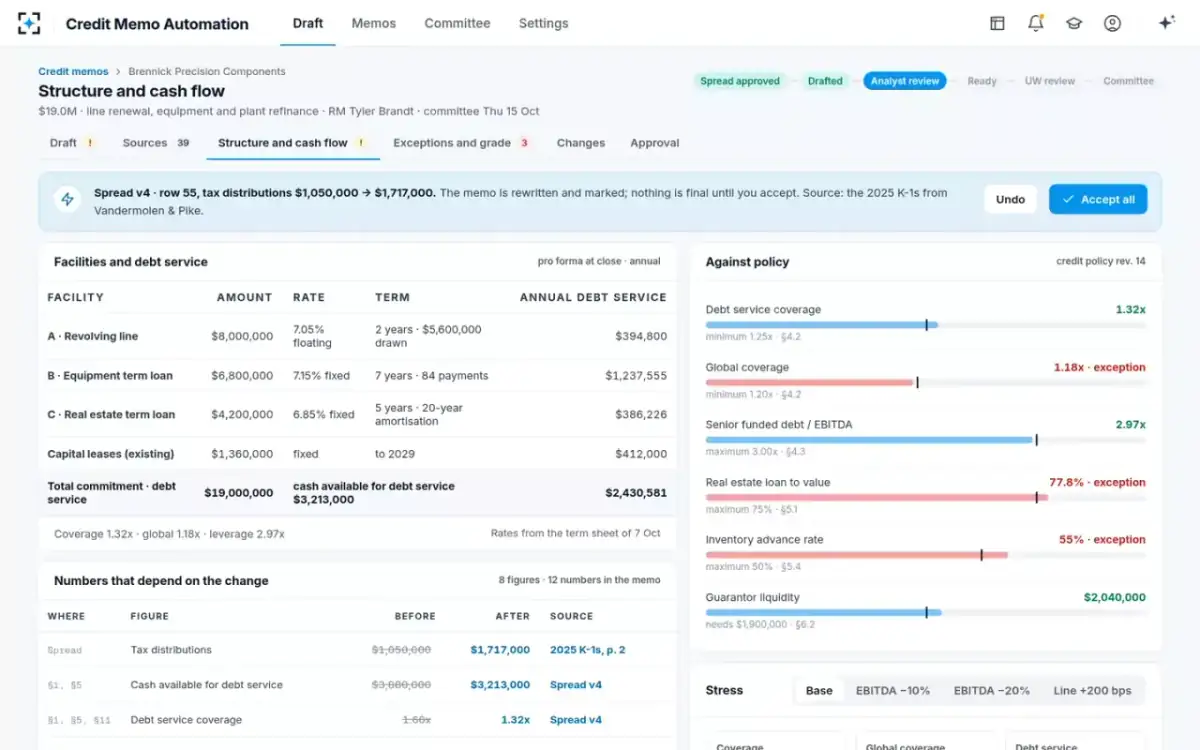
The stress cases are already built in. Take the sample credit as it runs through the solution: Brennick Precision Components, a fictional machining shop, borrowing $19,000,000 from the fictional Halvern Bank & Trust. The example bank's settings run EBITDA −10% and −20% and a rate shock of +200 basis points on every memo. Its draft shows coverage under each beside the policy minimums. When the owners' tax distributions rose late in committee week, the EBITDA −20% case fell from 1.10x to 0.82x and the memo was rewritten to say so.
Structure, cushions and pricing as drafted
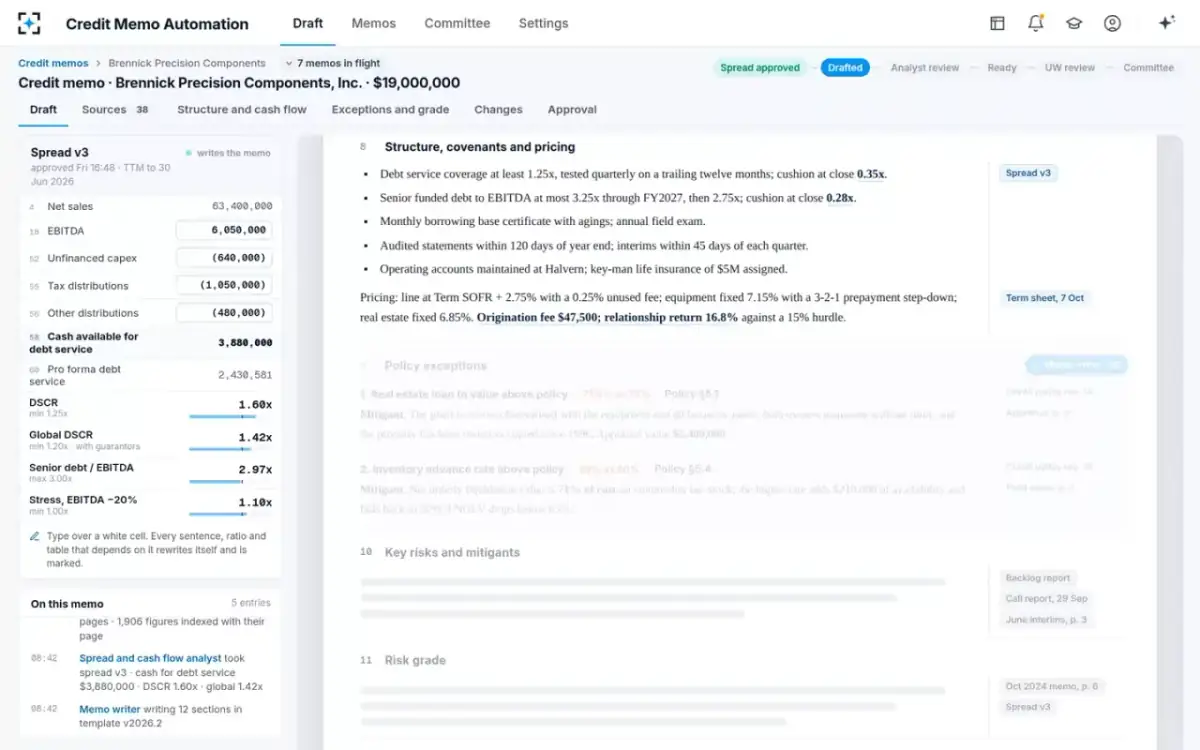
The sample deal also shows where a projection enters a memo without being called one. The equipment loan funds four machining centres and an automation cell arriving between January and March 2027, to bring in-house work that is "already contracted and now outsourced", at $2.1M a year. The memo lists executing the new cell as a key risk, and the mitigant limits advances to delivered machines. Next year's memo should test that saving against what the cell actually delivered, which is the same comparison this guide describes.
Every limit as a bar in Credit Memo Automation, with the stress cases
A checklist for projections in any credit memo
Projections against actuals: what to put in the memo
- Retrieve last year's projection from the approved memo
Not from the borrower's latest deck; the bank's own record of what was relied on.
- Compare line by line, including the uses of cash
Capex, distributions and debt service, not only revenue and EBITDA.
- Explain every material variance with a source
A sales report, a lost-customer letter, a cost schedule: the explanation needs a page.
- Recompute coverage with deferred spending restored
Coverage met by cutting capex is a warning, not a pass.
- Start next year from the actual base
And name each assumption that changed and why.
- Set the downside no better than the last miss
Show coverage and covenant cushions at that level.
- Carry the track record into the grade
Repeated misses "lack credibility", and the rating should reflect it.
The projection table belongs in every renewal memo, which is why it is listed in the renewal and modification checklist. For the memo's other sections, see how to write a commercial credit memo. The sample memo is on the Credit Memo Automation page.
Questions people ask
How do you calculate a projection variance?
Subtract the projection from the actual and divide by the projection: revenue projected at $48.0M against an actual $45.1M is a 6% shortfall. For ratios, show the change in points or turns as well, because a percentage of a ratio (coverage down 9%) hides how close the new figure sits to a covenant.
What variance is material enough to explain?
No rule sets a threshold; banks set their own, often by line. A practical test is whether the variance, had it been known at approval, would have changed coverage against a covenant or a policy minimum. Uses of cash such as capital spending deserve a lower threshold than revenue, because cutting them flatters coverage.
Should the bank use management's projections or its own?
Both. Management's case is the starting point and the claim to test; the bank's own downside, set no better than the borrower's last actual miss, is the case to lend on. Examiners expect projections to be analysed under several scenarios, not only the one the borrower prepared.
Is the 2013 leveraged lending guidance still in force?
Not for national banks and FDIC-supervised banks: the OCC and FDIC rescinded it, with its 2014 FAQs, on 5 December 2025. The Federal Reserve had not announced a rescission of its version as of October 2026. The expectation to compare performance with projections survived in the OCC and FDIC statement.
When does a credit memo need projections at all?
Whenever the credit relies on future performance that history does not show: a new business, an expansion, an acquisition, or historical coverage below the minimum. For a renewal, the useful projections are last year's, set against what actually happened.