A debt maturity schedule is a list of debts by the date they come due, with the balance owed at each date, usually summed by month or year. A company uses one to plan its own refinancing; a commercial real estate lender uses the loan-level version to see which of its loans mature when, and how much. Dates and balances alone tell a lender the size of its maturity wall, not which loans will fail to refinance. For that, each row needs the fields that let the loan be re-sized at today's terms: current income, a dated value, the rate and amortisation that set the balloon, and the guarantor behind it. Botminds' CRE Loan Maturity Management starts from exactly that schedule, read nightly from the bank's loan system, and adds the documents and arithmetic to size every loan in the window.
The example rows below come from a fictional sample bank, Marrowstone Bank, with 512 commercial real estate loans and $4.2 billion outstanding; its people and properties are invented. Industry figures are linked to their source.
Debt maturity schedule template: the fields a CRE lender needs on every loan
The loan
Loan number, borrower, property name and address
Why it mattersJoins the schedule to the credit file and the documents
Often missing because—
The loan
Property type and sub-type
Why it mattersYour refinance terms differ by type: office, multifamily, retail, industrial, hotel
Often missing becauseMixed-use and owner-occupied loans coded inconsistently
The loan
Balance today and projected balance at maturity
Why it mattersThe balloon is the number the refinance must cover
Often missing becauseOnly today's balance is stored; the balloon must be computed
The loan
Maturity date and any extension options with their conditions
Why it mattersAn option exercisable on a coverage test is not the same as a free extension
Often missing becauseOptions sit in the loan agreement, not in a field
The loan
Note rate, fixed or floating, index and spread
Why it mattersShows the payment shock at refinance
Often missing because—
The loan
Amortisation and any interest-only period
Why it mattersDrives the balloon, and the OCC treats interest-only renewals as a warning sign
Often missing because—
Income
Trailing twelve-month NOI and its date
Why it mattersCoverage and debt yield are only as current as this figure
Often missing becauseStatement dates are rarely captured as data
Income
Occupancy and the date of the last rent roll
Why it mattersA rent roll older than six months misses the rollover that matters
Often missing becauseOften held as a PDF only
Income
Lease rollover before and after maturity
Why it mattersTenants leaving just after a refinance cut the income it was sized on
Often missing becauseNeeds the leases read, not the rent roll summary
Value
Last value, basis (as is or as stabilized), cap rate and effective date
Why it mattersLoan-to-value at today's value, not the origination appraisal
Often missing becauseEffective date and basis missing; only the number kept
Sponsor
Guarantor, guarantee type and date of the last personal financial statement
Why it mattersThe 2023 workout statement expects current financial information on every guarantor and sponsor
Often missing becauseStatements older than a year are common in maturing files
Sponsor
The guarantor's other guarantees and contingent liabilities
Why it mattersA guarantor's capacity is tested across every guarantee given, not this one alone
Often missing becauseHeld only on the statement's schedule, never totalled
The bank
Risk grade, last review date and relationship manager
Why it mattersWho acts, and whether the grade is current
Often missing because—
The bank
Refinance terms that apply: minimum coverage, maximum LTV, minimum debt yield
Why it mattersLets each loan be re-sized at today's policy
Often missing becausePolicy terms live in a document, not beside the loan
What is a debt maturity schedule?
A debt maturity schedule shows how much debt falls due in each future period. In a company's accounts it is the table of principal due in each of the next five years and thereafter. For a lender it is the same idea turned around: every loan in the book, ordered by maturity date, with the balance outstanding at each.
The best-known one in commercial real estate is an industry schedule. The Mortgage Bankers Association's annual survey of loan maturity volumes "provides aggregate numbers on the current unpaid principal balance of mortgages maturing in each of the next ten years and thereafter," broken out "by major investor group and by property type" (MBA, Commercial/Multifamily Loan Maturity Volumes). Its 2026 release found that 17%, $875 billion, of $5.0 trillion of commercial mortgages was scheduled to mature in 2026, and it carries a caveat every lender's schedule shares: "the balances at the time of maturity will generally be lower than those reported here," because the figures are today's balances, not the balloons. What that industry wall looks like in 2026, and why it moves, is covered on its own page.
Debt maturity schedule template: which fields does a lender need?
A lender needs four groups of fields on each loan: the loan's own terms, current income, a dated value, and the sponsor behind it, plus the bank's grade and the refinance terms that apply. The template above lists fourteen. The first six are in every loan system. The rest decide whether the schedule can answer the only question that matters at maturity: can this loan be refinanced, here or elsewhere, on today's terms?
Three of them carry more weight than they look. The balloon, not today's balance, is what a refinance must cover; a schedule that stores only the current balance understates the problem on every amortising loan and hides nothing on an interest-only one. The date of the income and the date of the value turn a number into evidence: coverage computed on a two-year-old operating statement is a historical figure. And the guarantor's other guarantees are the field most schedules lack entirely, although the 2023 workout statement asks banks to test a guarantor's capacity against all the guarantees it has given, not just the one on the loan in front of them.
Debt maturity schedule example: seven loans, sized at today's terms
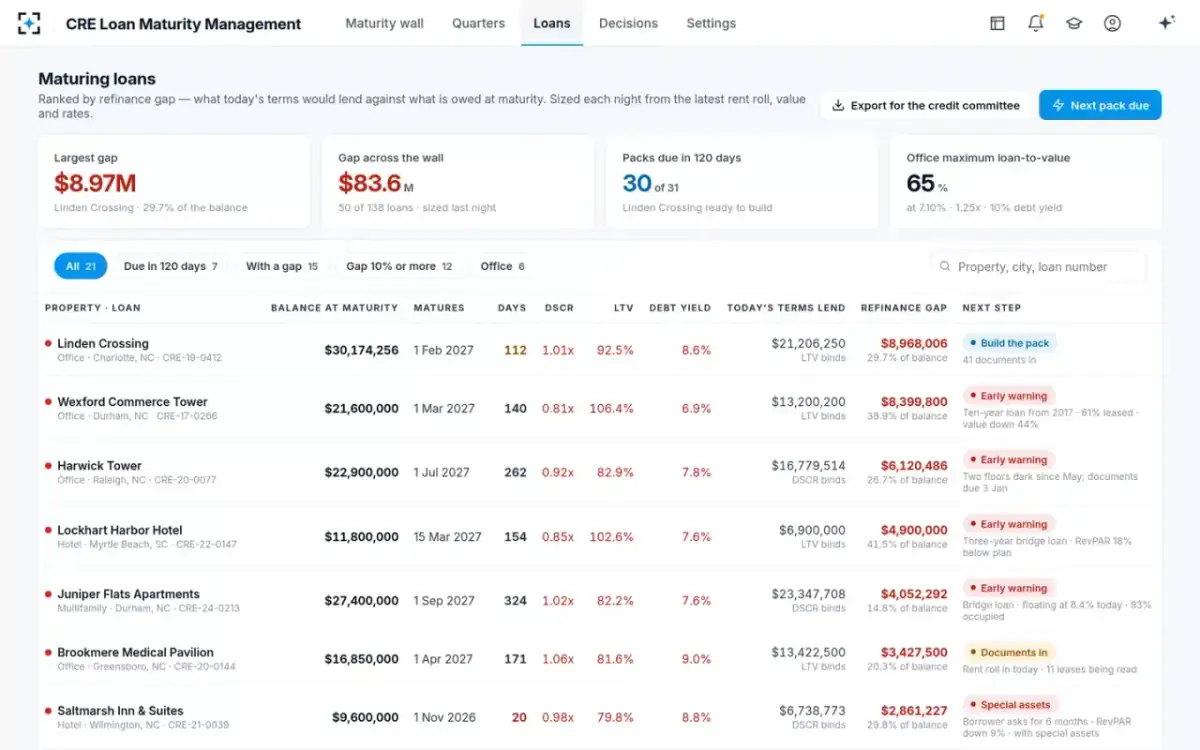
The example shows what the template produces once each loan is re-sized: the balance at maturity, coverage, loan-to-value and debt yield at the bank's current refinance terms, what those terms would lend, and the gap. These are the seven largest gaps in the sample bank's 18-month window.
A debt maturity schedule example: the sample bank's seven largest refinance gaps
| Loan | Balance at maturity | Matures | Coverage · LTV · debt yield today | Today's terms lend | Gap |
|---|---|---|---|---|---|
| Linden Crossing, office | $30,174,256 | 1 Feb 2027 | 1.01x · 92.5% · 8.6% | $21,206,250 (LTV binds) | $8,968,006 (29.7%) |
| Wexford Commerce Tower, office | $21,600,000 | 1 Mar 2027 | 0.81x · 106.4% · 6.9% | $13,200,200 (LTV binds) | $8,399,800 (38.9%) |
| Harwick Tower, office | $22,900,000 | 1 Jul 2027 | 0.92x · 82.9% · 7.8% | $16,779,514 (coverage binds) | $6,120,486 (26.7%) |
| Lockhart Harbor Hotel | $11,800,000 | 15 Mar 2027 | 0.85x · 102.6% · 7.6% | $6,900,000 (LTV binds) | $4,900,000 (41.5%) |
| Juniper Flats Apartments | $27,400,000 | 1 Sep 2027 | 1.02x · 82.2% · 7.6% | $23,347,708 (coverage binds) | $4,052,292 (14.8%) |
| Brookmere Medical Pavilion, office | $16,850,000 | 1 Apr 2027 | 1.06x · 81.6% · 9.0% | $13,422,500 (LTV binds) | $3,427,500 (20.3%) |
| Saltmarsh Inn & Suites, hotel | $9,600,000 | 1 Nov 2026 | 0.98x · 79.8% · 8.8% | $6,738,773 (coverage binds) | $2,861,227 (29.8%) |
Two things stand out that a dates-and-balances schedule would never show. Different tests bind on different loans: loan-to-value on the offices whose values have fallen, coverage on the hotel and the floating-rate apartment loan. And the gap is not the same as the risk ranking by size: Juniper Flats is the second-largest balance but carries one of the smaller gaps, while the $11.8 million hotel is short by 41.5%. How each test works, and which binds when, is laid out on the refinance risk page.
The schedule as a working list: every maturing loan ranked by refinance gap
How should a CRE maturity schedule be stratified?
By property type first, then by month of maturity, then by the size of the gap. Property type matters because maturity profiles differ sharply by type, and because refinance terms do. The MBA's 2026 figures show how uneven the industry wall is.
Share of each property type's commercial mortgages maturing in 2026
Examiners ask for this kind of cut. The OCC's CRE examination procedures ask examiners to "assess the adequacy of management and board reports regarding CRE," considering whether they address "growth", "asset quality", "concentrations" and "performance and other trends," and the request list includes "credit risk-rating reports, including a list of 'watch' credits," "financial statement tracking reports" and "concentration reports and board-approved concentration limits" (OCC Comptroller's Handbook, Commercial Real Estate Lending). A maturity schedule that carries income dates and grades doubles as two of those reports.
How far ahead should a bank track loan maturities?
Far enough to complete the work the 2023 statement expects before the date: in practice, a rolling window of 12 to 24 months, with documents requested about six months out and a decision ready four months out. The window has to cover the slowest step, which is usually getting a current rent roll and guarantor statement from the borrower, followed by a valuation where one is needed.
A maturity schedule's horizon, worked back from the date
- Watched and re-sized nightly18 → 6 months
- Documents requested and read60 days
- Decision, approval and terms120 days → date
A longer window costs little once the sizing is automatic and helps planning: the sample's maturity calendar shows 24 months, and anything beyond the 18-month horizon is watched rather than worked. A shorter window is a false economy, because a loan that enters the schedule at six months has already lost the time to order an appraisal and negotiate a paydown.
From schedule to sizing: what the extra fields buy
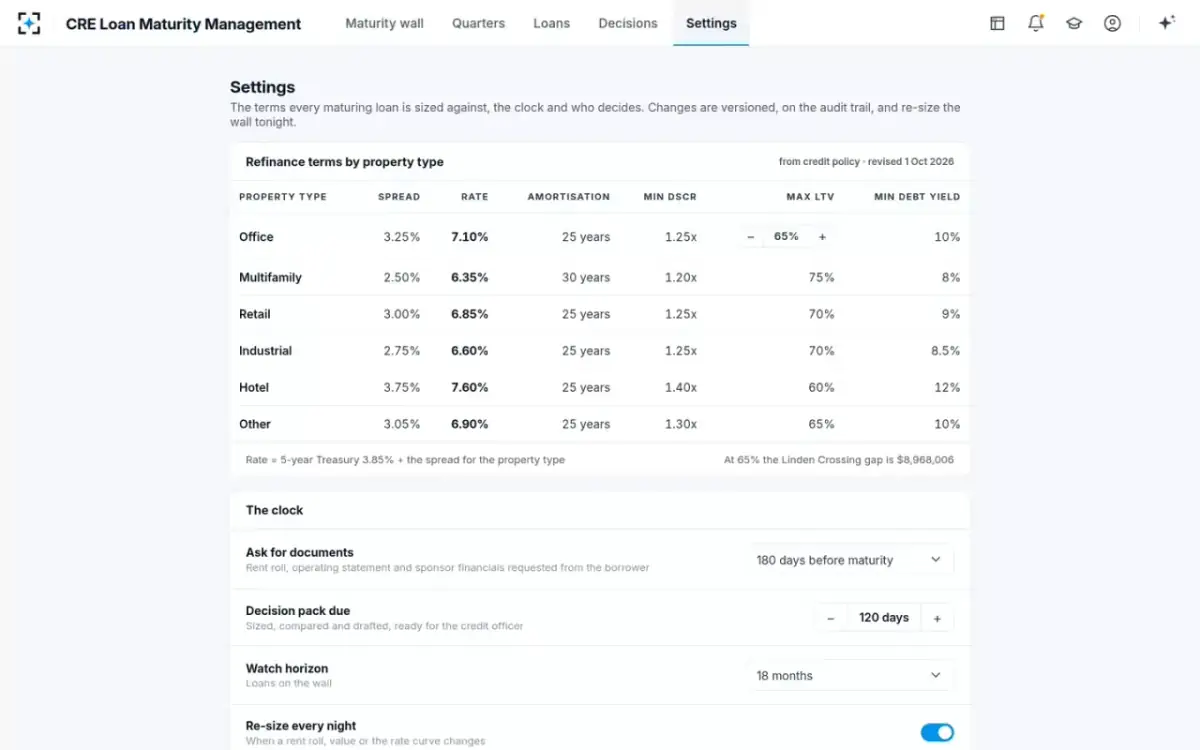
With the extra fields in place, each row can be re-sized every night: today's income against today's rate for its property type, today's value against the maximum loan-to-value, and income against the minimum debt yield. The smallest of the three is what the bank would lend, and the shortfall against the balloon is the refinance gap. At the sample bank that turns a schedule of 138 loans and $1.06 billion into a ranked list: $83.6 million across 50 loans will not refinance at today's terms.
It also makes the schedule a planning tool for the people who work it. Months can be compared by dollars short, not dollars maturing; a move in rates or cap rates can be applied to every row at once; and each loan arrives at the credit officer with the next step already named. The data is the same as a good maturity report. The difference is that it is current, and that every figure can be traced to the document it came from.
Credit policy as the schedule's sizing rules
What a maturity schedule should show the board and the examiner
A board needs three numbers from the schedule each quarter: how much matures in the next 12 to 18 months, how much of it would not refinance at today's terms, and how many of those loans already have a decision. The OCC's CRE booklet sets the standard for any such report: "MIS should provide timely, accurate, and relevant feedback," and examiners evaluate "the effectiveness of monitoring systems to identify, measure, and track concentrations and exceptions to policies and established limits."
The third number is the one most reports leave out. A schedule that shows $1.06 billion maturing and $83.6 million short, as the sample bank's does, raises the obvious question of what is being done about the $83.6 million. The decision log answers it loan by loan: which option was chosen, the grade, whether the change was disclosed as a modification, who approved it and how many days before maturity. Linden Crossing's line reads extended 24 months with a $3.0 million paydown, pass, watch, disclosed, approved 112 days ahead. A board that sees that column filling up months before the dates can stop asking whether the bank has a maturity problem and start asking how it is being priced.
What CRE Loan Maturity Management needs from your systems
It needs read access to the loan system's maturity schedule, the bank's refinance terms, and the places where rent rolls, statements, appraisals and guarantor financials are kept. It does not need the fields to be perfect on day one: where a field is missing, the agents read it from the document, and the gaps in the data become a list of documents to request at 180 days.
What to bring before agents can size your maturing CRE loans
- A maturity tape from the loan system
Loan, property type, balance, maturity date, rate, amortisation and interest-only terms, guarantor and grade; read-only, refreshed nightly.
- Your refinance terms by property type
Spread over the five-year Treasury, amortisation, minimum coverage, maximum loan-to-value and minimum debt yield, from the current credit policy.
- Where the documents live
Rent rolls, leases, operating statements, appraisals and evaluations, guarantor statements and returns: the document system or folder each sits in.
- Your valuation rule
When a new appraisal or evaluation is required at renewal, written as a test the agents can apply; the sample uses a 20% fall in value or loss of a lease over 15% of the space.
- Approval limits and the memo template
Who confirms the grade and who approves above which exposure; the accommodation memo the committee expects.
- A sample of maturing loans
Twenty or thirty loans across property types, including some already decided, to check the sizing against your committee's.
The valuation rule deserves care, because it is the one most often left implicit. The federal appraisal rules set no shelf life for an appraisal; they leave it to the bank's own written criteria, and the date-of-value field in the template is what lets those criteria be applied to every row. When a renewal needs a new appraisal, and when an evaluation will do, is worked through on its own page.
Questions people ask
What is the difference between a debt maturity schedule and a debt maturity profile?
The schedule is the list: each debt with its maturity date and amount. The profile is the shape that list makes when summed by period, often drawn as a bar chart. A "maturity wall" is a profile with a tall bar in the near years.
Is there a debt maturity schedule template in Excel for a loan portfolio?
A spreadsheet works for the fields in the template on this page; the hard part is keeping the income, value and guarantor fields current. Each needs a document read and dated, which is why most schedules hold only dates and balances.
How do you calculate the balance at maturity for the schedule?
Use the loan's rate, amortisation and payments made: the balloon is the present value of the remaining payments at the note rate. A 25-year amortisation at 6% leaves about 90% of the original principal after five years; an interest-only loan leaves all of it.
Should extension options be in the maturity schedule?
Yes, with their conditions. An option the borrower can exercise only if coverage or debt yield meets a test is a refinance in disguise; one with no test simply moves the date. Both change the schedule, differently.
What maturity reports do examiners ask for?
The OCC's CRE procedures request, among others, risk-rating reports with the watch list, financial statement tracking reports, past-due and nonaccrual lists, and concentration reports. A maturity schedule carrying dated income, values and grades supports all of them.