A rate filing tracker in Excel is the usual way a pricing team follows competitors: one row per rival filing, with the state, the filing type, the overall change, the status and a link, filled in by an analyst who searches each state's filing system and copies the numbers out of PDFs. It works, and it is not free. On the solution's own estimate, one full review of six rivals across six states takes about 12.5 working days by hand, two-thirds of them spent finding and copying rather than reading, and the reasons behind each change, which sit in the actuarial memorandum, are the part most often left blank. Competitor Rate Filing Analysis is Botminds' solution for that work: agents collect and read every rival filing in your states, and the spreadsheet becomes something the solution exports rather than something an analyst builds.
The figures on this page are estimates and arithmetic, labelled as such, using a fictional sample carrier watching six rivals in six Southeastern states. Wage rates come from the Bureau of Labor Statistics; replace them with your own.
What one market review costs when the tracker is built by hand
12.5days
of analyst time for one review of six rivals across six states, by hand
The solution’s estimate
68%
of those days spent searching, downloading and copying, before any reading
8.5 of 12.5 days
$6,250
in wages for one review at the BLS median actuary rate of $62.50 an hour
Our arithmetic; before benefits
What a rate filing tracker in Excel usually holds, and what it leaves out
It holds what can be copied quickly. A typical tracker lists the rival, the state, the line, the filing date, the SERFF tracking number, the overall percentage and a status, often typed once and rarely revisited. Those fields come from the filing's summary, which is the fastest part to read. The fields that take a reader's time, the indicated change, the reasons in the memorandum, the rating factors that moved and the regulator's questions, are the ones most often left out.
The left-out fields are the valuable ones. The CAS ratemaking text, describing what a competitor's filing can teach, notes that even a simple base rate change "may still include helpful information related to overall indicated loss cost levels and trends in losses and expenses", and that a filing changing rating variables may show the indicated relativity for each level of each variable it changes (Werner and Modlin, Basic Ratemaking, CAS; reading those pages is covered in homeowners insurance rating factors). None of that fits in a status column.
What one market review costs by hand, step by step
About 100 analyst hours for six rivals in six states, on the solution's estimate, and the steps are not equal. The cost waterfall below adds them up at the BLS median hourly rate for actuaries, the occupation closest to most pricing roles.
One market review by hand, from hours to dollars
Searching each state’s filings, rival by rival
3.5 d · 28 h · $1,750
Downloading and sorting memoranda, exhibits, rule pages
2 d · 16 h · $1,000
Copying rate tables out of PDFs into the spreadsheet
3 d · 24 h · $1,500
Reading memoranda for the reasons behind each change
2.5 d · 20 h · $1,250
Comparing with your own rates and writing it up
1.5 d · 12 h · $750
One review, by hand
12.5 d · 100 h · $6,250
The same review, filings read by agents
1 d · 8 h · $500
Finding and copying Reading and writing
Two things stand out. Finding and copying, the first three steps, are 8.5 of the 12.5 days, and none of it is analysis. And reading the memoranda, the step that produces the reasons, gets only 2.5 days across perhaps a dozen filings, which is why trackers fill the reason column with guesses or leave it empty. With the filings read by agents, the solution's estimate leaves half a day for reading what the agents quoted and half a day for comparing and writing.
Where a by-hand review's 12.5 days go
One review, six rivals, six states
- Searching · 28%
- Downloading, sorting · 16%
- Copying tables · 24%
- Reading memoranda · 20%
- Comparing, writing · 12%
Rate filing tracker template: the columns a tracker needs
If you keep a tracker, build it around the five checks a filing reading must pass, and give every figure a page. The template below is the minimum that lets someone else trust a row without re-reading the filing. It is also, column for column, what the solution exports.
Rate filing tracker template: sixteen columns, and why each is there
| Column | Where it comes from | Why it matters |
|---|---|---|
| Rival and companies | Filing at a Glance; company list | Group filings cover several companies; scope errors start here |
| State, line, sub-type | Type and sub-type of insurance | Owner-occupied homeowners is not condominium or tenant |
| Filing type | Rate, rule, form or multi | New surcharges often arrive in rule filings with no rate change |
| SERFF and state tracking numbers | Filing at a Glance; state notice | The only stable key across a filing’s life |
| Filed date | Date submitted | Starts the review clock in file-and-use states |
| Status and status date | Disposition or SERFF status | Pending is not approved; refresh until closed |
| Overall % filed | Rate schedule: overall % rate impact | What the rival asked for |
| Overall % indicated | Rate schedule and memorandum | What its data said it needed; the gap is the signal |
| Policies and premium affected | Rate schedule | Scale of the move |
| Effective dates, new and renewal | Disposition and rate pages | When the rival’s customers first see it |
| Reasons, with points | Actuarial memorandum | Why; quote the passage and the page |
| Rating rules changed | Rate/rule schedule pages | Where a new factor appears |
| Maximum and minimum change | Rate schedule, where the state requires it | Capping and dislocation |
| Objections and responses | Filing correspondence | What the regulator questioned |
| Page reference for each figure | The PDF page | Lets anyone check a row in one click |
| Source address and retrieval date | The public filing system | Shows what was public, and when |
Where the spreadsheet breaks, even when it is well kept
It breaks on change over time. A filing typed in as pending in June is still pending in the tracker in October unless someone re-opens it, and status is the column readers trust most. Indicated and filed figures get swapped when a summary field and an exhibit disagree. Links point to a search result rather than a document. And the rating manual is never whole: the CAS text warns that "Often, it can be very difficult to get a complete copy of a competitor’s rate manual," because each filing carries only the pages that change (CAS, Basic Ratemaking).
It also breaks on scale. The Federal Reserve staff study of homeowners rate filings found that the average insurer in its sample operated in about 15 states (Oh, Sen and Tenekedjieva, FEDS 2022-064). Six such rivals in fifteen states is ninety rival-state pairs to search, each with several filings a year. A tracker can follow that only by sampling, and sampling is how a rival's new rule in a neighbouring state is missed until it reaches yours.
The unit worth pricing: one cited answer, not one spreadsheet
The tracker is an intermediate product; what the business buys is answers. A typical question is which rivals raised Florida homeowners rates by more than 8%, and why. By hand it means a search of twelve filings, four memoranda opened and a paragraph written, with nothing cited unless the analyst adds the pages. In the solution, the same question returns four of the twelve filings with filed and indicated change and the reason for each, every sentence cited, and the design target is about 11 seconds.
Pricing the answer rather than the tool changes the comparison. A review done four times a year costs four reviews; a question answered whenever it is asked costs nothing extra. The figure shows what keeping the market view current costs at different cadences, using the solution's 12.5-day and 1-day estimates per full review.
Analyst days a year to keep the rival-filing view current, by cadence
How often should a pricing team review competitors' filings?
Often enough that a rival's change cannot reach its customers before you have read it, and the rating laws set that pace, not the calendar. In Texas, a homeowners rate filed under the state's file-and-use chapter may be used from the day it is filed, and one the commissioner has not disapproved within 30 days is not considered disapproved (Tex. Ins. Code ch. 2251). In Florida, a file-and-use filing made at least 90 days before its effective date gets a decision within 90 days, or is deemed approved (Fla. Stat. §627.062). A quarterly tracker can miss the whole of either window.
The practical answer is two cadences. Read every new filing as it appears, because that is when a status, a new rule or an objection letter is news. Review the market as a whole on the business's calendar, monthly or quarterly, because that is when decisions are made. By hand the first cadence is unaffordable, which is why trackers settle for the second alone. How to read insurance rate filings sets out what each nightly reading has to get right.
When a rival filing monitor pays back: the formula
It pays back when the hours it returns, priced at your cost, exceed the licence and the time it still needs from people. Put your own numbers in each term. Leave out what you cannot price honestly, such as the value of seeing a rival's new rating factor months before it reaches your state; that is a judgment for the chief actuary, not a line in a spreadsheet.
Annual return on a rate filing monitor, term by term
Review hours returned
(hours per review by hand − hours with agents) × reviews a year × hourly cost
On the estimates above: (100 − 8) h × 4 × $62.50 = $23,000 at a quarterly cadence
Head of pricing
Question hours returned
questions a year × (hours per question by hand − check time) × hourly cost
Count last quarter’s “what are the others doing?” requests
Pricing analyst
Licence and setup
annual licence + setup ÷ years of use
Vendor quote; setup is mostly the watch list and your own filings
Finance
Time still needed
digest review + watch-list upkeep + spot checks, in hours × hourly cost
Keep a monthly sample of answers checked by hand
Pricing analyst
Competitor price analysis in Excel is a different job
A competitor price analysis template compares premiums, not filings, and it answers a different question. The CAS text describes how carriers measure competitive position: "Companies generally determine overall competitive position by comparing premiums for a set of sample risks, for all quoted risks (for new business), or for all existing insureds (for renewal competitiveness)" (CAS, Basic Ratemaking). The premiums come from quoting studies or comparative raters, which return a price for a described risk.
The two belong side by side on a competitor price analysis dashboard, and they should not be merged into one column. A quoting study shows where you stand today on a sample of homes. The filings show why a rival's price moved, what its own data said it needed, and what it has filed that has not yet reached customers. The gap between a rival's indication and its filed change is often the best early sign of the next quoting study's result.
Keep the spreadsheet for what it does well
A spreadsheet is a good place to model; it is a poor place to collect. Once the filings are read for you, the export becomes the starting point for the work an analyst should be doing: setting a rival's new factor table against your own, estimating which of your policies sit in a band it surcharged, and testing whether your indication still holds. In the sample, every filing read can be downloaded as a spreadsheet, with the tracking number and the status as of the night it was read.
Competitor Rate Filing Analysis: every filing read, exportable as a spreadsheet
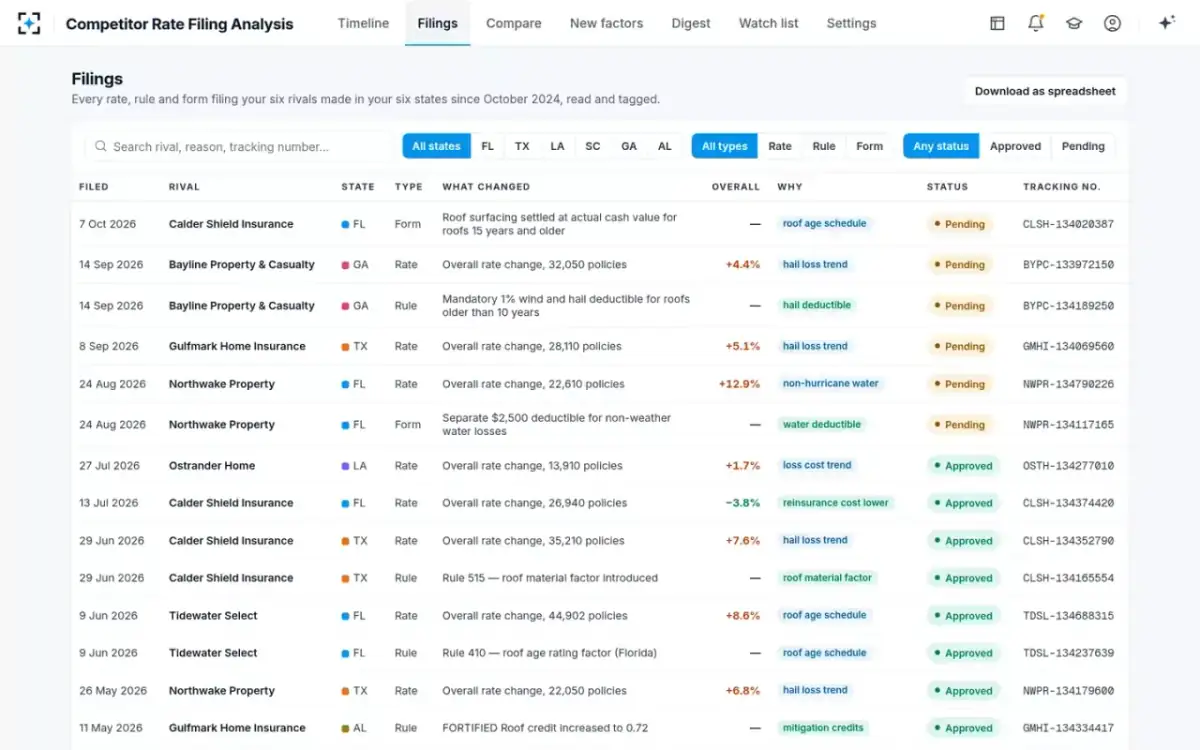
The difference is what the rows carry. Each one links to the filing page and passage behind its figures, its status is refreshed as the state updates it, and a rule filing with no rate change sits in the same list as the rate filings, which is where a new deductible for older roofs is easiest to miss. What to set up before you watch rivals lists the decisions that come before any export: the states, lines, rivals and systems.
Questions people ask
Is there a rate filing tracker template in Excel?
Not an official one; regulators publish filing requirements, not trackers. A useful template keys each row on the SERFF tracking number and carries filed and indicated change, status with its date, effective dates, reasons with their page, and the source address, as in the sixteen-column table on this page.
How long does it take to track competitor rate filings by hand?
On the solution's estimate, about 12.5 working days for one full review of six rivals across six states, of which 8.5 go on searching, downloading and copying. Keeping the view current weekly by hand would take about 650 days a year, roughly three analysts.
What should a competitor price analysis dashboard show?
Two things kept apart: premiums from quoting studies on a set of sample risks, and filed changes from public rate filings with their status and reasons. The first shows where you stand today; the second shows what rivals have filed that has not yet reached their customers.
How is competitive intelligence done in the insurance industry?
For personal lines pricing it rests on two public or semi-public sources: rate filings, which most states publish, and quoted premiums, from rating studies and agency comparative raters. The CAS ratemaking text lists competitors' rate filings among the standard external data sources actuaries use alongside industry statistical data.
How many rows does a homeowners rate filing tracker need?
More than most teams expect. In California alone, 73 companies in 39 groups appeared on homeowners filing entries in the department's 52 weekly public notices to 23 October 2026, by our count. A tracker limited to six rivals in six states still needs a row for every rate, rule and form filing they make, which in the fictional sample came to 214 filings over two years.
Can the tracker be automated in Excel itself?
Partly. Search results can be imported, but the figures that matter, the indication, the reasons and the changed rating pages, sit inside PDFs and must be read. That reading, with the page kept for each figure, is the part the solution's agents do before anything reaches a spreadsheet.