Homeowners rate filings by state are public in almost every state, and read together they show a market that moves state by state rather than nationally: Texas receives hundreds of homeowners rate filings a year, Florida's regulator reports average requests below zero, and California's weekly notices show filed changes bunched just under the 7% at which a public hearing can be demanded. The research on these filings explains why the picture differs so much: in a Federal Reserve staff study, homeowners rates track risk least in the states where regulation is most restrictive, and insurers recover the difference in other states. Competitor Rate Filing Analysis is Botminds' solution for reading the same record for one company's rivals: every filing your watched rivals make in your states, read nightly, with the reason from each actuarial memorandum and a state-by-state view of who moved and why.
The state figures below come from the regulators' own publications and our count of one state's notices. Where the page shows a single company's view, it uses a fictional sample carrier, Kestrel Point Mutual, and six invented rivals in Florida, Texas, Louisiana, South Carolina, Georgia and Alabama.
Insurers have cross-subsidized high friction states by raising rates in low friction states.
Oh, Sen and Tenekedjieva, Federal Reserve Board FEDS 2022-064
Where to find homeowners rate filings by state
In each state's public filing system, one state at a time. Forty-nine states, the District of Columbia and Guam publish through the NAIC's SERFF Filing Access; Florida publishes through its own IRFS search; some states, California among them, also post notices of filings received. We know of no regulator that publishes a single national table of homeowners rate changes by company and state, which is why studies of the subject, including the Federal Reserve paper on this page, buy their filing data from a commercial database and why a pricing team builds its own view from the filings.
A few regulators publish counts and averages that make a useful frame. The three below are among the most informative: Texas counts the filings it receives, Florida reports the average change requested, and California lists every filing weekly. SERFF filing search covers the mechanics of each system.
A sample state map: rivals' latest homeowners rate filings, by state
FL
−4.2% to +12.9%
6 rival filings · 1 pending
Mixed: hurricane model, reinsurance, roof age, water, mitigation credits
TX
+5.1% to +7.6%
3 rival filings · 1 pending
Hail loss trend, all three
GA
+4.4% to +7.3%
3 rival filings · 1 pending
Hail and loss cost trend
AL
+3.9% to +5.8%
2 rival filings · none pending
Loss cost trend
SC
+3.2% to +4.0%
2 rival filings · none pending
Reinsurance cost, hurricane model
LA
+1.7% to +2.3%
2 rival filings · none pending
Loss cost trend
both directions, widest range highest change 7% to 8% highest 4% to 6% highest under 3%
Even in a fictional market of six rivals, the state view carries information a national average would erase. Texas filings cluster on one reason, hail loss trend, while Florida's run in both directions with five different reasons. A carrier reading only an average of these eighteen filings would see a market rising by about five percent and miss both stories.
Homeowners rate filings 2024 and 2025: what Texas counts
Texas publishes how many filings it receives, line by line, in its annual report. The Texas Department of Insurance's 2025 annual report shows 289 homeowners rate filings received in fiscal year 2024 and 218 in fiscal year 2025, after 301 in 2023 (Texas Department of Insurance, Annual Report 2025). Personal auto rate filings, by comparison, peaked at 764 in 2023.
Texas insurance rate filings received for homeowners, by fiscal year
Two readings follow. First, the volume: roughly 220 to 300 homeowners rate filings a year in one state means several a week, more than a pricing desk reads by hand. Second, the turn: filings fell by about a quarter between fiscal 2024 and 2025. Fewer filings can mean rates have caught up with losses, or that companies are waiting; the filings themselves, and their memoranda, say which. Texas rates for homeowners can be used from the day they are filed under the state's file-and-use chapter, so a Texas filing is news the day it is public.
Homeowners insurance rate filings in Florida: the turn the regulator reports
Florida's Office of Insurance Regulation publishes the average change requested, and since the 2022 reforms the direction has reversed. In May 2026 it said it had "received over 190 residential filing requests for rate decreases or 0% increases," that "The 30-day average request for homeowners’ rates is -1.2%, compared to -0.3% one year ago," and that the 180-day average was −2.9%, against +6.6% three years earlier (Florida OIR, 20 May 2026). The regulator's statement is promotional in tone, but the averages are its own data.
Florida homeowners rate filings, then and now, by the regulator's own figures
Before: +6.6%, three years earlier
May 2026, or latest: −2.9%
Before: −0.3%, one year earlier
May 2026, or latest: −1.2%
Before: +27.03%, 2022 to 2023
May 2026, or latest: −1.70% in 2024; −0.46% in 2025
Before: Not reported
May 2026, or latest: Over 190 since the 2022 reforms
Reinsurance is the reason to watch in Florida filings. Florida law lets a residential property insurer make "a separate filing limited solely to an adjustment of its rates for reinsurance" and related financing costs (Fla. Stat. §627.062(2)(k)), and the regulator's January 2026 stability report found risk-adjusted reinsurance costs up 27.03% from 2022 to 2023, then down 1.70% in 2024 and 0.46% in 2025 (Florida OIR, January 2026). A rival that still cites reinsurance cost for an increase in 2026 is saying something specific about its own program, and its memorandum should show it.
California insurance rate filings: a year of public notices, counted
California lists every filing it receives in a public notice posted each Friday, with the company, line, filing type, the overall rate change where one is requested and the SERFF number. We read all 52 notices dated 31 October 2025 to 23 October 2026. They carried 157 homeowners entries from 73 companies; once group filings are counted once, 27 homeowners filings showed an overall rate figure, and 17 of those showed zero, mostly new programs and filings with no overall change (California Department of Insurance, public notices).
The pattern is clearer across all personal lines. Of the 113 personal lines filings in the year's notices that showed an overall rate figure, 20 requested exactly 6.9% and 3 exactly 7.0%, against 12 spread across the whole range from 0.1% to 6.8%. Proposition 103 requires the commissioner to hold a hearing on a timely request when a personal lines change "exceeds 7% of the then applicable rate" (Cal. Ins. Code §1861.05). The bunching is visible in the figure.
California personal lines filings by requested overall change: a spike at 6.9%
A cluster at 6.9% does not prove any company's motive; the notices give no reasons, and each memorandum must justify its own number. What it shows a competitor is that in a prior approval state with a hearing threshold, the filed change can be shaped by the process as well as the indication. A rival filing 6.9% in California may have an indication well above it, and the gap is in its exhibits. Rate indication vs selected rate shows how to read it.
Why homeowners rate increases differ so much by state
Partly risk, and partly regulation. The Federal Reserve staff study measured each state's rate-setting "frictions" as the share of the rate change insurers targeted but did not receive, and found that "Rates are least reflective of risk in states we classify as “high friction”, i.e. states where regulations appear most restrictive" (Oh, Sen and Tenekedjieva, FEDS 2022-064). Over the sample period, rates grew about 4 percentage points slower in high friction states than elsewhere, even though those states were more exposed to climate losses.
What regulation does to homeowners rates across state lines
4 pts
slower rate growth in high friction states than in the others
Despite higher climate exposure
$8B
extra homeowners premium projected in low friction states over 10 years
At historical growth rates
30%
of that, about $2.4 billion, attributed to spillovers from high friction states
The cross-subsidy
The cross-subsidy: why a rival's filing in one state is news in another
Because losses in one state can show up in rates in another. The study found asymmetric spillovers: rates in low friction states rose after losses in high friction states, but not the reverse, and it projected that "consumers in low friction states will pay an additional $8 billion in HO premiums over the next 10 years", of which about 30% would be due to spillovers from high friction states. It found no matching change in products or risk taken in the low friction states, which is why the authors call it cross-subsidization.
For a competitor the practical lesson is to read a rival across all its states, not only yours. A rival that is held below its indication in one state, by regulation or by its own choice, may make it up where it can, and its filings there will show it first. The Federal Reserve authors' own illustration is a four-state insurer for which losses in California would raise rates in Virginia and New Hampshire but not in North Carolina.
Reasons by state: what rivals say in their memoranda
The reason a company gives is as state-specific as the rate. In the sample, hail dominates the Texas and Georgia memoranda, hurricane models and reinsurance the Florida and South Carolina ones, while roof age, water and catastrophe model changes cut across states. Reading reasons by state tells you whether a rival's increase is about the state's weather, its own book, or a rating structure it is rolling out everywhere.
Competitor Rate Filing Analysis: one reason, every state it was filed in
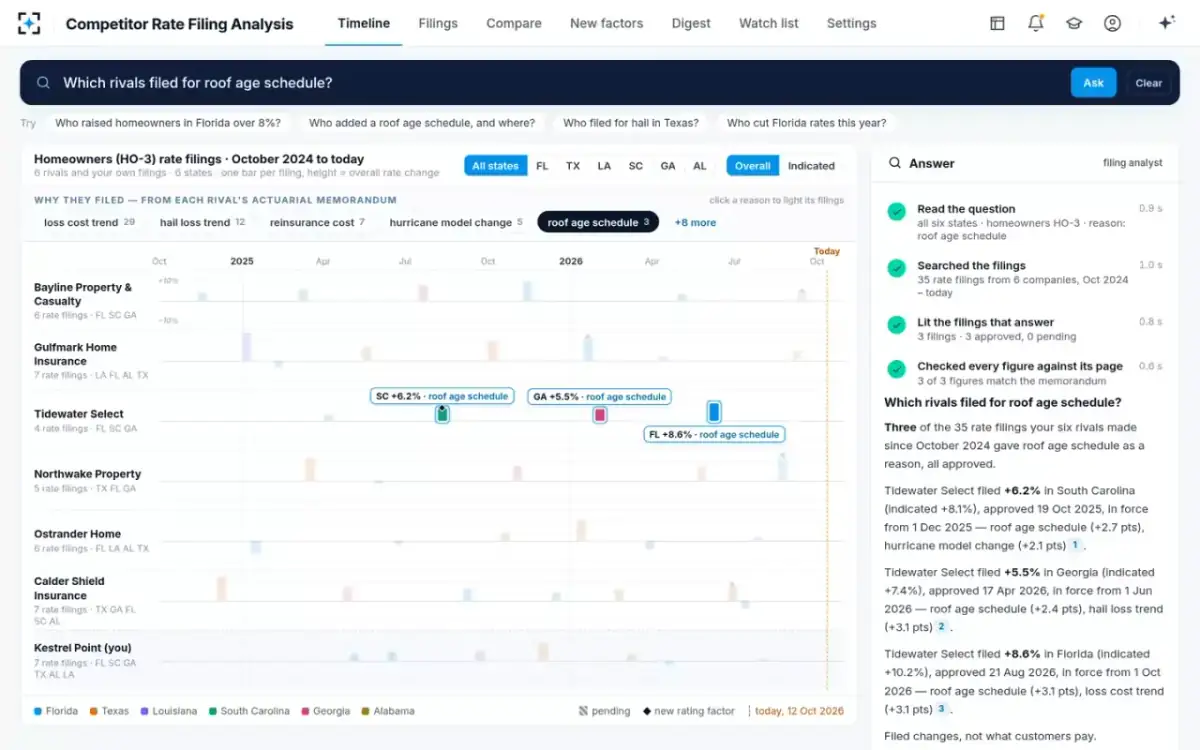
In the sample, the rival's roof age schedule moved from South Carolina to Georgia to Florida over ten months, each filing quoting the points the schedule contributed. A state-by-state reading shows a rollout; a single-state reading shows a surprise. Spotting a rival's new rating factor follows that schedule from the first filing to its effect on the carrier's own book.
Reading a state map of rate filings honestly
Four rules keep a state map from misleading. Count filings, not companies: group filings name several companies for one change. Keep pending apart from approved, and mark it. Compound changes over time rather than averaging them, and say over what period. And never compare filed changes with premiums: a filing is an average change to a rate structure, not the price of any home. The NAIC's handbook for rate reviewers notes that states "often place more emphasis on personal lines filings versus commercial lines filings" (NAIC Product Filing Review Handbook), so personal lines filings are also the ones most likely to draw questions before a decision.
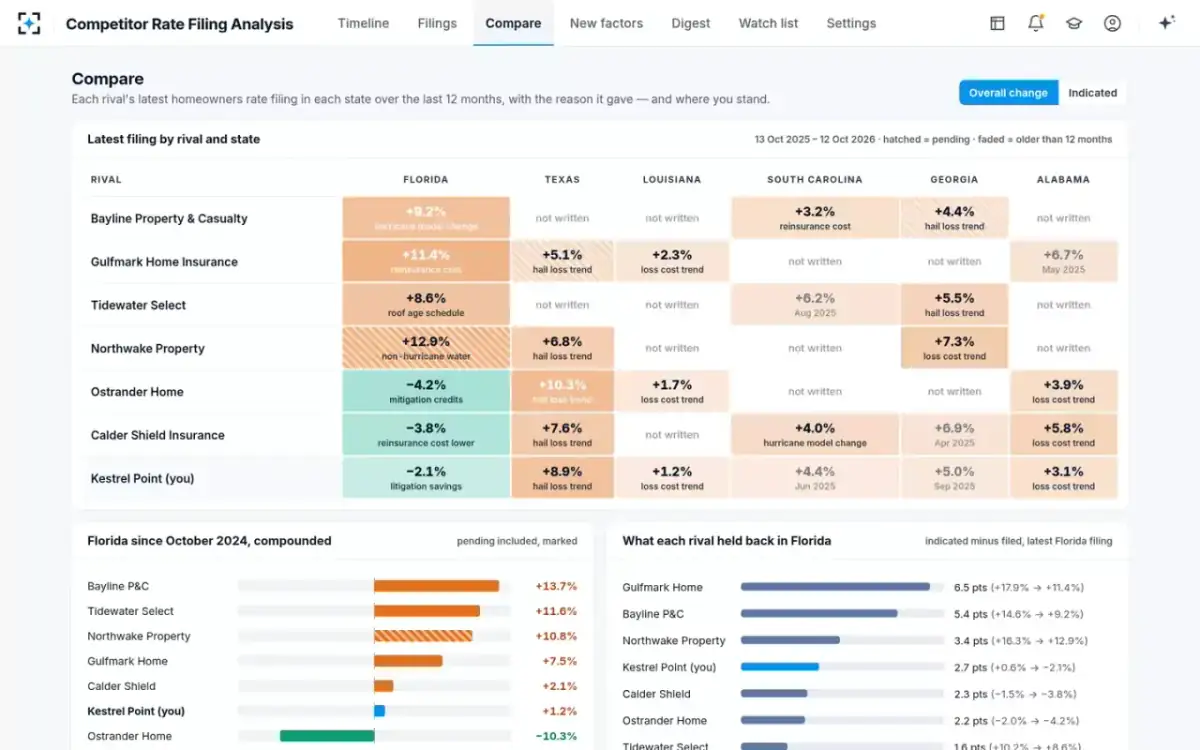
The sample's compare view in Competitor Rate Filing Analysis applies those rules: each rival's latest filing in each state over 12 months, pending hatched, older filings faded, and a separate chart of each rival's Florida change compounded since October 2024. In it, the carrier's own Florida position, +1.2% compounded, sits well below the three rivals at +10.8% to +13.7%, which is a question for the pricing team before it is a headline for anyone else.
Every rival's latest filing in every state, with its reason
Questions people ask
How many homeowners rate increase filings does a state receive?
We know of no regulator that publishes a national ranking, so the answer comes state by state. Texas, which publishes its counts, received 289 homeowners rate filings in fiscal year 2024 and 218 in fiscal year 2025, according to the Texas Department of Insurance's 2025 annual report.
Are Florida homeowners rate filings going down?
By the regulator's figures, yes. Florida's Office of Insurance Regulation reported in May 2026 a 30-day average homeowners request of −1.2% and a 180-day average of −2.9%, against +6.6% three years earlier, and more than 190 residential filings for decreases or 0% since the 2022 reforms.
Where can I see Texas insurance rate filings?
On SERFF Filing Access, linked from the Texas Department of Insurance's SERFF page, for filings received after 13 April 2014. Each filing and its supporting information is public information under Texas Insurance Code §2251.107, though parts marked confidential are left out of search results.
Where can I see California insurance rate filings?
In the Department of Insurance's virtual viewing room and through SERFF Filing Access, with new filings listed in a public notice every Friday. Proposition 103 requires a hearing on a timely request for a personal lines change above 7%, and the public has 45 days from the notice to ask for one.
Why do homeowners insurance rate increases vary by state?
Because risk, losses and regulation all vary. A Federal Reserve staff study found rates least reflective of risk where regulation is most restrictive, with rates growing about 4 percentage points slower in those states and insurers recovering part of the difference in less restrictive ones.
Do homeowners rate filings show what customers pay?
No. A filing states an average change to a company's rates and rating rules for a program; each customer's change depends on rating variables, discounts, tier placement and any cap. A state view of filings shows the direction and reasons of the market, not prices.