The quote to bind ratio is the number of policies bound divided by the number of quotes issued, for the same group of submissions: 30 bound from 120 quoted is 25%. It is a closely watched number in commercial underwriting and, on its own, one of the least informative, because it says nothing about the submissions that never became quotes: the duplicates, the risks outside appetite and the incomplete files that took desk and underwriter hours before anyone priced anything. A carrier that wants to improve its results needs the whole funnel, from submission received to policy bound, with a formula and a cost at every step. Botminds' Commercial Submission Intake & Clearance is an agentic solution that reads, keys, clears and checks every broker submission as it arrives, and reports each broker's share in appetite, complete on arrival, quoted and bound.
The figures used below come from a fictional sample carrier, Keelwater Insurance Group, whose Central region received 1,002 submissions from ten brokers in the 30 days to Monday 12 October 2026; they are sample data, and the funnel arithmetic on them is ours. Wage and compensation figures come from the Bureau of Labor Statistics and O*NET, linked where used.
The submission funnel as one chain of formulas, with the sample month beside it
Submissions received
Every submission email, counted by received timestamp, non-submissions removed
1,002
Cleared
Clearance pass rate = cleared ÷ received
1,002 less duplicates (14 caught)
In appetite
Appetite rate = in appetite ÷ cleared
about 71% of received
Ready to price
Ready rate = complete, on arrival or after requests ÷ in appetite
about 67% of received arrived complete
Quoted
Submission-to-quote = quoted ÷ received
about 236, or 23.5%
Bound
Quote-to-bind = bound ÷ quoted · Submission-to-bind = bound ÷ received
55 bound · 23.3% · 5.5%
What is a quote to bind ratio?
A quote to bind ratio is bound policies divided by quotes issued, for one defined group of submissions. It measures how often a price the carrier offered was accepted, which makes it a measure of price, terms, service and the broker's commitment together, not of underwriting quality alone.
Its weakness is its denominator. Quotes are what is left after clearance, appetite and completeness have removed everything else, and every one of those earlier steps costs time. Two carriers with identical quote to bind ratios can have very different economics: one quotes a quarter of what it receives, the other a tenth, and the second has paid desk and underwriter hours on three times as many files it would never price. The ratio people search for is the last link in a chain, and the chain is where the cost is.
How do you calculate quote to bind ratio? The formula and the cohort trap
Calculate it as policies bound from a set of quotes divided by the number of quotes in that set, where the set is fixed by quote date: all quotes issued in March, and how many of those bound, whenever they bound. That cohort method is the one to use; the shortcut of dividing this month's binds by this month's quotes mixes different submissions and drifts with the season.
The shortcut is tempting because the numbers are already on the month-end report. But a commercial quote can bind weeks after it is issued, close to the effective date, so a month with a heavy renewal season shows many binds against quotes issued the month before. The cohort method needs a few weeks to settle, which is its only cost, and it is the only version two periods can be compared on. Whichever is used, the definition belongs in writing on the report, because "quote" itself needs one: a firm quote, an indication and a revised quote on the same account are three different counts.
The sample month shows the trap in miniature. Its brokers screen counts 55 policies bound over 30 days and quotes issued to about 236 submissions over the same days, so the period ratio is 23.3%. Some of those 55 came from quotes issued before the window, and some of the 236 quotes will bind after it. The figure is a fair indication of the region's level; it is not a cohort result, and the screen's own label, bound in the last 30 days, says so.
What is hit ratio in insurance? Why two carriers' hit ratios may not compare
Hit ratio is used in two senses: bound policies divided by submissions received, and bound divided by quoted, which is the quote to bind ratio by another name. Because both are in use, a hit ratio from another carrier or from a broker's survey says little until its denominator is known.
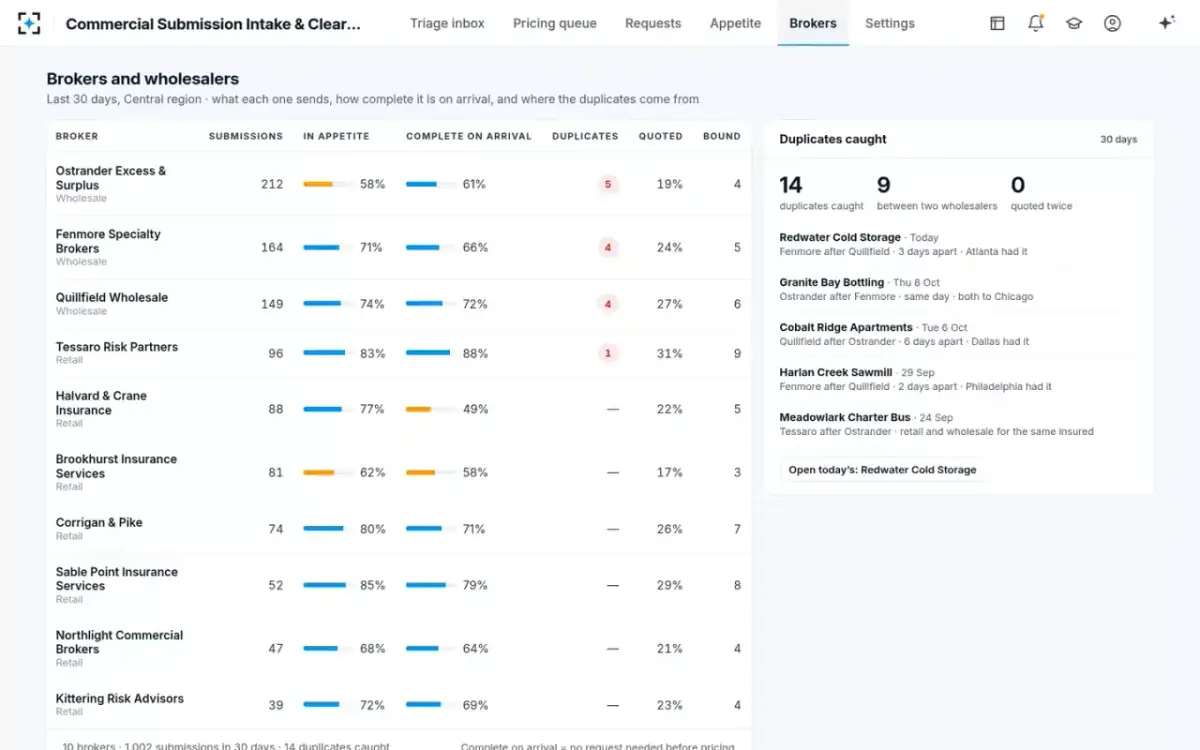
The difference is large. On the sample month, bound divided by quoted is 23.3% and bound divided by received is 5.5%; the same business, two hit ratios a factor of four apart. Neither is wrong. They answer different questions: the first is about the carrier's quotes, the second about its whole front door, including what clearance and appetite removed. A carrier's own report should print both, with their formulas, and never call either by a name the reader has to guess at.
What is submission to quote ratio? The step that carries the desk's cost
Submission to quote ratio is quotes issued divided by submissions received. It measures how much of what brokers send ends in a price, and it is the step where most of the desk's hours go, which makes it the ratio with the most to say about cost.
The sample region quoted about 23.5% of what it received over the month. The rest divided into three kinds of non-quote with very different causes: duplicates that clearance should stop before anyone works them, risks outside appetite that should be declined in minutes, and in-appetite risks that were never quoted because the file was incomplete, the broker went quiet or the underwriter ran out of hours. Only the third kind is lost business in any useful sense. The first two are costs, and the question is how early they are recognised.
Commercial Submission Intake & Clearance shows the funnel broker by broker
What is a good quote to bind ratio?
There is no public benchmark worth trusting from a government or research source, and a single target would mislead anyway, because the right ratio depends on the line, the market cycle and the broker. The useful comparison is internal: by broker, by line and against your own trend.
The sample shows how wide the internal spread can be. Dividing each broker's binds by its approximate quotes, the ratio ran from about 10% for the busiest wholesaler to about 53% for a retail broker that sent a quarter as many submissions. The busiest wholesaler sent 212 submissions, of which 58% were in appetite and 61% complete on arrival, and bound four; the retail broker sent 52, 85% in appetite and 79% complete, and bound eight. Volume and value are not the same thing, and only a by-broker view shows it.
Quote to bind, broker by broker, on the sample month
Market conditions move the whole bar chart. Commercial lines direct premiums written grew 4.7% in 2025, according to the Federal Insurance Office's 2026 annual report, with commercial auto liability and other liability growing faster; conditions like these move every broker's bar at once, which is one more reason to compare a broker with itself over time rather than with an industry figure.
How much does it cost to quote a commercial submission?
The cost of quoting a commercial submission is the hours spent on it, by role, times each role's loaded hourly cost, and the honest version counts every submission that consumed hours, not just the ones quoted. No public source gives the hours, so the method below uses Botminds' own estimate for the desk work and leaves the underwriter's hours for you to fill in.
Start with the hourly cost. O*NET puts the 2025 median wage of insurance claims and policy processing clerks at $23.67 an hour, and the BLS puts the median for underwriters at $39.12. Wages are not the whole cost: in the Bureau's June 2026 compensation survey, wages and salaries were 68.5% of employer costs for full-time private industry workers, benefits the rest (BLS Employer Costs for Employee Compensation). Dividing each median by 0.685 gives a loaded cost of about $34.55 an hour for the desk and $57.11 for an underwriter, the same underwriter rate the loss run software cost model uses.
The inputs to a cost per submission
$23.67/hr
median wage, insurance claims and policy processing clerks, 2025
$39.12/hr
median pay, insurance underwriters, 2025
68.5%
share of employer compensation costs paid as wages, full-time private industry workers, June 2026
8hrs
desk time on a middle-market submission worked by hand, Botminds’ estimate
What the sample month's non-quotes cost at the desk, by hand and with the agents
| Line | Calculation | By hand | With the agents |
|---|---|---|---|
| Loaded desk cost per hour | $23.67 ÷ 0.685 | $34.55 | $34.55 |
| Desk hours before a submission is stopped | Logging, keying, clearance and appetite (Botminds’ estimate) | 7.0 | 0.8 |
| Submissions stopped at clearance or appetite | 14 duplicates + about 291 outside appetite | 305 | 305 |
| Desk cost of stopped submissions, per month | 305 × hours × $34.55 | $73,774 | $8,431 |
| Desk cost per bound policy, all submissions | 1,002 × desk hours (8.0 or 1.0) × $34.55 ÷ 55 bound | $5,036 | $630 |
| Add for the underwriter | Quoted × your underwriter hours per quote × $57.11 ÷ bound | your hours | your hours |
The table's most important line is the fourth. In the hand process as Botminds' estimate describes it, a duplicate or an out-of-appetite risk is discovered after it has been logged and keyed, because the search and the appetite check need the keyed data. On the estimate, that is seven desk hours spent on a file nobody will price, and on the sample month about $74,000 of desk time. Moving clearance and appetite to the minute the email lands, before keying matters, does not change how many such submissions arrive. It changes when the carrier finds out, and so what they cost.
How does clearance affect hit ratio?
Clearance affects hit ratio in two directions. Duplicates that slip through inflate both submissions and quotes, because the same account is worked twice and can bind at most once, so they push quote to bind down. Clearance that blocks too much, at a loose threshold, throws away genuine new business and pushes submission to bind down instead.
The sample region caught 14 duplicates in the month, nine of them between two wholesalers, and quoted none twice. Had each been quoted twice, the region would have issued 14 more quotes with no more binds, and an underwriter would have spent each of those days on a file another office was already pricing. The opposite error is just as real: on the same morning a fabricator whose name matched an existing account at 61% but whose FEIN differed was cleared, rightly, rather than blocked. The threshold that separates the two errors is a setting the carrier owns, and the submission clearance specialist's seat is where it is watched.
How do you benchmark quote turnaround time?
Benchmark quote turnaround from timestamps you control: from the received time of the broker's email to the moment the submission is ready to price, and separately from ready to price to quote issued. Report the median and the 90th percentile, by line and by broker; an average hides the files that waited a week.
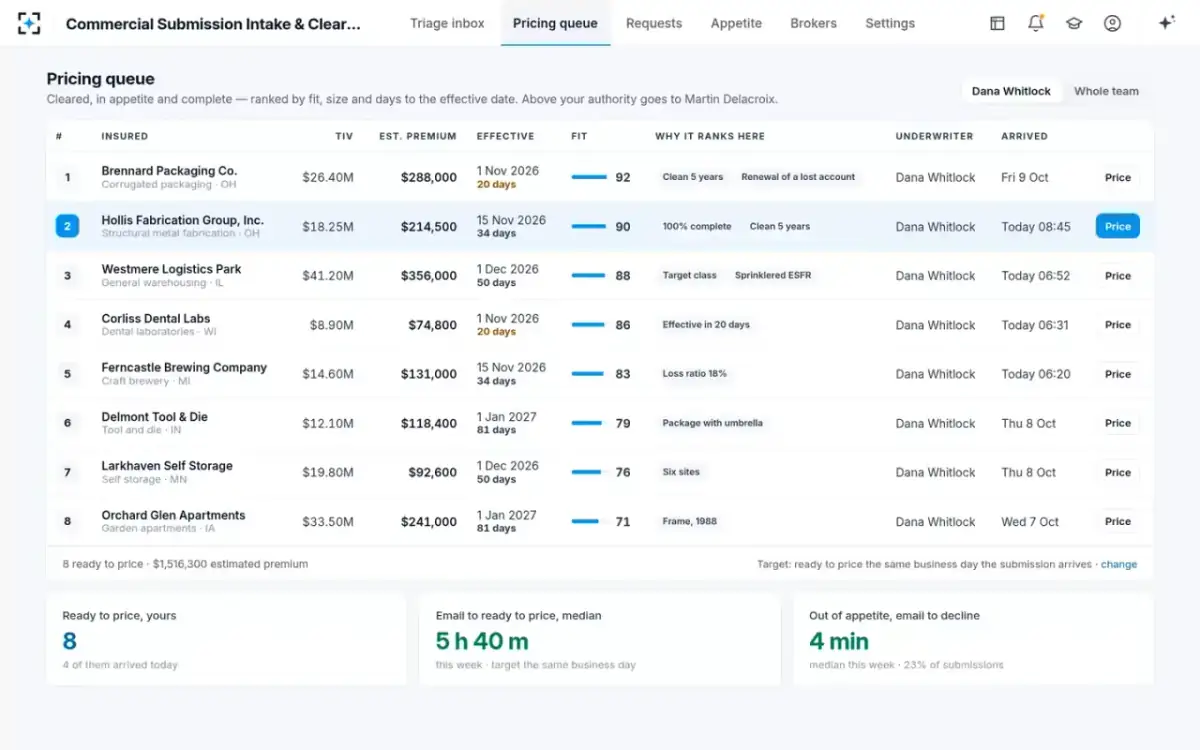
Splitting the clock matters because the two halves have different owners. The first half is the intake desk's: reading, keying, clearing, checking appetite and getting what is missing. The second is the underwriter's. In the sample, the median from email to ready to price was 5 hours 40 minutes over the week, against a target of the same business day, and the median from an out-of-appetite email to its decline note was four minutes. Both are sample figures; the method is what transfers. How each step's time builds up is set out in the commercial insurance submission process.
In Commercial Submission Intake & Clearance the pricing queue carries its own clocks
Which underwriting KPIs matter most? Eight, with formulas and owners
The KPIs that matter most are the ones that say where the funnel loses submissions and how long each loss took to recognise. Quote to bind is one of eight; on its own it describes only the last step.
Eight submission funnel KPIs, each with its formula and its owner
- Submissions received, by broker and line
Count by received timestamp, non-submissions removed. Owner: submission desk.
- Duplicate rate
Duplicates caught ÷ received, and duplicates quoted twice (target zero). Owner: submission desk lead.
- Appetite rate
In appetite ÷ cleared, by broker; a falling rate is a broker conversation. Owner: regional underwriting manager.
- Complete on arrival
Submissions needing no request ÷ in appetite, by broker. Owner: underwriting assistants and the broker’s account team.
- Email to ready to price
Median and 90th percentile, received timestamp to ready to price. Owner: intake desk.
- Out-of-appetite email to decline
Median, received timestamp to decline sent. Owner: underwriter.
- Submission to quote
Quoted ÷ received, cohort by received month. Owner: underwriting.
- Quote to bind
Bound ÷ quoted, cohort by quote month; never period over period. Owner: underwriting and distribution.
Read together, the eight say where to act. A broker with a low appetite rate needs a conversation about the appetite guide; one with a low complete-on-arrival rate needs a better checklist; a desk with a long email-to-ready time needs its intake moved earlier; a region with duplicates quoted twice needs its clearance search widened. Quote to bind tells you only that something, somewhere, went right or wrong. To see the funnel on your own brokers, start from Commercial Submission Intake & Clearance.
Questions people ask
Is quote to bind the same as close ratio?
Teams use close ratio in both senses, bound divided by quoted and bound divided by submitted. The only safe practice is to print the formula beside the number. On the sample month, the two readings differ by a factor of four.
Should declined submissions count in hit ratio?
In the submission-to-bind version, yes, because they consumed hours. In quote to bind they never appear, because they were never quoted. That is exactly why a carrier needs both ratios: one shows the cost of the front door, the other the result of the price.
How long should a quote cohort be left to settle?
Long enough for most quotes in it to reach their effective date, since a quote binds, if at all, by the time coverage is due to start. A month's cohort read 60 days after the month ends is a reasonable default to test against your own binding pattern.
Does a higher quote to bind ratio always mean better underwriting?
No. A carrier can raise it by quoting less, or by pricing below the market, and both can hurt results. Read it with the loss ratio of what bound and with the submission-to-quote ratio of what was received.
Why might wholesale brokers show lower quote to bind ratios?
In the sample, the three wholesalers bound 10% to 15% of what they were quoted while retail brokers bound 22% to 53%, and every duplicate the region caught involved a wholesaler. One explanation to test on your own book: a wholesale account may be shown to several markets at once, so each carrier wins a smaller share. It is a pattern in a sample, not a rule.