CLO analytics, for a manager's compliance and operations team, means measuring how well the firm finds and explains differences between the trustee's reports and its own numbers before those reports become final and the deals pay. The usual dashboards count the wrong thing: tests run, deals covered, reports processed. Any engine runs all the tests, so those counts never fall short; what varies, and what costs money, is a break found late or explained wrongly. Botminds' CLO Compliance reports five measures instead, breaks, time to cause, breaks open at finalization, payment-date exposure and rework, by deal and by cycle, so a head of CLO operations can price the programme and see where it fails.
The figures from the solution on this page are sample data on fictional firms, from Quillfield Capital's October 2026 cycle across 31 CLOs. Industry figures are linked to the regulator or researcher that published them.
The October cycle at the sample manager, in CLO Compliance
34
breaks between trustee and manager across 15 of 31 deals
17
causes once breaks were grouped and each re-derived by a second agent
1
cause that moved cash on a payment date: $583,750 of interest
76min
from the draft report's arrival to that cause traced to one loan
What is CLO analytics?
CLO analytics covers three different jobs that share a name: portfolio analytics (what the loans are worth and how they might default), deal analytics (how the waterfall pays each tranche under a scenario) and compliance analytics (whether the tests the indenture sets are passed, measured correctly and explained). A search for "CLO analytics software" can mean any of the three. This guide is about the third, which is the one a manager's own operations team is accountable for every month.
Compliance analytics starts from a fact about CLO reporting: the trustee publishes, the manager checks. The research literature describes the trustee as "responsible for calculating the monthly compliance test scores as well as preparing and distributing the CLO reports", with the manager working alongside it (Loumioti and Vasvari, Journal of Accounting and Economics, 2019). The manager's analytics are therefore measures of a check, and a check is measured by what it catches and when.
Why "tests run" is the wrong measure
Counting tests run measures the engine, not the outcome. A manager with 31 deals and about 60 tests a deal runs nearly 2,000 tests a cycle whether its reconciliation is excellent or careless; the sample firm's agents recomputed 1,766 tests overnight from 12,184 positions. None of that says whether the one break that mattered was found in time.
Failures themselves are not the right measure either. In 2008–2013, CLOs reported "an OC test violation in only about 12% of their monthly reports", and the study that found it also found the junior tests sitting about 4% above their triggers (Loumioti and Vasvari). Most months most tests pass, on both sets of numbers. The costly event is a test that passes on the trustee's numbers and fails on the indenture's, and is noticed after the report is final. That event is what the five measures are built around.
The five KPIs that price a CLO compliance programme
The five measures below follow a break from discovery to payment date. Each can be counted from an audit trail without judgement, which matters: a measure that depends on someone's opinion of how hard a month was cannot price a programme. The targets are the sample firm's; set your own from the last twelve months.
Five CLO analytics measures for compliance, defined so they can be counted
| Measure | Definition | Sample October cycle | Target to set |
|---|---|---|---|
| 1. Breaks found | Differences between the trustee's mark and the manager's above the tolerance for that test family, counted per deal and grouped into causes. | 34 breaks in 15 deals; 17 causes | No target on the count; track the share found by recompute rather than by investor or trustee |
| 2. Time to cause | Hours from the draft report's arrival to a confirmed cause, per break that changes a test result. | 76 min to trace the payment-moving cause; queried by 8:57 a.m. | Before the trustee's finalization date, every time |
| 3. Open at finalization | Breaks without a recorded cause when the trustee finalizes the report. | None on the deal that paid 21 October; signed three days before finalization | Zero on coverage tests: CLO Compliance's design target is 100% explained |
| 4. Payment-date exposure | Cash whose destination in the waterfall depends on an open break, in dollars, per deal and payment date. | $583,750 of interest on one deal, until confirmed and queried | Zero open exposure at T-2 before any payment date |
| 5. Rework | Breaks reopened, causes changed after confirmation, revised reports that do not tie out, and fixes to the manager's own data. | One fix to the manager's system (an industry code); three timing breaks to check for reversal next month | Falling quarter on quarter |
Two choices in the table are deliberate. Breaks are counted against a tolerance per test family, not per test, because a 1 basis point difference on a coverage test and a 1 point difference on a diversity score are not the same event; the sample firm's tolerances are 1 basis point for coverage tests, 5 for maximum WARF and 1 basis point for minimum spread. And exposure is measured in dollars, because it is the only unit in which a break on a Class D test and a break on a CCC limit can be compared.
What is a CLO break?
A CLO break is a difference between the trustee's figure and the manager's own figure for a test, a position or a cash line that exceeds the tolerance the manager has set for it. It is not yet an error: a break can come from the trustee, from the manager's own data, from timing across a cut-off, or from a genuine question of interpretation. Classifying it is the work.
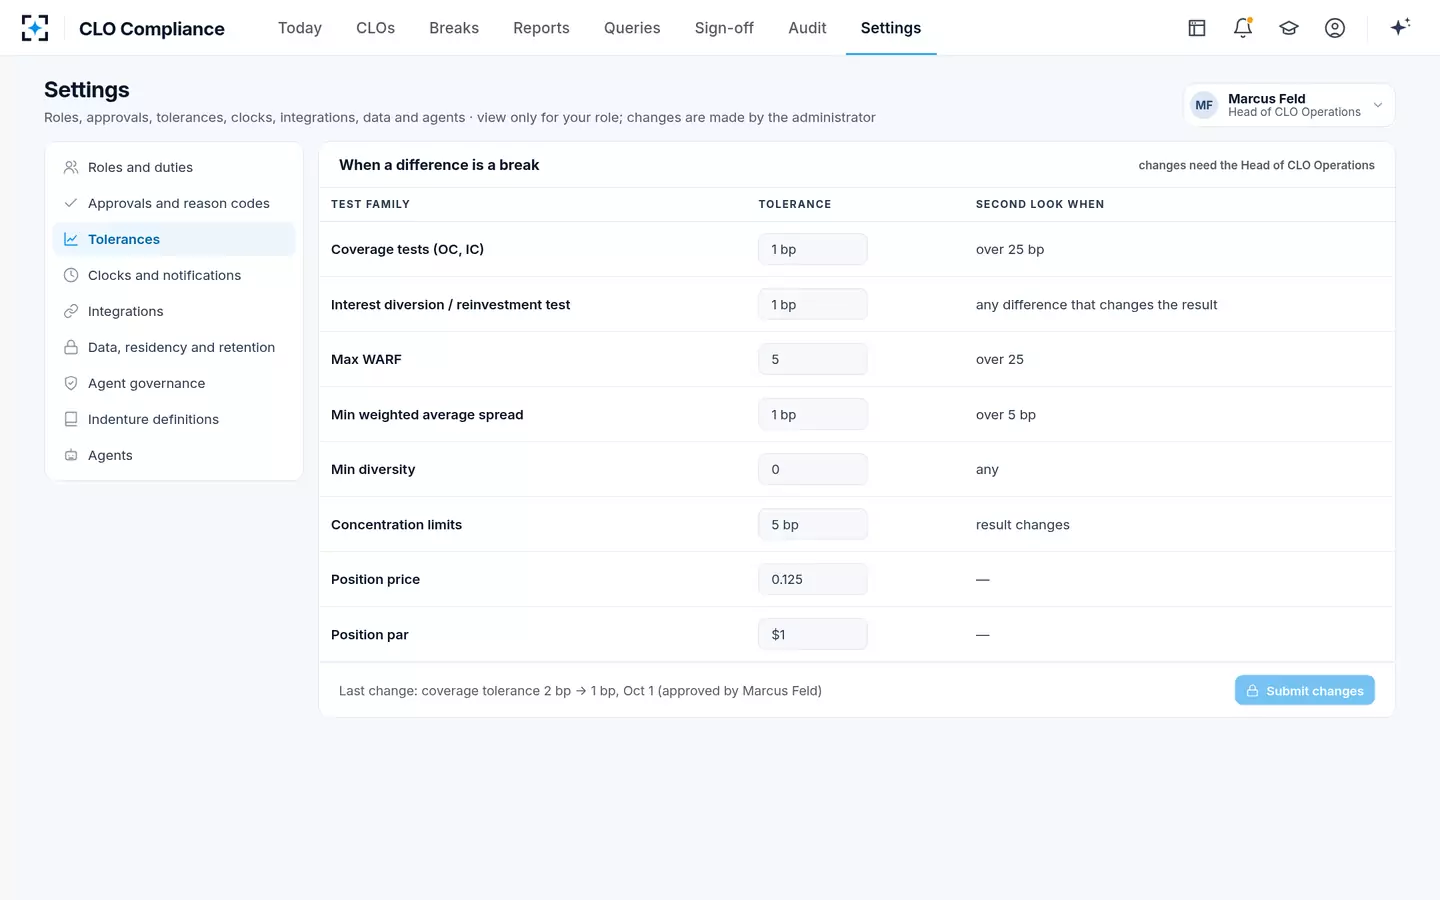
Tolerances should be settings with an owner, not habits. At the sample firm a coverage test difference over 1 basis point is a break and over 25 basis points gets a second look; any difference on the interest diversion test that changes the result gets a second look; position prices within 0.125 and par within $1 are not breaks. Changes need the head of CLO operations' approval, and the last one, on 1 October, tightened the coverage tolerance from 2 basis points to 1.
CLO Compliance's tolerances: when a difference counts as a break, and when it needs a second look
How many breaks per trustee report is normal?
No regulator or independent study publishes a normal rate of breaks per trustee report, and a vendor's figure would depend on its tolerances. The number that is useful is your own, tracked by cause. In the sample cycle, 34 breaks across 15 deals came down to 17 causes, and the causes, not the breaks, are what the team works on.
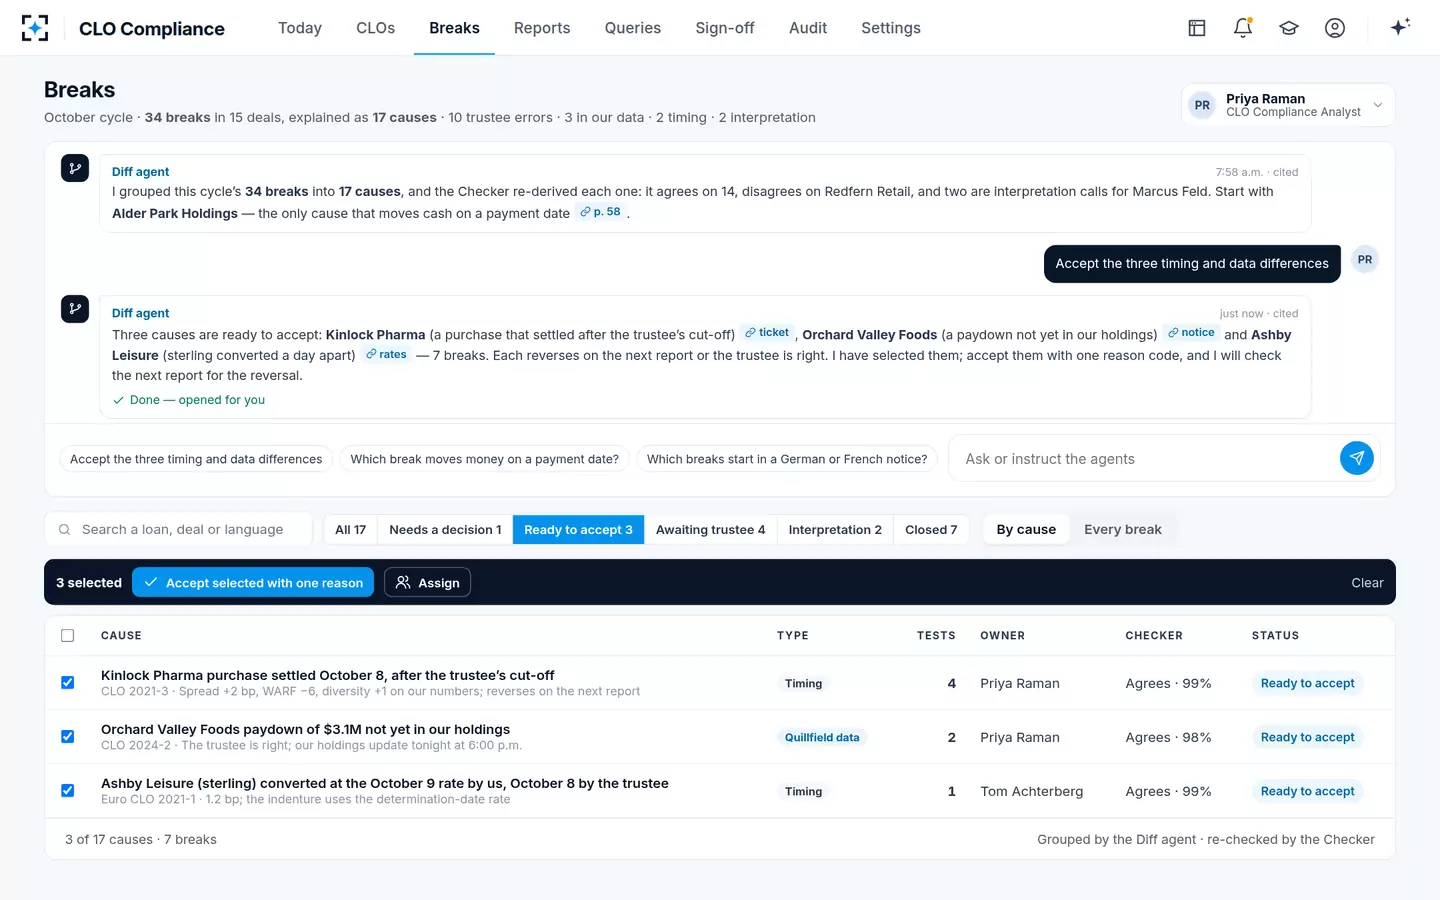
Seventeen causes behind 34 breaks: most were the trustee's, a few were the manager's own
The split says where to spend effort. Ten trustee errors argue for better queries and a scorecard of trustee response times; three of the manager's own data argue for fixing the loan administration system rather than re-explaining the same break each month. Timing causes should reverse by themselves next cycle, and checking that they did is part of rework, not a new break.
Breaks grouped by cause, with an owner and the Checker's verdict on each
What does a missed CLO break cost?
A missed break costs whatever the waterfall paid to the wrong place, plus the effort of correcting it later, if it can be corrected at all. In the sample deal, one loan carried at par instead of at its purchase price meant the interest diversion test passed on the trustee's numbers and failed on the indenture's. On the payment date that is $583,750 of interest that must buy collateral; on the trustee's numbers it would have gone to the subordinated notes, which instead receive $897,550 rather than $1,481,300.
The cost lands on someone different depending on the direction of the error. A test wrongly passed pays the equity and weakens the senior noteholders' protection; a test wrongly failed diverts cash the equity was owed. Either way, once the report is final the trustee pays on it. That is why the third and fourth measures, breaks open at finalization and payment-date exposure, are the ones a head of operations should report upward, and why the days between the draft and finalization are the budget the programme is measured against.
The sample deal's clock: the break is cheap to fix only between draft and finalization
- Determination date to draft9–12 Oct
- Draft to finalization: fix window12–15 Oct
- Finalization to payment date15–21 Oct
How to report CLO compliance to investors and insurers
Report outcomes the investor can verify: for each deal and payment date, whether every test agreed after reconciliation, how many causes were raised with the trustee and resolved, and whether the payment-date waterfall changed as a result. The investors who read most closely are concentrated. US insurers held $276.8 billion of CLOs at year-end 2024 by book value, life insurers 82% of it, and the NAIC estimates insurers held "approximately 25% of total outstanding U.S. BSL CLOs" and "about 39% of outstanding U.S. MM CLOs" (NAIC Capital Markets Bureau, U.S. Insurers' CLO Exposure at Year-End 2024).
Many of those investors are also related to the manager. A 2025 Federal Reserve staff note found that, by the end of 2023, CLOs issued by asset managers affiliated with life insurers held "over $360 billion in broadly syndicated loans and approximately $35 billion in MM loans", about 35 percent and 40 percent of the loans held by CLOs (FEDS Notes, March 2025). When the investor and the manager share a parent, independent evidence of the compliance work matters more, not less.
For European deals the reporting is set by law. The EU Securitisation Regulation requires "quarterly investor reports" containing "all materially relevant data on the credit quality and performance of underlying exposures" and "information on events which trigger changes in the priority of payments" (Regulation (EU) 2017/2402, Article 7). The detailed template fields for tests and triggers are set out in what a CLO trustee report must contain.
What are CLO data providers for, and where do they stop?
CLO data providers supply loan prices, ratings, deal documents and trustee report data in machine-readable form, and a compliance programme depends on them. They stop at the indenture: a price feed tells you the market value of a loan, not whether the deal's definition of market value means the bid or the mid, and a deal database tells you the trustee's reported ratio, not whether it applied the discount obligation definition to the right loans.
The research is candid about how much of the input is soft. For traded loans, the 2019 study notes, fair values come from loan market prices from data providers; for non-traded loans "CLO managers seek bids from usually three independent broker-dealers", and if none can be obtained "CLO managers set the loan fair values themselves". It adds that "CLOs do not report the names of the broker-dealers that provide the loan fair values or whether these values were set by the manager" (Loumioti and Vasvari). A compliance measure that ignores where each price came from is measuring the feed, not the deal.
CLO Compliance uses the manager's own pricing vendor and rating feed as of the determination date and cites each price and rating it used, which is what lets the five measures be audited: every break in the count can be opened to its sources. To see the measures on sample deals, or on a sample of your own past reports, start from CLO Compliance; the controls behind them are in CLO compliance software, recompute then check.
Questions people ask
What KPIs matter in CLO operations?
The ones that follow a break to the payment date: breaks found by cause, time from report to confirmed cause, breaks still open when the trustee finalizes, dollars whose waterfall destination depends on an open break, and rework. Volume measures such as tests run or reports processed describe workload, not control. At the sample firm the payment-moving cause was traced 76 minutes after the report arrived, and queried with the trustee before 9 a.m.
How do you measure CLO reconciliation?
Count every difference above tolerance between the trustee's mark and your own, group the differences into causes, and record when each cause was confirmed and by whom. Then report how many were still open at finalization. The measure is only comparable month to month if the tolerances are settings with a recorded owner and change history.
How fast do trustees answer CLO queries?
It varies by trustee, which is why a scorecard is worth keeping; no public dataset reports it. The sample firm asks for a reply within two business days and escalates an open coverage break three business days before finalization. Recent sample queries were answered in 1.1 and 2.0 days, and one was overdue.
Is CLO analytics the same as CLO modeling?
No. CLO modeling projects a deal's cash flows and tranche payments under scenarios; it is used to price and rate tranches, and the NAIC's financial modelling of CLO tranches for insurers is of this kind. Compliance analytics measures whether the tests the indenture sets were calculated and reported correctly this period. The two use the same inputs, so a definition error hurts both.
Should a CLO manager report break statistics to investors?
Reporting outcomes builds trust: whether every test tied out after reconciliation, and whether any payment changed. Raw break counts can mislead, because they depend on tolerances and data quality. For EU deals, quarterly investor reports must already include data on events that change the priority of payments.