A protocol complexity score is a single number that stands for how much a trial asks of the people who run it and the people who take part in it. Every published version counts roughly the same things — endpoints, eligibility criteria, distinct and total procedures, planned visits and the time each visit takes — and the reason to compute one is almost never curiosity: somebody has been told to make the next protocol lighter and needs a figure to argue with. Clinical Protocol Authoring takes the same idea down one level, scoring each visit in the schedule of assessments as the schedule is built, because the change that actually makes a protocol lighter is usually one procedure moved in one visit, not an endpoint dropped in a committee.
The trial, the drug and the people in the product figures below are invented sample data: VLT-302, a Phase 3 study of Veltrimab in moderate-to-severe plaque psoriasis, written by Lena Ortiz. The research figures come from academic studies and regulators, linked where they appear.
A decade of protocol design, and what grew in it
+27.1%
total endpoints per Phase II and III protocol, 2009–2012 against 2017–2020
+67.3%
total procedures performed per protocol over the same periods
+22.1%
procedures per patient visit — the growth a site feels on the day
What is a protocol complexity score?
A protocol complexity score is a weighted count of a protocol's design characteristics, computed so that two protocols can be compared and so that one protocol can be compared with a benchmark. There is no regulator's formula and no single industry standard. What exists instead is a set of published measures that count the same families of thing: how many endpoints the protocol has, how many eligibility criteria it imposes, how many distinct procedures it names, how many times each is performed, how many visits there are and how long a visit lasts.
The useful distinction is between design complexity and participation burden. Design complexity is about the document and the operation: more endpoints means more data, more monitoring and more ways for a site to get something wrong. Participation burden is about the person in the chair: the minutes, the needles, the questionnaires, the travel and the diet and exercise restrictions. The two correlate, but they are not the same number, and a team that can only quote one of them usually ends up arguing about the wrong thing.
Both are only worth computing if someone can act on the answer. A protocol-level score of 74 against a benchmark of 61 tells a design team that the protocol is heavy. It does not tell them which week to open.
What the published benchmarks actually count
The best-documented benchmarks come from the Tufts Center for the Study of Drug Development, which has gathered protocol design data from sponsor companies for two decades. The variables are deliberately plain. In the 2022 benchmark study they are the number and type of endpoints, the number of eligibility criteria, the number of distinct and total procedures performed, the number of countries and investigative sites, and the number of planned visits — with a derived measure, the share of procedures that are non-core: procedures that support supplemental secondary, tertiary and exploratory endpoints rather than the primary and key secondary efficacy and safety endpoints.
That last measure is the one worth borrowing. Across the sample the study found the proportion of non-core procedures to be remarkably stable between therapeutic areas: "the average proportion of procedures that are non-core (24.1% and 24.9%)" in oncology and non-oncology protocols respectively, alongside comparable means for eligibility criteria (29.8 and 31.0) and distinct procedures (33.3 and 34.3) (Tufts CSDD benchmarks, 2022). Roughly a quarter of everything a protocol asks for is not holding up a primary or key secondary endpoint. That is the budget a design team is really arguing over.
The design characteristics a complexity measure counts, and what each phase averages
| What is counted | Phase I | Phase II | Phase III |
|---|---|---|---|
| Total endpoints | 15.6 | 20.7 | 18.6 |
| Planned visits | 13.5 | 18.3 | 21.1 |
| Procedures per visit | 14.5 | 14.0 | 13.5 |
| Datapoints collected per protocol | 330,420 | 2,091,577 | 3,453,133 |
| Countries | 1.7 | 6.1 | 13.7 |
| Investigative sites | 5.2 | 35.1 | 82.2 |
| Patients screened | 72.0 | 442.5 | 877.8 |
| Patients enrolled | 46.9 | 214.8 | 589.1 |
How heavy is a normal Phase 3 protocol?
Heavier than most teams assume, and heavier than it was. A Phase III protocol in the benchmark sample averages 34.5 distinct procedures performed 266 times in total across about 21 planned visits, in a document of about 116 pages, collecting roughly 3.45 million datapoints. A Phase II protocol carries more endpoints — 20.7 on average, the highest of any phase — because that is where the design is still asking questions.
The direction matters more than the level. Across Phase II and III protocols, total endpoints rose from a mean of 16.6 in 2009–2012 to 21.1 in 2017–2020, a 27.1% increase, while total procedures performed rose 67.3% over the same periods. Procedures grew two and a half times faster than the endpoints that are supposed to justify them.
Total endpoints per Phase II and III protocol, by period
ICH E8(R1), the guideline on general considerations for clinical studies, is unusually direct about where this ends up. "Study designs should be operationally feasible and avoid unnecessary complexity," it says. "Protocols and case report forms/data collection methods should enable the study to be conducted as designed and avoid unnecessary data collection" (ICH E8(R1), adopted 2021). The sentence sits inside the guideline's treatment of critical to quality factors, which is the point: complexity is not a vice in itself, it is a vice when it is not holding up something the trial is for.
How is patient participation burden calculated?
Patient participation burden is calculated by asking patients how burdensome each procedure is, then applying those ratings to the procedures a protocol actually schedules. The best-documented version of this was built by Tufts CSDD with ZS: "In an initial study, a survey was conducted in 2019 among 591 US-based patients who rated the perceived burden of 60 distinct, commonly performed, clinical trial procedures" (Smith et al., multi-company workshop, Therapeutic Innovation & Regulatory Science, 2023). From those ratings, average burden scores were derived for individual procedures by patient subgroup and disease, and combined into an algorithm for a whole protocol.
A second survey of 2,680 global patients added the parts of a trial that are not procedures at all — travel, the location where a procedure is done, diet and exercise restrictions. That mattered: "When non-procedural burden was accounted for, the enhanced algorithm was highly associated with, and predictive of, study conduct and total clinical trial duration (i.e., protocol approval to database lock), screen failure rate, and the number of substantial protocol amendments". The score is not only a measure of kindness. It predicts how the trial will run.
The workshop that followed took eight pharmaceutical companies through scoring 66 completed protocols and then a protocol still in design, and reported one finding a design team should expect to see in its own data: "Comparisons between retrospective and prospective burden scores revealed higher comparative burden in lab and blood procedures."
Why a per-visit score beats a protocol-level score
A protocol-level score is a verdict. A per-visit score is an instruction. The difference shows up the moment someone has to change something: a protocol scored at the document level can only be answered with a design change — drop an endpoint, cut a country, shorten follow-up — while the same protocol scored visit by visit usually turns out to have two or three bad afternoons and nine ordinary ones.
A published participation burden score and a per-visit score: what each one is for
The published algorithm: Patient ratings of 60 commonly performed procedures, gathered by survey, plus non-procedural factors such as travel and lifestyle restrictions.
A per-visit score while the schedule is drawn: The three things a schedule already knows for every visit: minutes on site, millilitres of blood, needle sticks or injections.
The published algorithm: One protocol against a benchmark set of protocols, and a prospective design against the sponsor’s own history.
A per-visit score while the schedule is drawn: One visit against the limit the sponsor set, and against the other ten visits in the same trial.
The published algorithm: When the design is far enough along to be scored, usually as a study in its own right.
A per-visit score while the schedule is drawn: On every edit, including the one made at four o’clock on the day the draft goes out.
The published algorithm: Predicting conduct: duration, screen failure rate and the number of substantial amendments.
A per-visit score while the schedule is drawn: Finding the visit to fix, and proposing the smallest change that fixes it.
The published algorithm: Tell a writer which week to open or which draw to combine.
A per-visit score while the schedule is drawn: Tell a sponsor whether the protocol as a whole is heavier than its peers.
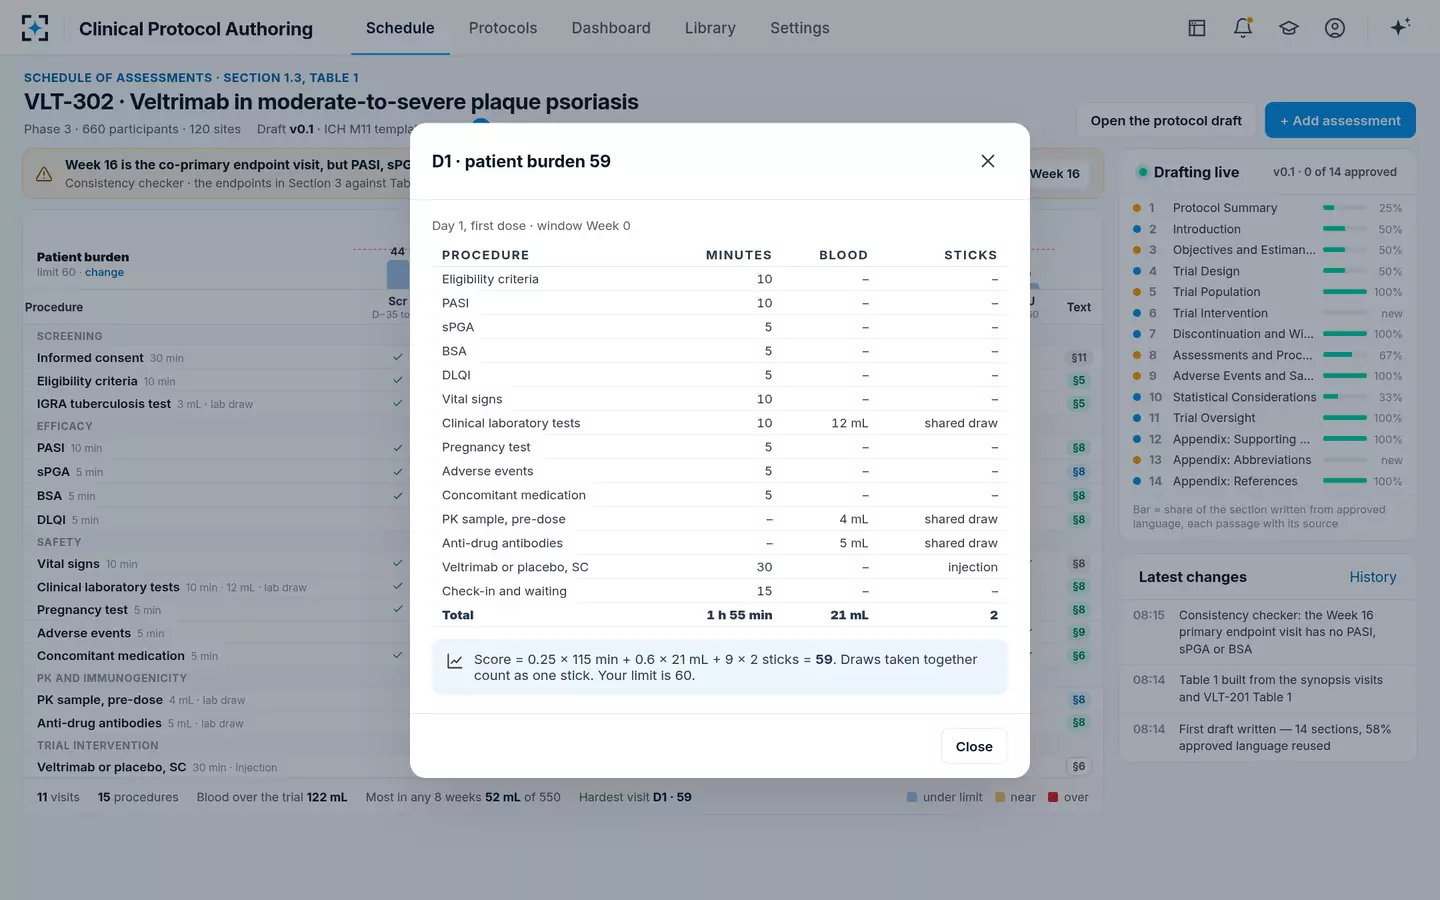
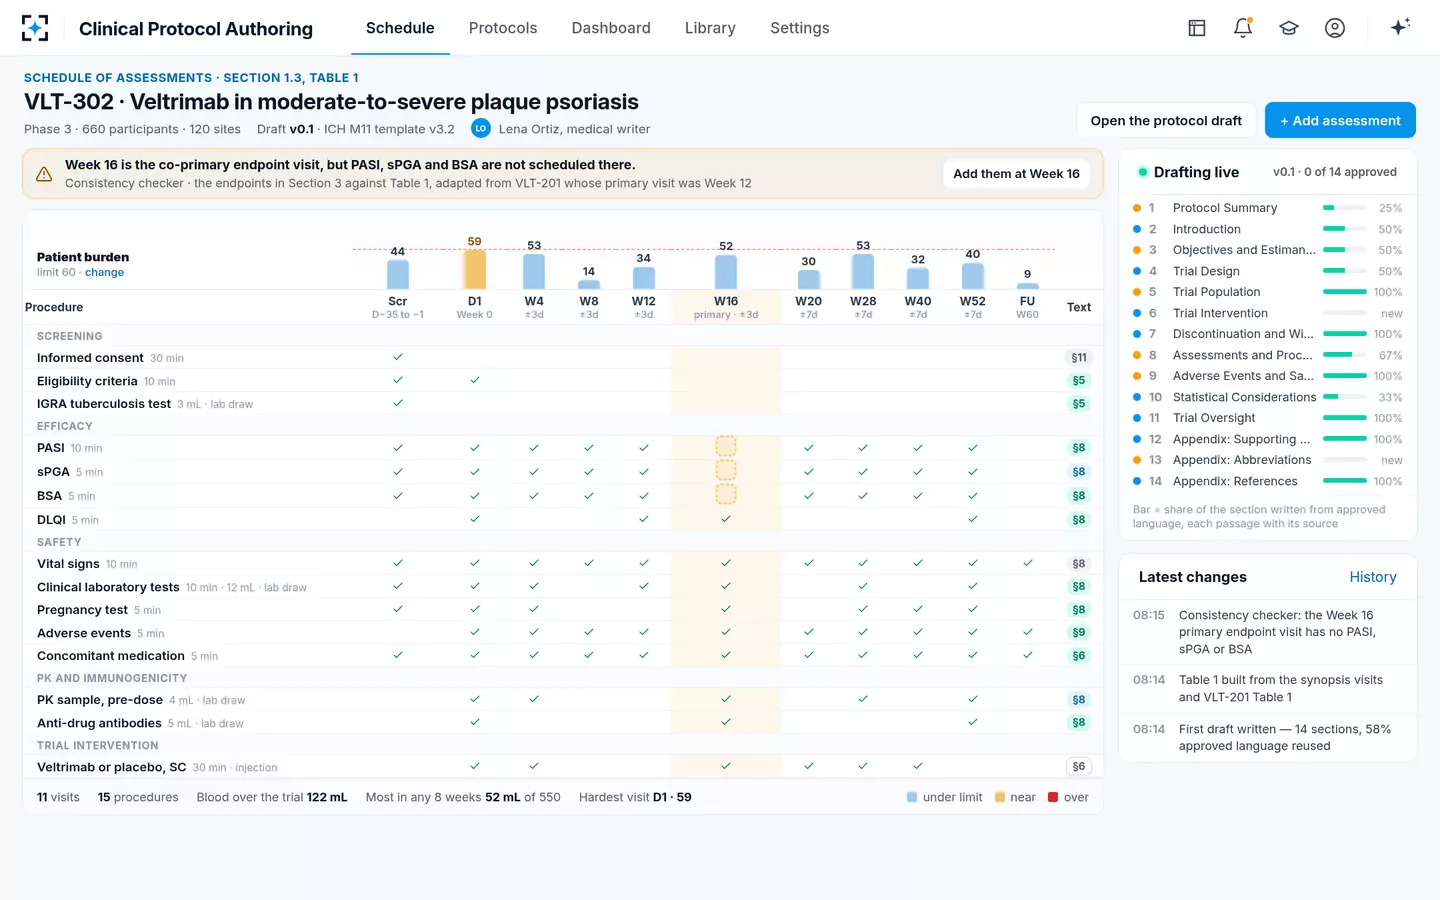
In the sample trial the whole argument is eleven rows long. Day 1 is the hardest visit at 59 against a limit of 60 — eligibility criteria repeated, four efficacy ratings, safety bloods, a pre-dose PK sample, anti-drug antibodies and the first injection, one hour fifty-five minutes on site, 21 mL of blood and two needle sticks. Week 8 scores 14. Nobody would have guessed either number from the document.
One visit's score, with the arithmetic that produced it
Which procedures carry the most burden
The published answer and the arithmetic answer agree, which is reassuring. Tufts CSDD's 2025 analysis of 156 Phase II and III protocols scored between 2011 and 2022 reports that "Procedures contributing most to participation burden include patient questionnaires, lab and blood work and routine procedures conducted at each planned visit" — and, importantly, that the growth is not in the exotic procedures: "A notable increase in the average duration of each visit per protocol was observed in large part due to the volume of procedures performed per visit" (Dirks et al., Therapeutic Innovation & Regulatory Science, 2025). The study also found a growing share of burden coming from procedures that support supplementary, tertiary and exploratory endpoints.
A simple weighting reaches the same conclusion from the other direction. Give a minute on site a quarter of a point, a millilitre of blood six tenths, and a needle stick or injection nine, and the needle dominates any visit where more than one draw is taken separately, while the slow accumulation of five-minute questionnaires dominates the long visits. Those are exactly the two things a schedule can change without touching an endpoint.
The per-visit arithmetic in the sample data, and what each term rewards
Minutes on site
0.25 × minutes
Every procedure’s stated duration, plus check-in and waiting. Day 1: 115 minutes = 28.75.
Cut by combining or moving, not by hurrying
Blood drawn
0.6 × millilitres
Research volumes only. Day 1: 21 mL = 12.6, with the eight-week total held against the sponsor’s limit.
Cut by fewer tubes or a smaller assay volume
Needle sticks
9 × sticks or injections
Draws taken from one venipuncture count once. Day 1: 2 = 18.
Cut by combining draws
The visit score
28.75 + 12.6 + 18 = 59
Against a limit of 60. A visit over the limit is flagged with the smallest change that brings it back.
The writer, or the clinical operations lead
The sample trial's eleven visits, scored while the schedule was still being drawn
| Visit | Window | Score | What the visit holds |
|---|---|---|---|
| Screening | Day −35 to −1 | 44 | Informed consent, eligibility, the tuberculosis test and the first efficacy ratings |
| Day 1 | Week 0 | 59 | The hardest visit: eligibility again, four efficacy ratings, safety bloods, the PK sample, anti-drug antibodies and the first injection |
| Week 4 | ±3 days | 53 | Full efficacy and safety panel, second injection |
| Week 8 | ±3 days | 14 | A light visit: adverse events, concomitant medication, efficacy ratings |
| Week 12 | ±3 days | 34 | Efficacy, safety bloods, DLQI |
| Week 16 | ±3 days · co-primary | 52 | The endpoint visit, scored before the missing PASI, sPGA and BSA were added back — which takes it to 57 |
| Week 20 | ±7 days | 30 | Efficacy and safety, injection |
| Week 28 | ±7 days | 53 | Efficacy, safety bloods, PK sample, anti-drug antibodies, injection |
| Week 40 | ±7 days | 32 | Efficacy, safety, injection |
| Week 52 | ±7 days | 40 | End of treatment: full panel, PK sample, anti-drug antibodies |
| Follow-up | Week 60 | 9 | Adverse events and concomitant medication only |
Then the medical monitor asks for a liver panel at Weeks 2, 4 and 8, and the shape of the problem changes in a way no protocol-level score would show. A new Week 2 visit appears, scoring 26. Week 4 picks up a third needle stick and fifteen more minutes and goes to 70, over the limit. The suggestion is not to drop the liver panel, which a safety request put there: it is to take it from the same venipuncture as the pre-dose PK sample already scheduled that morning. One stick fewer, two more tubes to the central lab, Week 4 back to 57. The eight-week blood total moves from 52 mL to 68 mL, still far inside the limit.
Does complexity really cause amendments?
The evidence is associative rather than causal, and it is consistent. The enhanced burden algorithm was "highly associated with, and predictive of" total trial duration, screen failure rate and the number of substantial protocol amendments. The 2022 benchmark paper summarises earlier research in which protocols with more endpoints, eligibility criteria and procedures were associated with lower physician referral rates, diminished volunteer willingness to participate, lower recruitment and retention, and a higher incidence of deviations and substantial amendments.
A sceptical reading is fair: heavy protocols are written for hard questions, and hard questions are also what cause amendments. But the mechanism is easy to see at the desk. A schedule adapted from an earlier study inherits its visit structure, and a primary endpoint moved from Week 12 to Week 16 leaves a visit without the ratings it exists for. That is an inconsistency, not complexity — but it is born at the same moment, in the same table, and it comes back as an amendment. Which changes count as amendments, and what each one costs, follows that sequence to its end.
What to cut first, and what you may never cut
Start with the quarter of the protocol that is not holding up a primary or key secondary endpoint. The non-core share in the benchmark data is roughly 24% of all procedures, and a growing part of measured burden comes from procedures supporting supplementary, tertiary and exploratory endpoints. Those are the candidates. An assessment that a primary or key secondary endpoint depends on, or that a safety rule requires, is not a candidate at any score — and a scoring tool that is allowed to propose dropping one is a tool that will eventually propose it on a Friday.
Nine moves that lighten a visit without touching an endpoint
- Combine draws taken on the same morning
Three research tubes from one venipuncture is one stick, not three. In the sample trial this is the whole difference between 70 and 57 at Week 4.
- Move a procedure to an adjacent visit
If a window allows ±7 days, an assessment that is not time-critical can sit in the lighter week next door.
- Use a local laboratory or a local collection
Removes travel and waiting without removing the measurement. Non-procedural burden, travel included, is measurable and predicts how a trial runs.
- Cut the assay volume, not the assay
Check whether a panel's specified volume is set by the method or simply carried over from an earlier protocol.
- Delete a questionnaire that nobody analyses
Patient questionnaires are among the largest contributors to measured burden, and exploratory instruments accumulate quietly.
- Stop repeating eligibility assessments
A test done at screening rarely needs repeating at Day 1 unless the window is long or the result can change.
- Widen a window instead of adding a visit
ICH E6(R3) notes that acceptable ranges in the protocol reduce deviations; they also reduce travel.
- Fold a visit into a remote contact
Adverse events and concomitant medication at a light follow-up week rarely need the patient in a chair.
- Check the eight-week blood total, not just the visit
A schedule can keep every visit under the limit and still breach a cumulative volume limit; the sample trial runs at 68 mL against 550.
Where a burden score lives: over the schedule, as it is drawn
Making the arithmetic visible so a clinician can argue with it
A score that cannot be taken apart will not survive its first disagreement. A medical monitor who asked for a liver panel and is handed a number saying the visit is now too heavy will, quite rightly, want to know what the number is made of and which part of it is theirs. If the answer is a model, the conversation is over and the panel stays where it was put.
So the arithmetic has to be on the screen: these minutes, these millilitres, these sticks, these weights, this limit. Every term should be a setting the sponsor owns rather than a constant the tool believes in, because a sponsor running paediatric trials and a sponsor running oncology trials will not agree on what a needle costs. And the weights should be stated as what they are — one sponsor's instrument — and never dressed up as the published algorithm, which is built from patient ratings and measures something broader.
The last rule is about who decides. In the sample trial the scorer proposes the smallest change and names the two people who may accept it: the medical writer or the clinical operations lead. It never applies a suggestion, and it never offers one that removes an assessment an endpoint or a safety rule depends on. That is the difference between a tool that makes a protocol lighter and a tool that makes it wrong, and it is worth writing into the specification before anybody writes a weight. How much blood a trial may take, and where the limits come from, covers the one term in the formula that has rules of its own.
Complexity across a portfolio, not one protocol
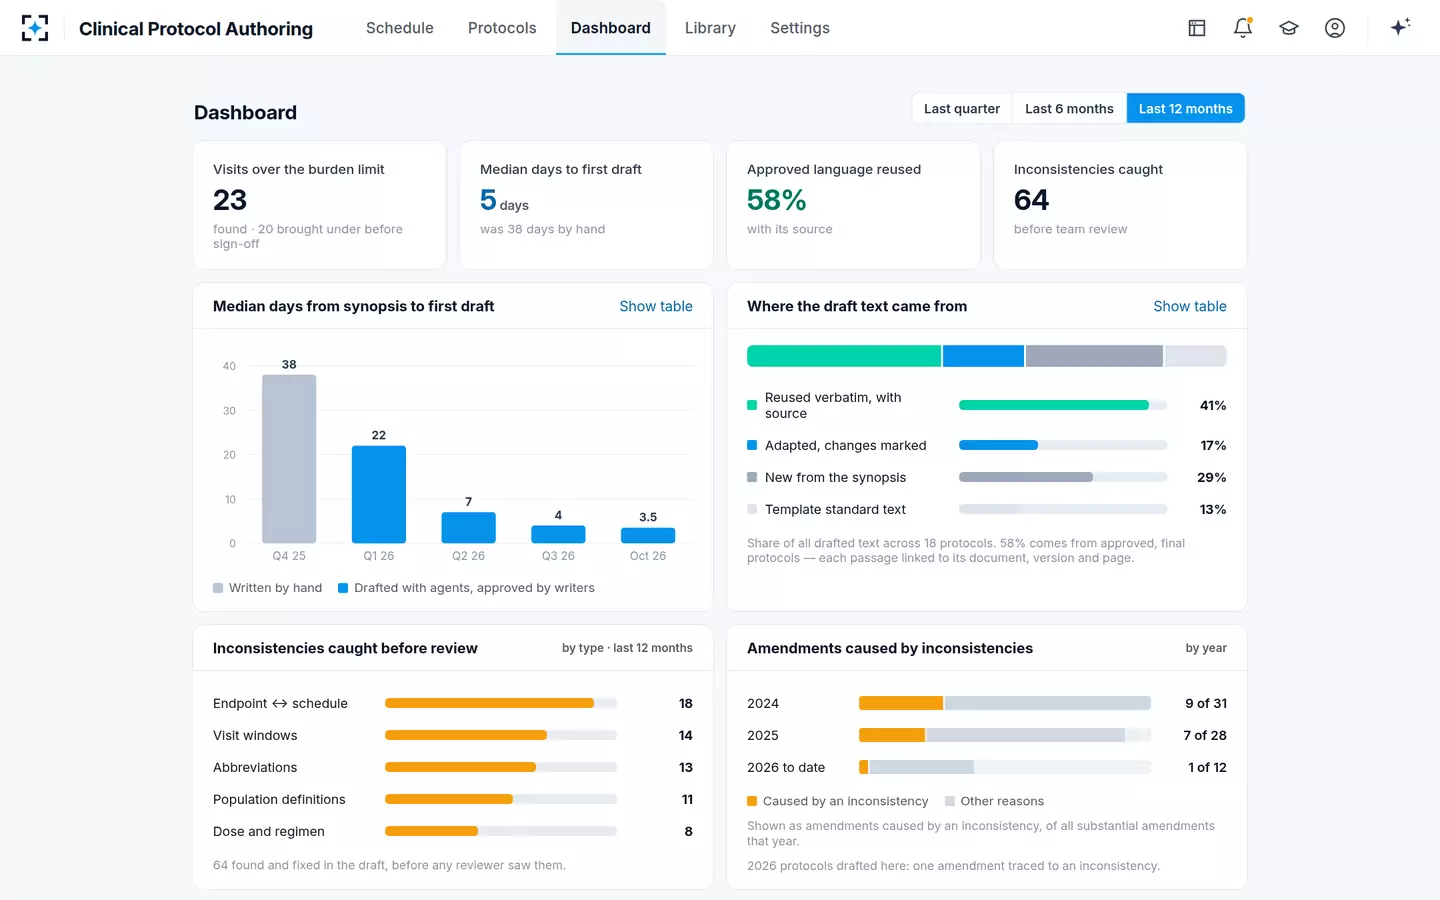
Scored early enough, complexity is a design conversation. Scored late, it is a site complaint after two hundred people have enrolled. To see the schedule, the scores and the arithmetic together, start from Clinical Protocol Authoring.
Questions people ask
What is a good protocol complexity score?
There is no published threshold, because the scales differ. The honest comparison is against your own protocols in the same phase and therapeutic area, and against the published benchmark means — about 34.5 distinct procedures and 266 total procedures for a Phase III protocol, in roughly 116 pages. A score only becomes useful when it is attached to a specific thing you could change.
How many endpoints should a Phase 3 protocol have?
The benchmark mean is 18.6 for Phase III and 20.7 for Phase II, counting all endpoints including secondary and exploratory. That is a description, not a target. The number that matters more is how many procedures each endpoint brings with it, because total procedures grew 67.3% across the decade while endpoints grew 27.1%.
What counts as a non-core procedure?
A procedure that supports only supplemental secondary, tertiary or exploratory endpoints, rather than the primary and key secondary efficacy and safety endpoints. In the Tufts CSDD benchmark sample they make up about a quarter of all procedures performed — 24.1% in oncology protocols and 24.9% in non-oncology — and that proportion has been rising. They are the first place to look when a protocol has to get lighter.
Does patient burden affect how a trial performs?
The published evidence says yes. When non-procedural factors such as travel and lifestyle restrictions were added to the burden algorithm, it became predictive of total trial duration from protocol approval to database lock, of screen failure rate, and of the number of substantial amendments a protocol went on to need.
Can you score patient burden before the protocol is written?
You can score it as soon as the schedule of assessments exists, which is normally well before the prose. A schedule carries the three inputs a per-visit score needs — the procedures, their durations and their blood volumes — so the score can be computed on the first draft of the table and recomputed on every edit after it.
Who should decide to accept a burden reduction?
A named person, and the name should be in the specification. In the sample trial it is the medical writer or the clinical operations lead, and the suggestion is never applied on its own. The reason is simple: only a person can tell whether a change that looks like moving a draw actually changes what the trial can conclude.