An enrichment strategy for a clinical trial selects a subset of patients in whom a drug's effect can be shown more readily, and it is one of the biggest levers a development team has on sample size. It is also the decision whose cost is most often underestimated, because the statistics are worked out in a protocol and the price is paid in the screening clinic: in candidates who fail the entry test, in confirmatory scans, and in the months it takes to fill a study. Biomarker Strategy Planning sits at that join — it holds the marker, the test that implements the selection, the date that test will be ready, and the arithmetic of what each option costs in scans, money and enrolment weeks.
The published figures on this page come from FDA's enrichment guidance and from peer-reviewed work on screening for amyloid pathology; they are linked where they appear. The programme examples come from the fictional sample data the solution ships with, and are labelled as the solution's own estimates.
What one screening design cost, and what a cheaper first test modelled
4,486scans
amyloid PET scans across 67 sites over 3.8 years to identify 1,323 eligible participants
2.8 yr· $2.9M
modelled enrolment time and screening cost for scanning every candidate
1.4 yr· $2.2M
for the same enrolment with a blood test before the scan — 49% faster, 25% cheaper
What is an enrichment strategy in a clinical trial?
It is the deliberate selection of a study population in which a treatment effect is easier to detect. FDA's guidance describes sponsors using "a variety of strategies to enrich the study population by selecting a subset of patients in which the potential effect of a drug can more readily be demonstrated", and groups them into three broad categories (FDA, Enrichment Strategies for Clinical Trials, March 2019). The three are worth keeping distinct, because they work through different mechanisms and fail in different ways.
The three kinds, and which one your marker is for
Strategies to decrease variability narrow who is admitted so the measurement is less noisy — patients whose baseline sits in a narrow range, excluding those whose symptoms improve spontaneously or whose measurements swing. Prognostic enrichment selects patients more likely to have the endpoint event. Predictive enrichment selects patients more likely to respond to this particular drug. The first raises power by shrinking the denominator of variability; the second by raising the event rate; the third by raising the effect itself.
Three categories, one sentence each, and what each one buys
| Category | Who is selected | What it does to the result | What it costs |
|---|---|---|---|
| Decreasing variability | Patients with baseline measurements in a narrow range; those with spontaneously improving or highly variable disease are excluded. | Increases study power by reducing interpatient and intrapatient variability. | Narrower entry criteria, so slower recruitment, and a population less like the one in clinic. |
| Prognostic enrichment | Patients with a greater likelihood of a disease-related endpoint event, or of substantial worsening. | Increases the absolute effect difference between groups; the relative effect is not expected to change. | A sicker population, which can change the safety picture and the tolerability of the drug. |
| Predictive enrichment | Patients more likely to respond to this drug than other patients with the condition. | Can increase the effect size in both absolute and relative terms, permitting a smaller study population. | A test to implement it, a cut-off to defend, and a question about everyone the test excludes. |
Prognostic enrichment changes the absolute effect, not the relative one
The distinction in that third column is the one most often blurred in a protocol discussion, and it has a direct consequence for how a result can be described. Prognostic enrichment, in the guidance's words, selects patients "with a greater likelihood of having a disease-related endpoint event (for event-driven studies) or a substantial worsening in condition (for continuous measurement endpoints)", and these strategies "would increase the absolute effect difference between groups but would not be expected to alter relative effect."
Put concretely: if a drug reduces events by a quarter, selecting patients whose event rate is 20% rather than 5% does not make the drug work better. It makes the same relative reduction land on more events, so fewer patients are needed to see it. The risk ratio you report should be about the same; the absolute benefit will look larger, and so will the number of adverse events, because you have deliberately enrolled a sicker population.
Predictive enrichment is a different claim. It asserts that the drug works better in these patients — a treatment-by-marker interaction — and it is the claim that eventually shows up in a label. It is also the claim that requires the test to exist.
Predictive enrichment and the sixteen-times table
The guidance's own table is the part worth knowing by heart. It compares the sample size needed in an unselected population with the sample size needed if only marker-positive patients are studied, at four prevalences and two assumptions about the effect in marker-negative patients.
Sample size ratios: unselected population against marker-positive only
| Prevalence of marker-positive patients | No treatment effect in marker-negative patients | Half the effect in marker-negative patients |
|---|---|---|
| 100% | 1.0 | 1.0 |
| 75% | 1.8 | 1.3 |
| 50% | 4 | 1.8 |
| 25% | 16 | 2.6 |
Read the two columns together, because the second is the one that disciplines the argument. The sixteen-fold saving depends entirely on the assumption that the drug does nothing at all in marker-negative patients. Allow it half the effect and the same 25% prevalence gives a ratio of 2.6 — still worth having, but a different conversation about whether to exclude three-quarters of the patients with the disease.
The assumption in that table that no trial meets
One sentence sits beside the table and is easy to leave behind when the table is quoted: "Table 1 assumes the classification of patients into positive versus negative is 100% accurate."
No test is. A screening test with 82% sensitivity misses almost one marker-positive patient in five, and each one is a patient whose response would have counted toward the effect. Imperfect specificity does the opposite: it admits marker-negative patients, diluting the effect the enriched design was meant to concentrate. The direction of the error depends on which way the cut-off is set, which is why the cut-off is a design decision and not a laboratory one.
Where the screening test's sensitivity and specificity actually land
FDA puts the trade-off plainly: "For predictive enrichment, a screening measurement of a biomarker with both high sensitivity and specificity for identifying responders is also desirable. A screening measurement cut-off can be set to cast a wide net, i.e., with high sensitivity giving a high probability of identifying and treating patients who are more likely to respond to the treatment (higher sensitivity), at the risk of also treating more nonresponder patients (lower specificity)."
What that looks like in real numbers is worth having in front of you. A meta-analysis of plasma phosphorylated tau 217 for detecting amyloid pathology reports an SROC "AUC of 0.91 and sensitivity of 0.82 (95% CI: 0.79–0.84)" for predicting amyloid PET positivity (Khalafi et al., Alzheimer's & Dementia 21(2), 2025). That is a strong blood test by any standard, and it still means that at a cut-off chosen for balance, roughly one in five positive patients is not identified. A design that treats the pre-screen as a filter rather than as the decision — screen with the blood test, confirm with imaging — converts that miss rate into a tolerable loss; a design that uses it alone converts it into an enrolment shortfall nobody planned for.
Prognostic and predictive enrichment, row by row
Prognostic: Likelihood of the endpoint event, whatever the treatment.
Predictive: Likelihood of responding to this drug in particular.
Prognostic: The absolute effect difference. The relative effect is not expected to change.
Predictive: Both absolute and relative effect can increase, permitting a smaller study population.
Prognostic: Event rates by marker status in an untreated or standard-of-care population.
Predictive: An interaction between marker status and treatment effect — a correlation with outcome is not enough.
Prognostic: Dilutes the event rate, so the study is underpowered in the ordinary way.
Predictive: Dilutes the treatment effect itself, which is harder to see coming and harder to rescue.
Prognostic: Usually nothing: the marker described the population studied.
Predictive: Often a described population, and sometimes a test that has to be available in practice.
Prognostic: An interim analysis for sample size re-estimation, where the marker fails to identify fast progressors.
Predictive: Analytical validity of the test, which the guidance calls critical where the test would be used in practice.
What does enrichment cost in screen failures, scans and months?
The honest answer is that it depends on the test, and that the number is usually knowable in advance. The A4 prevention trial's published record is the clearest illustration available: the trial "performed 4,486 amyloid PET scans across 67 sites over the course of 3.8 years in order to identify 1,323 amyloid PET positive participants" (Schindler et al., 2023). More than three scans per eligible participant, each one a clinic visit, a tracer dose and a slot on a scanner.
The same paper models what a cheaper first test would have done: "the traditional screening approach (approach A) would take 2.8 years and cost $2.9 million. In contrast, performing an AD blood test prior to the amyloid PET scan (approach B) would reduce the time for enrollment by 49% to 1.4 years and reduce the financial cost by 25% to $2.2 million." And it adds a finding that should temper any argument built on assay performance alone: "Improvements in AD blood test accuracy over currently available tests only marginally increased savings." The lever is having a cheap first test at all, not having the best one.
Where the candidates go, with and without a first test
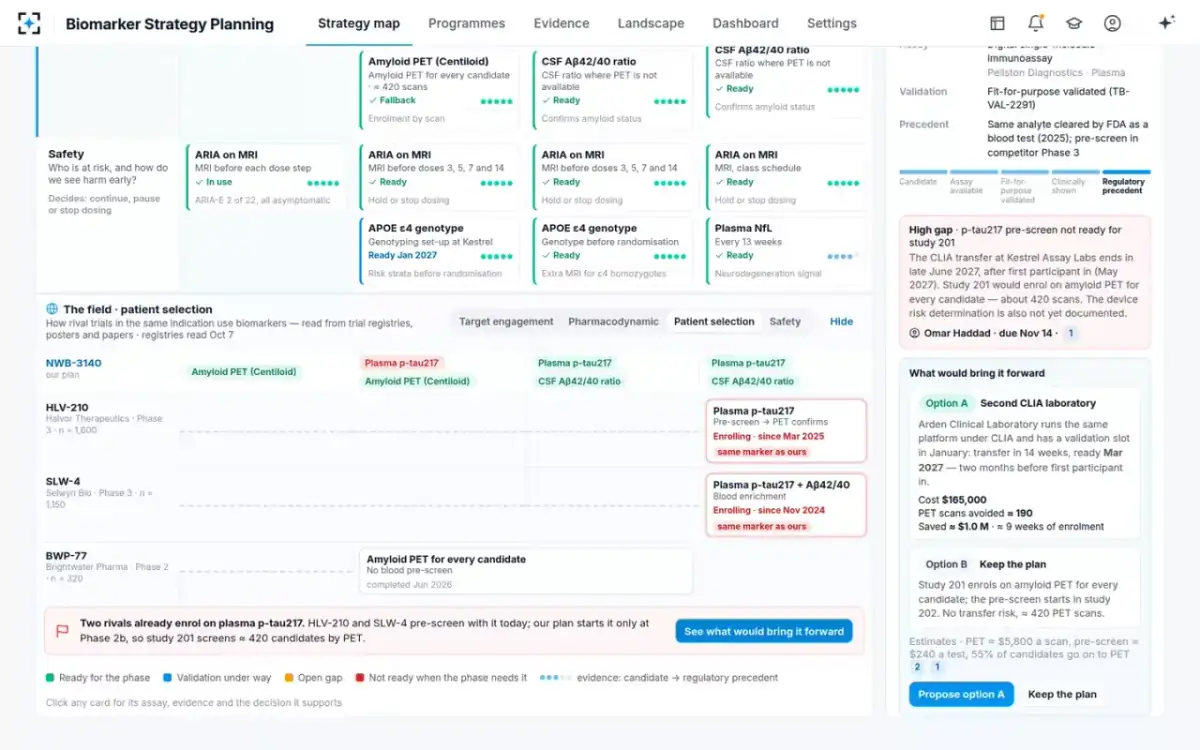
Study 201 as the plan reads: image every candidate
- Imaged · 100%
Study 201 with the pre-screen in place
- Blood test only, no scan · 45%
- Imaged after a positive pre-screen · 55%
The pre-screen-then-confirm design, and the grey zone it creates
Two tests in series solve the cost problem and create a new one: the patients whose first result sits near the cut-off. Set one threshold and every borderline patient is forced into a binary call that the test cannot really support. One answer now studied in the literature is to set two thresholds and name the band between them, so that borderline patients are routed to the confirmatory test rather than classified by the screening one. A 2026 analysis of plasma p-tau217 as a pre-screen before tau PET reports that "a two-cutoff approach substantially reduces gray-zone classifications, supporting p-tau217 as a primary screening tool before confirmatory imaging" (Abtahi et al., Scientific Reports, 2026).
Three things follow for a protocol. The grey zone has to be named and sized before the study opens, because it determines how many confirmatory slots are needed. Someone has to decide what happens to a patient who sits in it and declines the confirmatory test. And the cut-offs belong to the platform they were derived on, so moving the assay moves the band — which is why a laboratory transfer mid-study is a design change, not an operational one.
Two options, costed, with the estimates visible
Generalisability: what you owe the label and the reviewer
Every enrichment design buys power by narrowing the population, and the bill arrives when someone asks who the result applies to. FDA names the concern first among the issues it raises.
The principal concerns with the use of enrichment strategies relate to the generalizability and applicability of the study results. When considering use of an enrichment design, sponsors should consider whether the enrichment strategy could be used in practice to identify the patients to whom the drug should be given and whether the drug might be useful in a broader population.
FDA, Enrichment Strategies for Clinical Trials to Support Determination of Effectiveness, March 2019
There is also a reporting duty that costs nothing and is easy to skip. The guidance asks that the selection be described and its effect assessed: "if only half of the patients screened passed the entry test, that should be noted, and the effect of this selection in terms of the expected response rate in the overall population and on the generalizability of the results should be evaluated." A study that cannot say what fraction of screened candidates it admitted has lost a number it will be asked for.
The second clause of the pull quote is the one that converts a design choice into a regulatory project. If the enrichment strategy would be used in practice to identify who should receive the drug, the test stops being a trial tool. The guidance is explicit about what then matters: "When enrichment depends on a proteomic or genetic biomarker, particularly if a test for the biomarker is intended for use in practice to identify patients to be treated, the analytical validity of the test is critical."
Timing: the enrichment test has to exist before the study starts
All of the above assumes the test is available on the day the first site opens. When it is not, an enrichment design does not fail loudly; it reverts. The study keeps its eligibility criterion and implements it with whatever is already validated, which in practice means the slowest and most expensive option — the confirmatory test used on everybody.
That reversion is invisible in a milestone report and expensive in the clinic, which is why the readiness date of an enrichment assay belongs in the study design discussion and not only in the laboratory plan. The chain behind the date is long — method transfer, validation, site qualification, a central laboratory contract — and it runs in series. What a fit-for-purpose validation package actually contains sets out what sits inside it.
Seven questions to answer before a protocol commits to enrichment
- Which of the three strategies is this, in one word?
Decreasing variability, prognostic or predictive. The evidence you owe differs for each, and so does what the result can claim.
- What is the marker prevalence in the population you will actually recruit?
The sample-size saving is driven by prevalence; a figure taken from a different care setting will not hold at your sites.
- What do you believe the effect is in marker-negative patients?
Zero and half give very different ratios. Write the assumption down, because the design rests on it.
- What are the test’s sensitivity and specificity at the cut-off you will use?
Not the headline AUC. The operating point you choose is what determines who is enrolled.
- Where is the grey zone, and who pays for it?
Size the band between the two cut-offs, and decide in advance what happens to a patient inside it.
- What fraction of screened candidates will pass?
You will be asked to report it. Estimating it in advance also tells you how many screening visits to fund.
- Will the test be ready before first participant in?
Count backwards through validation, transfer and site qualification. If the answer is no, the design silently becomes the expensive one.
Where Biomarker Strategy Planning fits in an enrichment decision
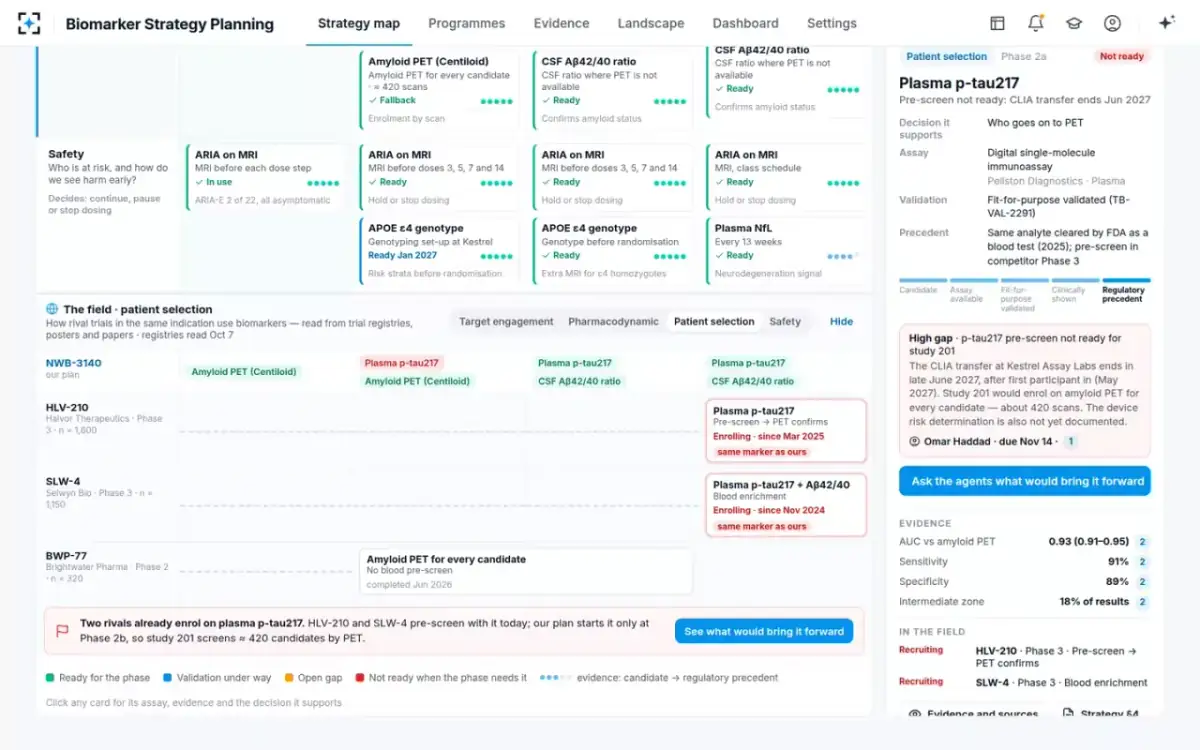
Biomarker Strategy Planning does not design studies. What it does is hold the four facts an enrichment decision needs in one place and keep them current: what the marker's published performance is, with every figure cited to its passage; how rival programmes in the same indication select their patients, read from public registry records and congress material; whether the assay that implements the selection will be validated and transferred in time for first participant in; and what each option costs in scans, money and enrolment weeks, with the estimate basis shown.
The costing is explicitly a proposal rather than a decision. In the fictional sample programme, the reviewer puts up two routes — a second laboratory at a stated cost against keeping the plan and imaging every candidate — and the option stays a proposal until the diagnostics lead decides. To see the field comparison, the costed options and the assay plan together, start from Biomarker Strategy Planning, or read how the whole strategy is organised around decisions like this one.
How rival programmes in the same indication select their patients
Questions people ask
How much smaller can an enriched trial be?
At the limit, a great deal: FDA's table gives a sixteen-fold ratio at 25% marker prevalence when no effect is expected in marker-negative patients. But the same table gives 2.6 at the same prevalence if marker-negative patients get half the effect, and it assumes classification is perfectly accurate. A realistic planning figure sits below the headline, and the gap between them is almost entirely the screening test's accuracy and the assumption about non-responders.
What is a screen failure rate, and what drives it?
It is the share of screened candidates who do not enrol. In a biomarker-enriched study the dominant driver is marker prevalence in the population being approached, followed by the test's operating point and then by the ordinary eligibility criteria. The A4 trial's published record — 4,486 scans to find 1,323 eligible participants — is roughly a 70% failure rate at the confirmatory step alone, before any other criterion.
Does enrichment hurt the generalisability of the result?
It narrows it by design, which is not the same as hurting it, provided the narrowing is described. FDA's guidance names generalisability as the principal concern and asks sponsors to consider whether the strategy could be used in practice to identify patients, and whether the drug might be useful more broadly. The reportable detail is the share of screened patients who passed the entry test, and what that implies for the response rate in the wider population.
When should you study marker-negative patients too?
When you do not yet know that the effect is confined to marker-positive patients, and when the label you want would otherwise be narrower than the biology. Enrolling a marker-negative stratum costs sample size but produces the interaction evidence that a predictive claim needs. The alternative — excluding them and asserting the interaction — leaves a reviewer free to ask for the data that would have settled it.
How do you choose the cut-off for an enrichment test?
From the consequence of each kind of error, not from the ROC curve. A cut-off set for high sensitivity casts a wide net and admits more non-responders; one set for high specificity protects the effect size and loses eligible patients. Where a confirmatory test exists, two cut-offs with a named grey zone routed to confirmation is usually better than one, and it is the design the recent screening literature supports. Whichever is chosen, the cut-off belongs to the platform it was set on.
What does it cost to screen with imaging instead of a blood test?
In the modelled comparison published for an amyloid trial, scanning every candidate took 2.8 years and $2.9 million, against 1.4 years and $2.2 million when a blood test came first — 49% less time and 25% less money. Those are modelled figures for a specific design, not a general rate, but the shape of the finding travels: a cheap first test mostly buys time, and the saving comes from avoided confirmatory tests rather than from the accuracy of the screen.