Risk-adjusted NPV, or rNPV, is a net present value in which every future cash flow is multiplied by the probability that it ever happens. A biotech asset is worth modelling this way because it will probably fail: on the most-cited estimate, 13.8% of programmes entering Phase 1 reach approval, so a model that discounts a successful launch at a venture-style rate and a model that prices the launch at its real odds are answering different questions. Diligence is what makes the probability specific to one asset rather than to a population, and every genuine finding lands in exactly one of four inputs — the cash flows, when they arrive, how likely they are, and what they cost to pursue. Botminds' BD Search & Evaluation reads a seller's room into cited memos and carries each finding into the input it belongs in, so the valuation on the recommendation can be argued with line by line.
The worked example is one fictional deal in the solution: Northwind Bio valuing HZ-2301, an oral IL-23 receptor antagonist peptide for plaque psoriasis, before and after reading Hezhen Pharma's 214-file data room. The companies, people and figures about the deal are sample data; the published research is real and linked where it appears.
The published numbers a biotech valuation leans on
$985M
median capitalised research and development investment to bring one new drug to market
2009-2018, 63 agents from 47 companies, counting failed trials
10.5%
real cost of capital at which that estimate capitalises spending
the required rate of return for an investor, in the same study
$2.77B
median for antineoplastic and immunomodulating agents, the most expensive group
$89B
industry research and development spending in 2014, up from $82 billion in 2008
worldwide, company-reported, in 2015 dollars
What risk-adjusted NPV is, and why licensing uses it instead of DCF
A discounted cash flow model answers the question "what is this stream of money worth today?" An rNPV answers "what is this stream of money worth today, given that most of it will never exist?" The difference is where the risk is carried. A DCF carries it in the discount rate, by demanding a high return. An rNPV carries it in the cash flows themselves, by multiplying each one by the probability that the programme has survived to produce it, and then discounting what is left at a rate closer to the cost of capital.
Licensing prefers the second because the risk in a development asset is lumpy, not smooth. A single Phase 3 readout can remove 100% of the value on one day. A discount rate expresses risk as a steady annual haircut, which is a poor description of an event that either happens or does not. An rNPV also forces a team to write its assumptions where a committee can see them: the probability is a number on the page, not a premium buried in a rate.
The same asset, valued two ways, and what each implies for an offer
Discounted cash flow: In the discount rate: one high rate applied to every year
Risk-adjusted NPV: In the cash flows: each one multiplied by the probability the programme reaches it
Discounted cash flow: A smooth annual haircut on a launch that is treated as certain
Risk-adjusted NPV: A small probability on a large launch, and a large probability on the next study’s cost
Discounted cash flow: The rate, which is one number covering several different risks
Risk-adjusted NPV: Each probability, each date and each cost, separately
Discounted cash flow: Understates the chance of total loss; overstates the value of distant cash flows
Risk-adjusted NPV: Invites double-counting: a high rate and a low probability applied to the same risk
Discounted cash flow: A single value, hard to turn into conditions
Risk-adjusted NPV: A value plus a list of what would change it — which is what becomes conditions and milestones
How is rNPV calculated?
In four steps. Build the cash flows a successful asset would produce and the costs of getting there. Attach to each one the probability that the programme reaches the point where that flow occurs. Multiply. Then discount the risk-adjusted flows back to today at a real cost of capital rather than a venture rate.
rNPV as four terms, worked on one asset in diligence
The cash flows
Peak sales, ramp, erosion
What the asset earns if it launches: the shape matters more than the peak, because an extra year of exclusivity is worth more than a higher peak.
The commercial seat
The probability
PTRS at each step
The chance the programme reaches the point where that flow occurs. On this asset, 16% before the room was read and 13% after.
The clinical and regulatory seats
The timing
When each flow lands
First launch moved from 2031 to the first half of 2032 on this asset. Six months of delay costs about 5% of present value at a 10.5% real rate.
The regulatory seat
The costs
Development spend, risk-adjusted
Including the studies the buyer inherits: a comparability study and a bridging toxicology study of about six months.
The CMC seat
Two conventions are worth fixing before a model is built, because changing them later makes every comparison invalid. Decide whether costs are risk-adjusted as well as revenues — they should be, since a programme that dies does not spend the next phase's budget either. And decide at which point probability is applied: at the start of each phase, or to the whole chain from today. Teams that mix the two produce valuations that cannot be compared across a shortlist.
The four inputs, and which one each diligence finding moves
The discipline that makes diligence pay is routing. Every finding from the six function memos is assigned to one of the four inputs, and a finding that cannot be routed is either an open question or a worry. On this deal, each of the three material findings landed in a different input, which is why the value moved as much as it did.
One asset's model, before and after the data room was read
| Input | On public sources | After diligence | The finding that moved it |
|---|---|---|---|
| Probability of technical and regulatory success | 16% | 13% | The two manufacturing findings, read as a risk that the bridging work does not come out clean before the next trial |
| First launch | 2031 | First half of 2032 | A comparability study and a bridging toxicology study of about six months, both ahead of the next trial |
| Development cost | The programme in the seller’s plan | Plus two inherited studies | RF-41, no comparability data after the route change; RF-42, a D-arginine epimer at up to 0.31% in the new lots |
| Cash flows | Differentiation 52; outside the thesis zone | Differentiation 81; strategic fit 89 | Dosing with or without food, at a fed-to-fasted exposure ratio of 0.94, against two competitors dosed on an empty stomach |
| Risk-adjusted value | $0.74B | $0.55B | The three above, compounding: probability, then timing, then cost |
Notice what the routing exposes. The best news in the room — a genuine dosing advantage over the competition — raised the cash flows, and the value still fell by a quarter. A team that reported findings as a list rather than as inputs would have presented a mixed picture. Routed into the model, the picture is clear: good news on the smallest-leverage input, bad news on the two largest.
What discount rate does an external asset deserve?
Lower than instinct suggests, if the probabilities are doing their job. The published development-cost work capitalises spending at "a real cost of capital rate (the required rate of return for an investor) of 10.5% per year" (Wouters, McKee and Luyten, JAMA, 2020), and that is a reasonable anchor for a risk-adjusted model because the development risk has already been taken out of the cash flows.
The mistake to avoid has a name worth saying out loud: double-counting. If the cash flows are multiplied by a 13% probability of approval and then discounted at a rate that already embeds the chance of failure, the asset is being charged twice for the same risk, and the model will reject assets a competitor will pay for. The test is simple. Ask what each component of the rate is compensating for. Time preference and market risk belong in the rate. Technical and regulatory failure belong in the probability. Nothing belongs in both.
Three adjustments to the rate are defensible. Country and currency risk, where the cash flows or the manufacturing sit outside the buyer's home market. Financing risk, where the buyer would fund the deal in a way that changes its own cost of capital. And illiquidity, where the asset cannot be sold on partway through. None of those is technical risk, which is why each can be priced in the rate without double-counting.
Where the probability comes from, and how to avoid double-counting risk
From a published base rate for the phase and therapy area, adjusted line by line for what the room showed. The base rates most teams start from put the transition from Phase 3 to approval at 59.0% and the whole path from Phase 1 at 13.8% (Wong, Siah and Lo, Biostatistics, 2019); what they cannot tell you is anything about this asset, which is the argument of what published phase success rates can and cannot do for one case.
The same double-counting trap appears inside the probability itself. A manufacturing finding that has already been priced as an inherited study should not also reduce the probability of approval, unless the team believes the study might fail — in which case the belief, not the finding, is what reduces it, and the memo should say so. The rule that keeps a model honest is one finding, one input, with a sentence saying which.
The cost of failure: what a valuation has to carry besides the winner
A single-asset rNPV answers what one programme is worth if run in isolation. It does not answer what it costs a company to produce one approved drug, because the company also pays for the ones that stop. The published median capitalised investment of $985 million per approved drug is explicitly a figure that counts failures: it is derived from 63 therapeutic agents developed by 47 companies between 2009 and 2018, and it capitalises the spending on failed trials as well as successful ones.
Recent work argues this belongs inside the valuation method rather than beside it. A 2026 framework proposes a "modified risk-adjusted NPV (mrNPV), which addresses R&D costs, probability of success, projected sales, timely risk application, and the cost of failure" (Yeon and others, Drug Discovery Today, 2026). For a licensing team the practical reading is narrower: a bid is made from the buyer's balance sheet, so the question is not only what this asset is worth but what the portfolio costs to run at the hit rate the buyer actually achieves.
Industry-level spending gives the scale of the thing being risk-adjusted. Worldwide company-reported research and development spending "increased slightly from $82 billion to $89 billion in 2015 dollars" between 2008 and 2014, on the Government Accountability Office's count (GAO-18-40). In-licensing exists because a share of that spending buys programmes somebody else started, and the price of each one is set by exactly the arithmetic on this page.
The three findings that move a bid: a delay, a required study, a condition
On HZ-2301 the risk-adjusted value fell from $0.74 billion to $0.55 billion. The solution reports both endpoints; the decomposition below is our arithmetic, and it is worth showing because it demonstrates how small each step is on its own.
How $0.19 billion leaves a valuation in three steps
Each step is modest and the order does not matter much, which is the point: a probability cut of three percentage points, half a year of slippage and one six-month study together take a quarter of the value. None of the three was visible on public sources. All three came out of a first pass that took hours rather than days, which is the case for sorting a data room before reading it.
From rNPV to bid guidance: upfront, milestones and the royalty stack
An rNPV is not an offer. It is the ceiling from which an offer is cut, and the cut has three dimensions: how much is paid now, how much is paid on events, and how much is paid on sales. Each one shifts risk between the parties, and a buyer that has done its diligence should be using them to price exactly the risks the diligence found.
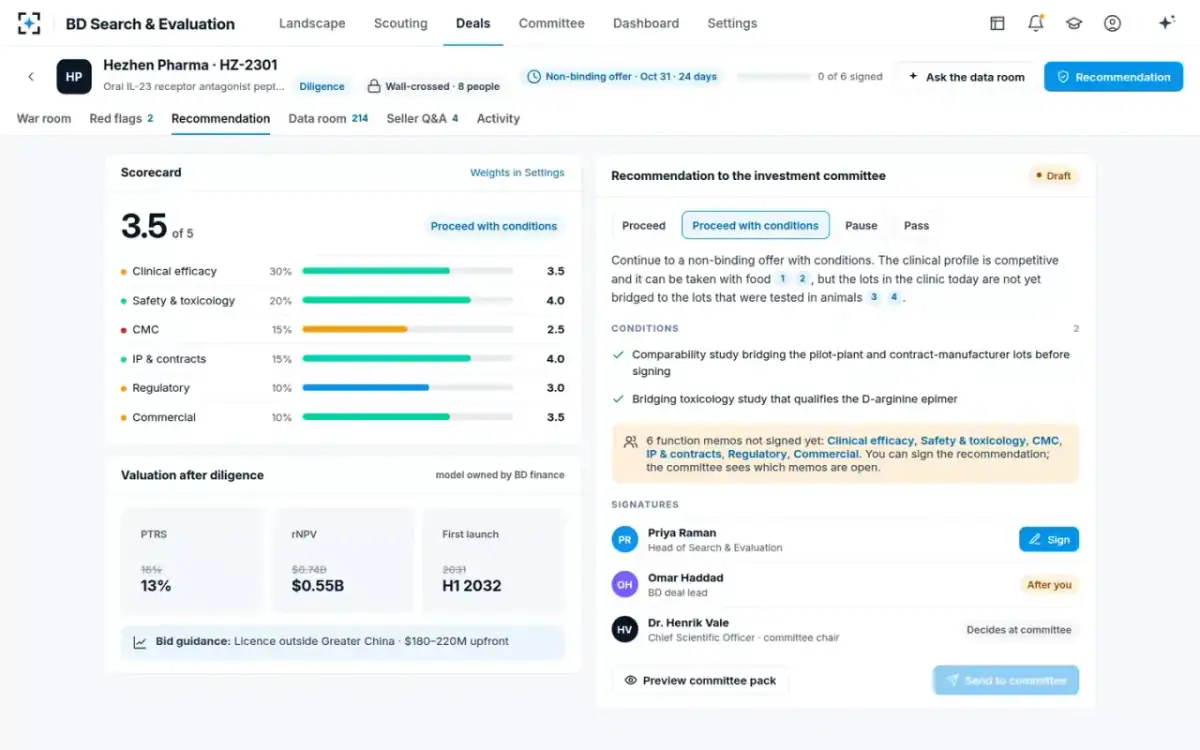
On this deal the guidance was a licence outside Greater China at $180-220 million upfront, with two conditions: the comparability study, and a bridging toxicology study that qualifies the impurity. The territory restriction is itself a valuation decision — rights outside Greater China are clear, so that is the asset being bought, and the model values that asset rather than a global one.
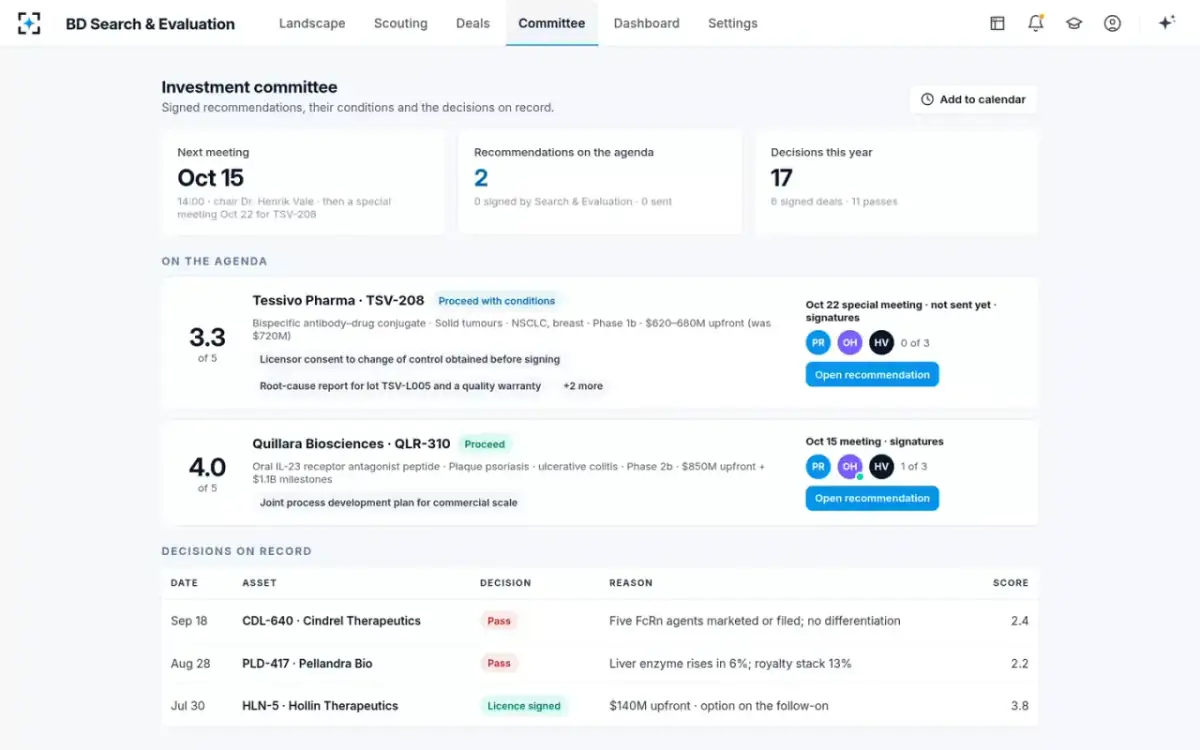
The royalty stack is the dimension most often left to the lawyers. Every third-party royalty on the molecule, its process and any enabling technology comes off the same sales line the buyer is valuing, so a stack of several points is a direct deduction from the cash flows in the model. Northwind's limit is 10%, and assets above it are flagged rather than dropped, because a limit that silently discards assets is a limit nobody revisits. On the second deal in the solution, four conditions including a licensor's consent to a change of control moved the offer from $720 million upfront to a range of $620-680 million — the clearest demonstration there is that a sorted red-flag register is a pricing instrument.
Valuation, conditions and bid guidance on one page
What the committee should be able to see in one page
Six things, and no more. The value before and after diligence, with the three findings that moved it. The probability, with its source and its adjustments. The timing assumption, stated as a date. The conditions, each tied to the finding that produced it. The bid guidance with its structure. And which memos are still unsigned, because a valuation resting on an unsigned CMC memo is a valuation resting on a draft.
That last item is the one most sets of committee papers omit and the one that most often matters afterwards. The recommendation in the solution shows it explicitly, and the agenda shows the same for every deal in front of the meeting: score, conditions, signatures, decision. The analyst keeps the model; the committee keeps the decision.
The same numbers, on the agenda
To see a valuation move with the findings behind it, from a data room to a committee agenda, start from BD Search & Evaluation.
Questions people ask
What is the difference between rNPV and DCF?
Where the risk is carried. A discounted cash flow model puts development risk into the discount rate; a risk-adjusted NPV puts it into the cash flows by multiplying each one by the probability that the programme survives to produce it, then discounts what is left at a rate nearer the cost of capital. For a development asset the second is usually more honest, because failure is a single event rather than a steady annual haircut.
What discount rate should you use for a biotech asset?
If the cash flows are already risk-adjusted, a real cost of capital rather than a venture rate: the leading development-cost study capitalises at 10.5% real, which makes a sensible anchor. Adjust it for country, currency, financing and illiquidity if those apply, but never for technical or regulatory failure, which is already priced in the probability. Charging for the same risk twice makes a buyer lose deals it should win.
How do you value a drug asset for licensing?
Build the cash flows of a successful launch, attach a probability to each one, discount, and then subtract the development spending the buyer would inherit — including studies the seller has not started. Then cut the resulting value into upfront, milestones and royalties so that each payment sits on the risk the party best placed to carry it. A valuation that cannot be translated into a deal structure has not finished.
How much does it cost to bring one new drug to market?
A median of $985 million and a mean of $1,336 million per approved drug for the 63 agents with available data from 2009 to 2018, capitalised at a 10.5% real cost of capital and counting the cost of failed trials. The figure varies widely by therapy area: the median for antineoplastic and immunomodulating agents was $2,772 million, against $766 million for nervous system agents.
How do you price a milestone and a royalty?
A milestone is a payment whose expected cost is the payment multiplied by the probability of reaching it, discounted to the date it would be paid — which means a development milestone late in the chain costs the buyer far less than its face value. A royalty comes off the same sales line the model is valuing, so it is a direct deduction from the cash flows and has to be added to every other third-party royalty on the molecule before the total is tested against the buyer's limit.
What is the cost of failure in a valuation?
The spending a company does on the programmes that never reach market, which a single-asset model does not see. Published development-cost estimates include it by capitalising failed trials into the cost per approved drug, and a 2026 framework argues for carrying it inside the valuation method itself alongside the probability of success and the timing of risk. For a licensing team it is a portfolio question: the bid has to work at the hit rate the buyer actually achieves.