Clinical trial success rates by phase describe how many drug development programmes move from one phase to the next and how many eventually reach approval. The most-cited estimate, from a study of 185,994 trials, is that 13.8% of programmes that enter Phase 1 are approved, with 66.4% moving from Phase 1 to Phase 2, 58.3% from Phase 2 to Phase 3 and 59.0% from Phase 3 to approval. Those are population averages, and that is the problem: a licensing committee is not buying a population. Diligence exists to move one asset off the average, and once a seller's data room has been read the direction is usually downward. Botminds' BD Search & Evaluation reads the room into six cited function memos and carries each finding into the probability, the timing and the valuation the committee sees, so the number on the recommendation has reasons attached to it.
The examples below follow one fictional deal in the solution: Northwind Bio looking at HZ-2301, an oral IL-23 receptor antagonist peptide for plaque psoriasis, in a 214-file room opened by Hezhen Pharma. The companies and the asset are sample data; the research is real and linked where it appears.
The headline probabilities, and how far therapy area moves them
13.8%
of programmes entering Phase 1 are eventually approved
3.4%
in oncology, the lowest of any therapeutic group
33.4%
in vaccines for infectious disease, the highest
59.0%
from Phase 3 to approval, the best-odds step in the chain
What are clinical trial success rates by phase?
A phase success rate is the share of programmes at one phase that reach the next. An overall probability of success is the share that start somewhere and finish approved. The two are related but not interchangeable, and most arguments about these numbers are really arguments about which of them someone quoted.
Wong, Siah and Lo report both. Their transition estimates for all indications are 66.4% from Phase 1 to Phase 2, 58.3% from Phase 2 to Phase 3 and 59.0% from Phase 3 to approval. Their figure for the share of programmes that enter Phase 1 and reach approval is 13.8%. Multiply the three transitions and you get 22.8%, not 13.8%. Both come from the same study and the same data; they answer different questions, and a model that multiplies published transition ratios will not land on the published overall figure. The practical rule is to say which one you used, and never to mix them inside one calculation.
The chain, worked on one asset, and why the product is not the headline number
Phase 1 to Phase 2
66.4%
Programmes that complete Phase 1 and start Phase 2, all indications, 2000-2015.
Wong, Siah and Lo (2019)
Phase 2 to Phase 3
58.3%
The step that eliminates most programmes in absolute terms, because most are at Phase 2.
Wong, Siah and Lo (2019)
Phase 3 to approval
59.0%
Better odds than either earlier step, and far more expensive to lose.
Wong, Siah and Lo (2019)
The two answers
22.8% or 13.8%
The product of the three transitions against the same study’s figure for programmes traced from Phase 1 to approval. Quote one, name it, and do not multiply it by the other.
Our arithmetic on the study’s figures
The numbers, and the three studies that disagree about them
There is no single published success rate, and the spread between the serious estimates is wide enough to change a bid. Wong, Siah and Lo put the overall figure at 13.8%; in the same comparison they report 10.4% from Hay and others (2014) and 9.6% from Thomas and others (2016). In oncology the same three estimates are 3.4%, 6.7% and 5.1%. An analyst who quotes 3.4% and an analyst who quotes 6.7% are both citing published work, and the oncology case that results differs by a factor of two.
Three published estimates of the same thing, and what each says about oncology
| Study | From Phase 1 to approval, all indications | Oncology | What it counted |
|---|---|---|---|
| Wong, Siah and Lo (2019) | 13.8% | 3.4% | 406,038 entries on 185,994 trials, January 2000 to October 2015, tracing programmes path by path |
| Hay and others (2014), as reported by Wong | 10.4% | 6.7% | An earlier industry dataset, counted phase by phase |
| Thomas and others (2016), as reported by Wong | 9.6% | 5.1% | A later industry dataset, also counted phase by phase |
The differences are not errors. They come from three choices every one of these studies has to make: which trials count as a programme, whether an abandoned programme is a failure or simply unfinished, and which years are in the window. A buyer does not have to resolve the methodological argument. It has to pick one source, state it in the memo, and use the same one across every asset it compares — otherwise the ranking of a shortlist is partly a ranking of citations.
Why therapy area changes the odds more than anything else
In the same study, therapy area alone spans 3.4% in oncology to 33.4% in vaccines for infectious disease, close to a tenfold range, which is wider than most of the adjustments an analyst can defend for a single asset. Any screening model that applies one probability across a mixed shortlist is quietly ranking oncology assets above where the evidence puts them.
Oncology's low rate is partly a measurement story. The endpoints are hard, and the agency's definitions are strict about what counts. Objective response rate, the endpoint that carries many early oncology decisions, "is defined as the proportion of patients with tumor size reduction of a predefined amount and for a minimum time period", and response duration "usually is measured from the time of initial response until documented tumor progression" (FDA, Clinical Trial Endpoints for the Approval of Cancer Drugs and Biologics). A predefined amount, a minimum time period, and a measured duration: three places where an optimistic reading of a small dataset gets corrected later.
Immunology, where HZ-2301 sits, is a different world from oncology on every one of those axes — the endpoint is a scored skin assessment at a fixed week, the comparator is a placebo arm, and the question at Phase 2 is dose rather than survival. None of that makes an asset safe. It means the base rate the committee starts from has to come from the right group before anything else is argued.
What is PTRS, and how is it different from phase success?
PTRS is the probability of technical and regulatory success: the chance that an asset both works and is approved. Phase success rates are one input to it. The rest is everything specific — the dose, the endpoint, the comparator, the manufacturing chain, the pathway the agency will expect, and whether any of those is already known to be a problem.
In practice a team builds a PTRS by starting from the published rate for the phase and therapy area, then adjusting for the handful of facts it can defend in front of a committee. The discipline that matters is writing each adjustment down as a line with a reason, not folding them into one judgement. A PTRS of 16% that is "our view" cannot be argued with. A PTRS of 16% that is "13.8% overall, lifted for immunology and for a completed Phase 1, reduced for a single-region dataset" can be, and a committee that disagrees with one line can change one line.
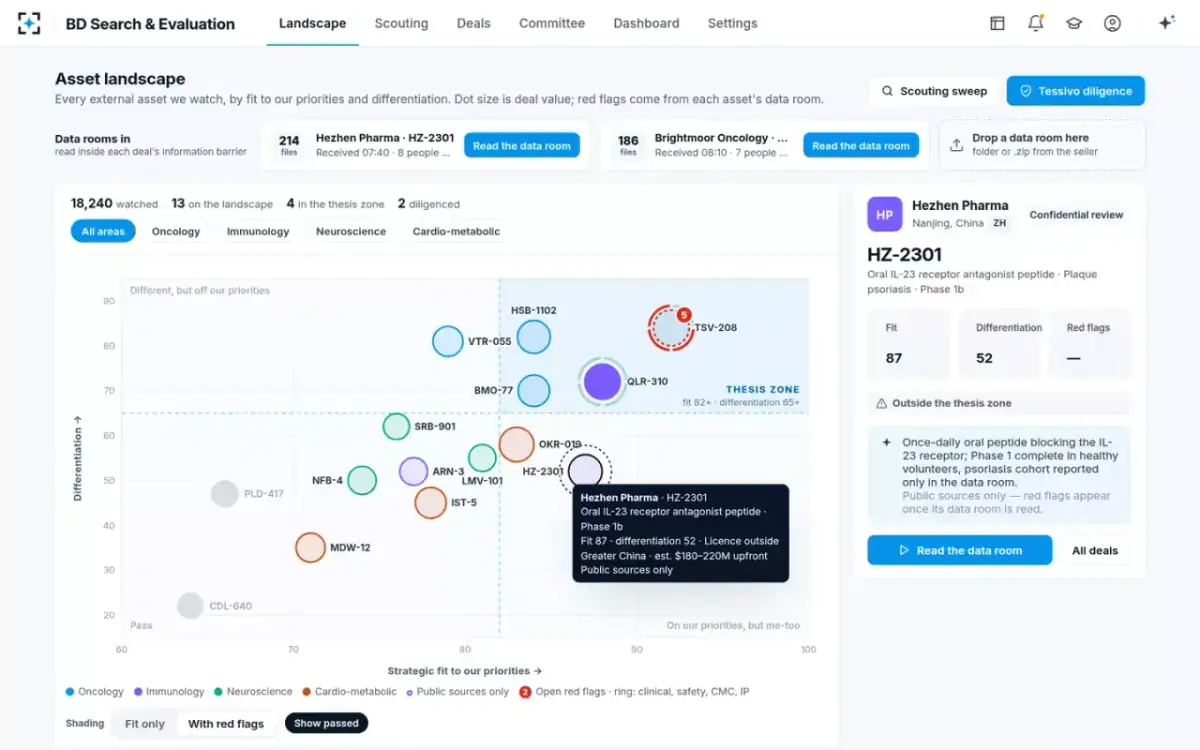
One asset before its data room is read
Why do phase 3 trials fail?
Mostly because the drug does not work well enough, and the second reason is further behind than people expect. Among 640 novel therapeutics that entered pivotal trials between 1998 and 2008, 344 failed; of those, "most products failed due to inadequate efficacy (n = 195; 57%), while 59 (17%) failed because of safety concerns and 74 (22%) failed due to commercial reasons" (Hwang and others, JAMA Internal Medicine, 2016).
Why late-stage programmes failed, among 344 failures of 640 novel therapeutics
A second study counts the same failures differently and lands in a similar place: analyses of clinical trial data from 2010 to 2017 attribute them to "lack of clinical efficacy (40%-50%), unmanageable toxicity (30%), poor drug-like properties (10%-15%), and lack of commercial needs and poor strategic planning (10%)" (Sun and others, Acta Pharmaceutica Sinica B, 2022). The two lists differ most on safety — 17% in one, about 30% in the other — and they cover different periods, cohorts and categories, so neither should be quoted as the other's confirmation. A diligence team cares less about the stated reason a programme stopped than about the cause underneath it, because a commercial failure can have a technical sentence behind it.
The 22% that failed for commercial reasons deserves a licensing buyer's attention for a different reason. Of the 74 trials of agents that failed commercially, only 6 were published. An asset whose field was quietly abandoned by somebody else leaves almost no public trace, which is why a competitive picture built from registries and congress abstracts rather than from publications is part of the clinical case, not an adjunct to it.
Why the seller's probability is higher than yours
Sellers are not usually dishonest about probability; they are differently positioned. Three structural reasons put their number above the buyer's, and all three can be checked.
The first is selection. A seller models the asset it has, with the data it has, and the programme it would run. A buyer models the asset it would own after a transaction, with the obligations that come with it — including studies the seller has not started. The second is the cut-off. A deck built in June on a February data cut will carry February's numbers forward even when the study report has moved on. The third is the counterfactual: a seller's probability usually assumes the development plan in the room, while a buyer's assumes the plan its own regulatory function would actually file.
None of those is a red flag in itself. Each is a question with a document behind it, and sorting them properly is the subject of which findings kill a deal, which change the price and which become a promise.
What the data room can actually change: dose, food effect, the cohort nobody published
The reason a first pass is worth 60 hours of expert time is that rooms contain facts that no public source does, and those facts move the number in both directions. On HZ-2301 there were three.
The first was a patient cohort. On public sources the asset had completed Phase 1 in healthy volunteers and nothing more; the room held a psoriasis cohort with PASI 75 in 18 of 28 patients, 64.3%, at week 12 on 50 mg once daily, against 1 of 9 on placebo. Small, a single cohort, and still the single largest piece of evidence anywhere about whether the molecule does anything in patients.
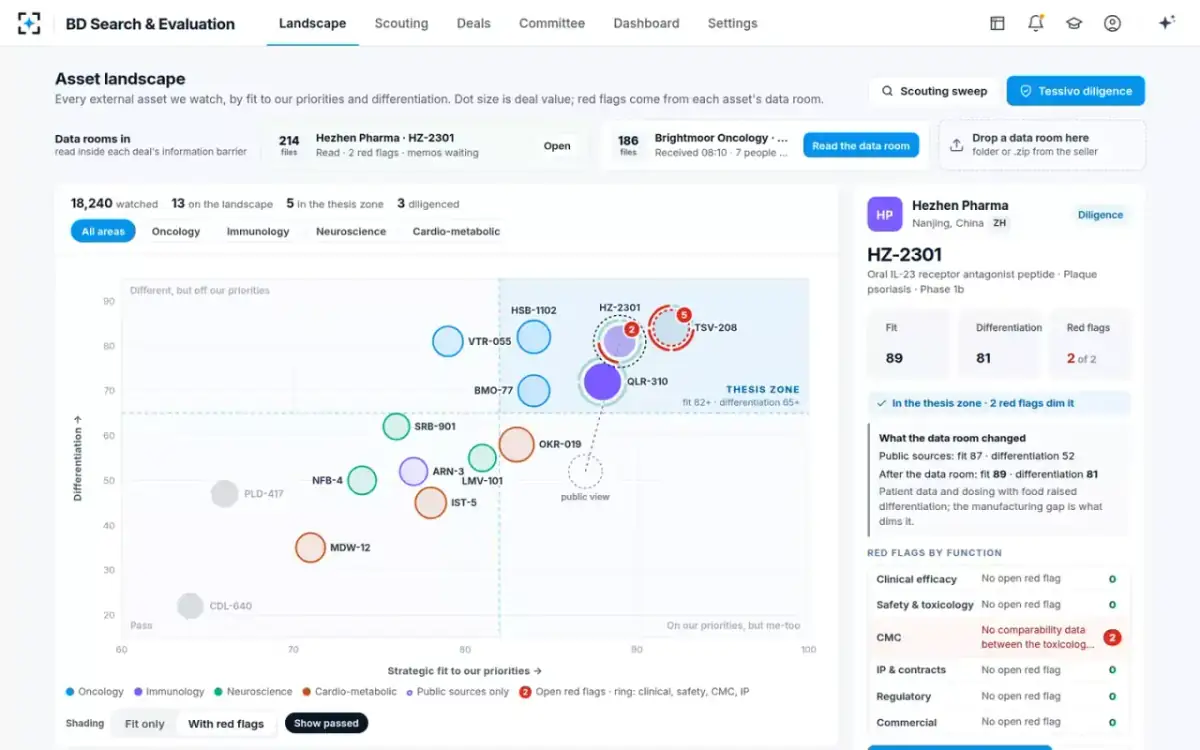
The second was a pharmacokinetic detail. The cohort summary recorded a fed-to-fasted exposure ratio of 0.94, meaning the drug can be taken with or without food, while the two oral agents ahead of it in the same pathway are dosed on an empty stomach. That moved differentiation from 52 to 81 and strategic fit from 87 to 89, and it is the kind of fact that survives into a label.
The third was manufacturing, and it moved the number the other way. The drug substance route changed after the toxicology lots were made, with no comparability data in the room, and the new lots carry an impurity the animal studies never saw. Those two findings cost months, and months are what a probability is most sensitive to.
The same asset after the room has been read
What moves a number up: biomarkers, orphan status, a precedented pathway
Not every adjustment is downward, and the published work supports a few upward ones. Orphan designation is the clearest: in the JAMA Internal Medicine cohort, orphan-designated drugs were approved significantly more often than non-orphan drugs, 46% against 34%. The same analysis found cancer drugs approved less often than the rest, 27% against 39%, and agents sponsored by small and medium-sized companies less often than those from large ones, 28% against 42% — the last of which is a reason an in-licensing buyer exists at all.
Three more adjustments are defensible from the room rather than the literature. A completed phase removes a whole transition from the chain. A precedented mechanism, where another molecule in the same pathway has already been approved, removes the target-validation question that Phase 2 usually answers. And an endpoint with regulatory precedent in the same indication removes the risk that the trial measures the wrong thing. Each of those is a line in the memo with a document behind it.
Writing the probability into the memo so the committee can argue with it
A probability in the committee papers has one job: to be disagreed with precisely. That means showing the starting figure and its source, every adjustment as its own line with the finding behind it, and the result both before and after diligence, so the meeting argues about the three findings rather than about the number.
One asset's probability of approval, before and after its room was read
On public sources
- Reaches approval · 16%
- Does not · 84%
After the data room
- Reaches approval · 13%
- Does not · 87%
Three percentage points sounds small and is not. On this asset the same findings moved the risk-adjusted value from $0.74 billion to $0.55 billion and first launch from 2031 to the first half of 2032, which is what a diligence finding does to a valuation once probability, timing and cost are all moved by the same fact. The weighted score landed just under the proceed line, so the recommendation went forward as proceed with conditions rather than proceed.
Probability and valuation on the page the committee reads
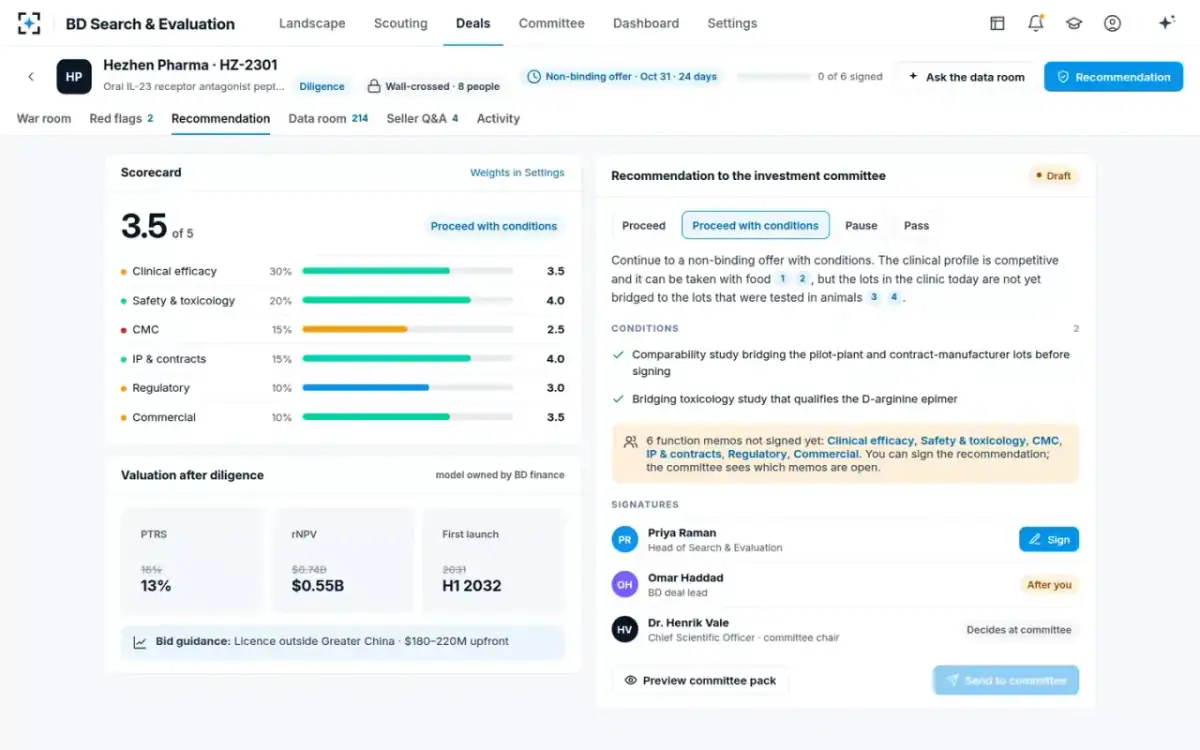
The last discipline is the one teams skip: record the probability you used and what you would have had to see to use a different one. A committee that approves a bid at 13% has implicitly rejected 16%, and in six months, when the bridging study reports, somebody will want to know which number the deal was signed on. To see the probability, the findings behind it and the memos together, start from BD Search & Evaluation.
Questions people ask
What is PTRS in pharma?
The probability of technical and regulatory success: the chance that an asset both demonstrates what it needs to demonstrate and is approved. Published phase success rates are its starting point; the rest comes from the asset's own dose, endpoint, comparator, manufacturing chain and regulatory pathway. A PTRS is only useful in a licensing case if each adjustment is written as a separate, sourced line.
What is the success rate of phase 3 trials?
About 59% of programmes that reach Phase 3 go on to approval, on the most-cited published estimate, which makes it the best-odds step in the chain and by far the most expensive one to lose. The leading reason programmes fail that late is inadequate efficacy, which accounted for 57% of 344 late-stage failures in one study of 640 novel therapeutics.
Does oncology have a lower success rate?
Yes, and by a wide margin. The same study that puts the all-indication figure at 13.8% puts oncology at 3.4%, the lowest of any therapeutic group, against 33.4% for vaccines in infectious disease. Independent counts put oncology higher, at 5.1% and 6.7%, so the practical rule is to pick one source and apply it consistently across every asset being compared.
How many drugs get approved by FDA?
Of 640 novel therapeutics that entered pivotal trials between 1998 and 2008 and were followed to 2015, 230 were approved by FDA — 36% — while 344 failed and 66 were approved elsewhere but not in the United States. That is a late-stage cohort; measured from the start of Phase 1, the share that reach approval is far smaller.
How is probability of technical success calculated?
By starting from a published rate for the asset's phase and therapy area and adjusting it, line by line, for what is specific to this asset. Do not build it by multiplying published transition probabilities and then also quoting a published overall figure: in the leading study the three transitions multiply to 22.8% while the traced overall figure is 13.8%, because they count different things.
Why is the seller's probability higher than the buyer's?
Usually for three structural reasons rather than bad faith. The seller models the development plan in its own room, not the one the buyer's regulatory function would file; a deck often carries an earlier data cut-off than the study report beside it; and the obligations a buyer inherits, such as a comparability or bridging study, are not in the seller's timeline. Each gap is a question with a document behind it.