A subrogation recovery ratio is the money an insurer recovers from responsible third parties, usually counted together with salvage, divided by the claims it paid. In U.S. insurers' annual statement data from 1996 to 2021, salvage and subrogation averaged 4.5% of net claims paid across all firms and 6.2% among firms that recovered anything, with the top fifth of recovering firms above 20% and the bottom fifth near half a percent. A ratio that varies that much measures the mix of business as much as the recovery desk, which is why it needs other numbers beside it.
For a claims executive the useful question is narrower: on the files this unit should recover, is it recovering, how fast, and is it losing any to dates? Botminds' Subrogation Recovery Management reports those numbers from the same files the specialists work, with every open recovery on one deadline tracker. The unit figures below are fictional sample data; the industry figures come from a peer-reviewed study in the NAIC's Journal of Insurance Regulation.
A recovery scorecard: nine measures, how each is calculated and where the data comes from
| Measure | Formula | Source data | Sample unit, 2026 to date |
|---|---|---|---|
| Recovery ratio | Recovered ÷ paid losses, with the denominator stated | Claim payments and recoveries; Schedule P for peers | 18.6% of paid losses with a liable third party |
| Speed by year | Share of a loss year’s recoveries collected by year 1, 2, 3 | Payment dates grouped by loss year | Read from the forecast’s payment curves |
| Days, demand to payment | Median days from demand sent to money received | Demand and payment dates | 97 days (2025: 131) |
| Statutes expired | Files and amounts closed as time-barred | Closing reason on each file | 0 since go-live (2025: 23 files, $412,600) |
| Red files without a decision | Files inside the red line with no action taken | The deadline tracker | 9 on Monday 12 October, each escalated |
| Compromise depth | Amount given up ÷ amount demanded, on compromised files | Demand and settlement by file | 418 files compromised, $2.14M recovered |
| Refunds to insureds on time | Deductible shares paid within the state’s deadline ÷ shares due | Recovery date and refund date | Kept per state rule |
| Insured updates on time | Status contacts sent within the state cycle ÷ contacts due | Letter dates against WA 60/180, NY 120 | Tracked like any other deadline |
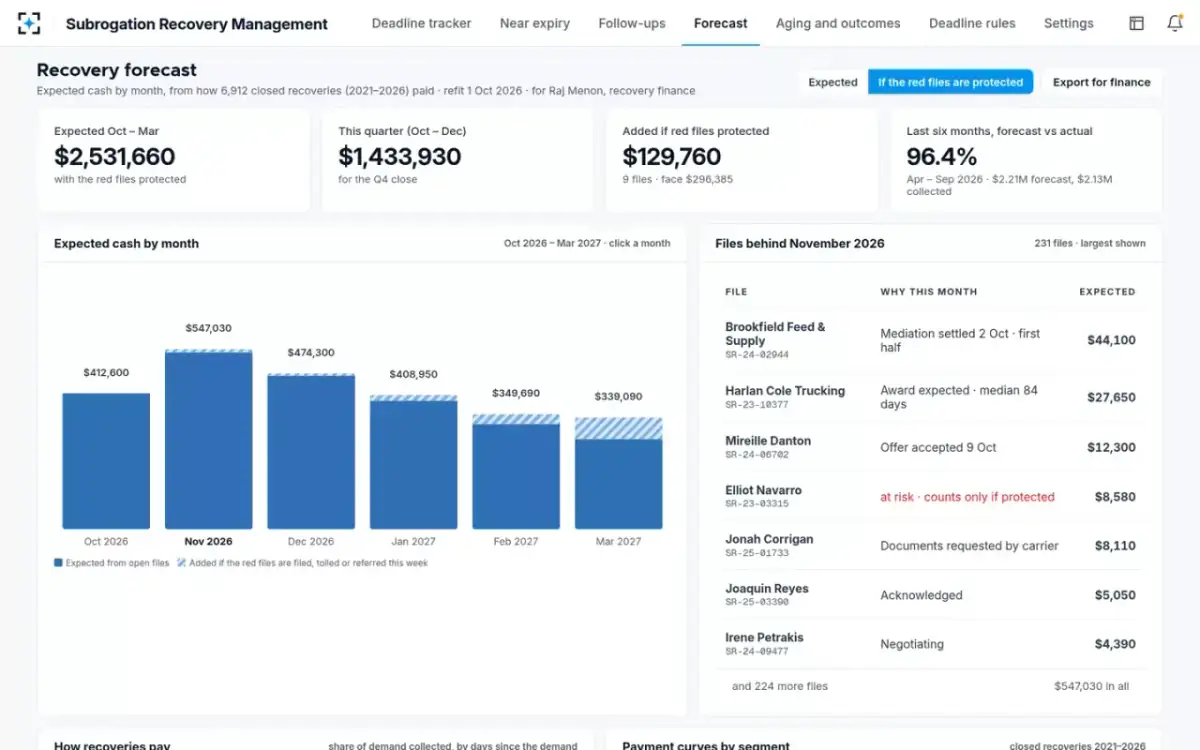
| Forecast accuracy | Collected ÷ forecast over the period | Forecast and cash received | 96.4% over six months |
What is a subrogation recovery ratio, and what does it divide by?
It is recoveries divided by losses paid, and the denominator decides what it means. Bisco and Fier, whose study in the NAIC's journal covers 26 years of annual statements, use salvage and subrogation recovered over net claims paid, drawn from Schedule P of the statutory annual statement. That ratio covers every claim, including the many with nobody to recover from.
A recovery unit usually wants a narrower denominator. The sample unit reports 18.6% of paid losses "with a liable third party", which excludes the single-car crashes and storm claims nobody can subrogate. Neither choice is wrong; mixing them is. A unit that reports the narrow ratio internally and compares it with the broad ratio from public data will look far better than it is.
What is a good subrogation recovery rate? What insurers' own statements show
There is no single good number, because the line of business sets most of it. For auto physical damage, where salvage on total losses and subrogation on not-at-fault repairs both count, the industry ratio rose from roughly 11% of claims paid in 1996 to about 20% in 2021; as the authors put it, "for every five dollars paid in claims, one dollar was recouped". For liability lines the average over the period was 1.1% for commercial auto and 2% for personal auto.
Salvage and subrogation as a share of net claims paid, by fifth of recovering insurers
The top fifth recovers about 37 times what the bottom fifth does, on the authors' own reckoning. Much of that gap is mix: a specialist auto physical damage writer and a general liability writer will never post the same ratio. The same table shows something a ratio cannot hide, though: in roughly a quarter of the firm-years studied the insurer recovered nothing. The median firm, counting those, recovered 1.85% of net claims paid. A good rate is a rate that beats the unit's own book a year ago, on the same denominator and line mix.
How do you calculate a subrogation recovery rate without fooling yourself?
Fix the denominator, group by loss year and wait long enough. A common error is calendar-year arithmetic: this year's recoveries over this year's payments. Recoveries on liability lines arrive years after the payment, so a unit that recovers well on old files and badly on new ones looks healthy for two years before the ratio turns.
Grouping by the year of the loss avoids it. Each loss year's recoveries are compared with that year's payments, and a young loss year is compared with other loss years at the same age. The second error is mix: a ratio that rises because the book shifted toward auto physical damage has not improved the unit. Report it by line, or at least by physical damage and liability separately.
How fast should subrogation recoveries come in?
Fast on physical damage, slowly on liability. In the Schedule P data, "over 55% of recovery takes place in the first year for the auto physical damage line of business." On liability, about 28% of personal auto recoveries and 35% of commercial auto recoveries arrive in the first year, and roughly 76% by the end of the third, out of what is recovered over nine years. A speed measure has to be compared with the right curve.
Share of eventual recoveries collected, year by year after the loss
- Year 128%
- Year 2+31%
- Year 3+17%
- Later24%
- Year 135%
- Year 2+30%
- Year 3+12%
- Later24%
Speed is worth money even when the total is the same. The authors point out that faster recovery matches inflows to claim payments and makes future recovery more predictable. For a unit, the practical measure is the median days from demand to payment by segment. The sample unit's fell from 131 days in 2025 to 97 in 2026; those are fictional figures, but the measure is simple to compute from any claim system that dates its demands and payments.
Statutes expired: the measure that should be zero
Every other measure trades off against something; this one does not. A file lost to a limitation period is a recovery the unit had and gave away, usually because a date was wrong or a referral was late. The measure is the count and demanded amount of files closed as time-barred each year, with the reason.
It should be reported with its leading indicator: the files inside the red line today with no decision taken. The sample unit sets the line at 14 days to a statute or the unit's own file-by date. On Monday 12 October nine files sat inside it, $296,385 between them, each on the supervisor's list with the action it needed. The way that list is produced each morning is traced in the statute of limitations tracker.
The sample unit's scorecard on the leakage leader's screen
18.6%
recovery ratio, of paid losses with a liable third party
97days
median from demand to payment, down from 131 in 2025
0files
lost to an expired statute since go-live, against 23 in 2025
$9.84M
recovered on 1,651 files in 2026 to date
The measures an insured and an examiner would choose: refunds and updates
Two measures belong on the scorecard because regulators already test them. The NAIC's market conduct examination standards test whether insureds' deductibles are refunded promptly and correctly after a recovery (NAIC Market Regulation Handbook; how to evidence it is in subrogation recovery accounting). New York sets "timely" at 30 calendar days from the recovery for auto physical damage. Washington requires the insurer to contact its insured within 60 calendar days of starting subrogation and at least every 180 days after.
Both are easy to measure and easy to miss. Refunds on time is shares paid within the state's deadline over shares due; updates on time is contacts sent within the cycle over contacts due. A unit that scores well on recovery ratio and badly on these two is collecting the insurer's money and neglecting the insured's, which is the pattern an examination finding describes.
How do you benchmark subrogation performance against other insurers?
With public Schedule P data, by line, and with care about accounting choices. The same study found that insurers which accrue for anticipated salvage and subrogation tended to recover faster on some lines; on commercial auto liability, "insurers that accrue anticipated salvage and subrogation collect a higher percentage of recovery in the third year than firms that do not accrue." Roughly two-thirds of firm-years in the sample accrued.
Benchmarks have limits worth stating to a board. Schedule P combines salvage and subrogation, so a carrier with heavy total-loss volume looks like a strong subrogator. Group members recover more slowly on physical damage in the study, possibly because subrogating against an affiliate may not pay. And the liability results were mixed, which the authors attribute partly to social inflation, the speed of litigation and negotiations insurers control less. A peer benchmark is a prompt for questions, not a target. For the cycle-time and quiet-file measures on the paying side, see claims management KPIs that move money.
Where the scorecard numbers come from: one screen for aging, outcomes and statutes missed
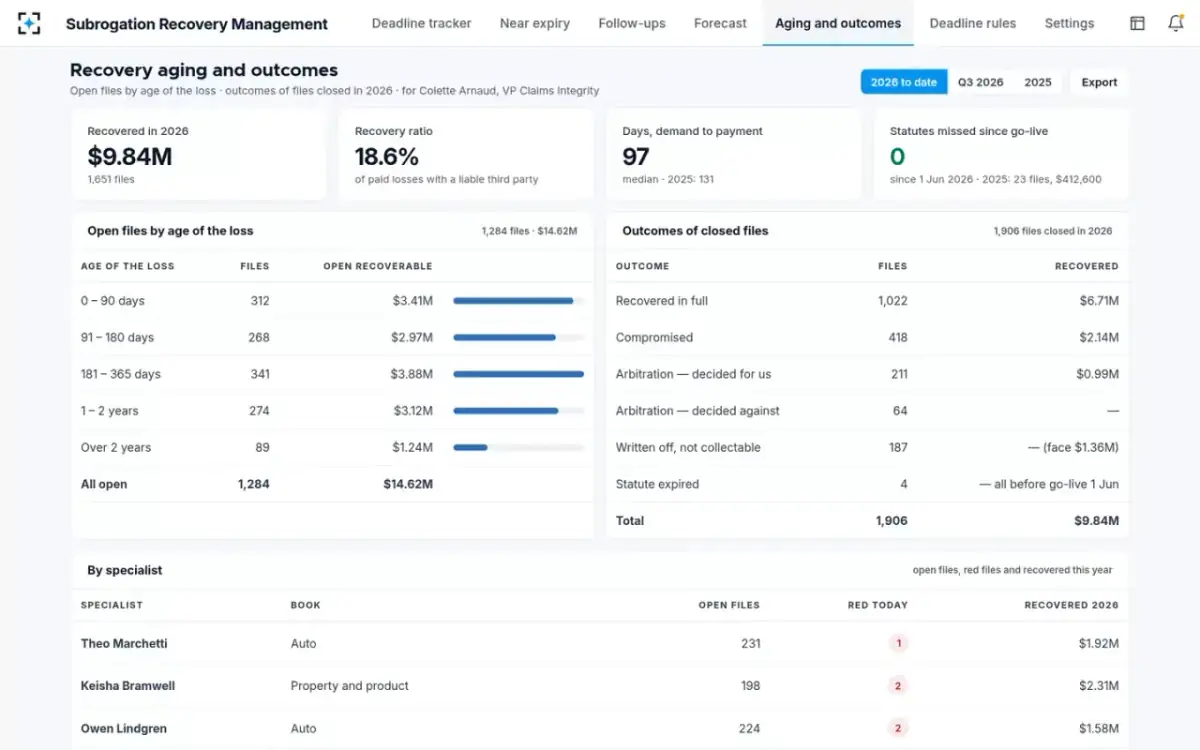
Where Subrogation Recovery Management produces each number, and where it does not
The solution produces the operational measures; finance and actuarial teams still own the statutory ones. The deadline tracker gives red files without a decision and statutes expired. The correspondence reader dates every demand, reply and payment, which is what days-to-payment and compromise depth need. The recovery forecaster fits payment curves by segment from closed recoveries and reports how much of its forecast was collected, 96.4% over six months in the sample.
It does not set reserves or produce Schedule P, and it does not decide which denominator a carrier should publish. Its forecast is labelled as an estimate and never changes booked recoveries. How the five money figures behind the ratio reconcile on each file is set out in subrogation recovery accounting.
Forecast accuracy as a measure: expected cash by month, and what protecting the red files adds
Before the scorecard goes to the board
- State the denominator in the label
All net claims paid, or paid losses with a liable third party; never mix them in one chart.
- Group recoveries by the year of the loss
Calendar-year ratios flatter a unit that recovers on old files and stalls on new ones.
- Split physical damage from liability
Their curves differ: over half recovered in year one against about a third or less.
- Report statutes expired with the red-file count
The outcome and its leading indicator, side by side.
- Add refunds and updates on time
The two measures an examiner tests and an insured notices.
Questions people ask
What is subrogation leakage?
Money a carrier could have recovered and did not: files never identified, demands that left out items, compromises nobody explained, awards never collected and claims lost to an expired statute. Each type shows up in a different measure, which is why one ratio cannot show where leakage sits.
What is the average subrogation recovery rate?
Across U.S. property-liability insurers from 1996 to 2021, salvage and subrogation averaged 4.5% of net claims paid, or 6.2% among firms that recovered anything, with a median of 1.85% counting the firms that recovered nothing. By line, auto physical damage reached about 20% in 2021, while auto liability lines averaged 1% to 2% over the period.
Does the subrogation recovery ratio include salvage?
In statutory data, yes: Schedule P reports salvage and subrogation together, so a carrier with many total losses sold for salvage shows a higher ratio. An internal subrogation ratio should separate them, since salvage depends on auctions and subrogation on liability and negotiation.
What is days from demand to payment?
The median number of days between sending a demand and receiving the money, a simple speed measure any unit can compute from its own dates. The sample unit's was 97 days in 2026, down from 131; compare it by segment, since forum files and court files pay on very different clocks.
How often should a recovery scorecard be reviewed?
Red files and expired statutes daily or weekly, because they can still be acted on; ratios and speed by loss year quarterly, because they move slowly. Liability recoveries keep arriving for years, so a quarterly ratio on a young loss year mostly measures how young it is.
Should the recovery ratio include the insured's deductible?
Not in the insurer's own ratio. The deductible share belongs to the policyholder under the state's sharing rule, so counting it flatters the ratio by money the insurer passes on. Arbitration Forums, an insurer-member not-for-profit, likewise leaves the deductible out of "total company-paid damages" when applying its forum limit.