A state leave laws chart for 2026 is only as reliable as its weakest cell, and every cell has to pass three tests: it is current for the dates of the leave in question, it applies to the employer's size in that state, and it matches the agency's own page word for word. Most charts fail one of the three by midsummer, because states change figures on dates of their own choosing (Oregon in late June, Rhode Island on 1 July, the District of Columbia on 1 October) and because the same program treats a 20-person employer and a 200-person employer differently. The tests below work on any chart: a free one, a bought one, or the spreadsheet a leave team keeps itself. Botminds' State Leave Law Compliance was built to pass them by construction, with a passage, a version and a date under every cell, but the method does not depend on it.
Three tests for every cell of a 2026 state leave chart
- Current for the leave’s dates
Which year’s figure, which benefit year, and is anything enacted but not yet in force? A cell without a date fails.
- Sized to this employer
Premium shares, job protection and even which parts of a program apply turn on headcount lines from 10 to 50.
- Matched to the agency’s own page
Same number, same words, same section. A rounded share or a paraphrased definition fails.
- Then: is the source named?
A cell that cannot be traced to a statute section or an agency page cannot be re-tested next month.
Where can I find a state leave laws chart for 2026?
The authoritative "chart" is the set of each program's own pages, and a good secondary chart is an index to them. The Department of Labor's Women's Bureau keeps an interactive map "with links to the state agencies where workers can learn more about their rights and apply for benefits" (DOL Women's Bureau). Benefits consultancies, law firms and associations publish compiled charts; they are useful for orientation and should never be the last page read before an answer goes out.
The table below lists where each 2026 figure is actually published, and when it is usually replaced. It is the list a leave team should check its own chart against.
Where each state's 2026 figures are published, and when they change
| State | Where the 2026 figure is published | When it next changes |
|---|---|---|
| California | EDD employer guide DE 44 (1.3% SDI); weekly benefit chart DE 2588 ($1,765 maximum) | Claims from 1 January |
| New Jersey | NJDOL release, 29 December 2025 ($1,119 maximum) | 1 January |
| New York | Paid Family Leave 2026 page (0.432%; $1,228.53) | 1 January |
| Washington | ESD release (1.13%) and 2026 paycheck insert ($1,647) | 1 January; 2027 rate already announced |
| Colorado | FAMLI calculator page (0.88%; $1,448.02) | Premium yearly; maximum follows the 2026-2027 state average wage |
| Oregon | Employment Department release, 29 May 2026 ($1,692.16) | Benefit years from 28 June |
| Massachusetts | DFML rates and benefit pages (0.88%; $1,230.39) | 1 January; contribution split changes 2027 |
| Connecticut | CT Paid Leave pages (0.5%; $1,016.40) | 1 January |
| Rhode Island | DLT release ($1,150 temporary disability maximum) | Claims from 1 July |
| District of Columbia | DOES page (weeks; $1,100 maximum) | 1 October |
| Delaware | Title 19, chapter 37 ($900 maximum in 2026 and 2027) | After 2027, by statute |
Test 1: is the cell current for the dates of the leave?
Current means current for the leave in question, which is not always "this year's figure". Oregon's 2026 maximum of $1,692.16 applies only to benefit years that begin on or after 28 June 2026; claimants "whose Paid Leave Oregon benefit year begins before June 28, 2026, will be subject to the 2025 minimum and maximum WBAs for the duration of their benefit year" (Oregon Employment Department, 29 May 2026). Massachusetts works the same way across the turn of the year: its own worked example has an employee whose leave starts in January 2027 paid at the 2026 maximum, because they are still in a 2026 benefit year (Massachusetts DFML).
So a chart that shows one maximum per state per year is right for new claims only, and only until the state's own reset date. A chart printed on 1 January 2026 was right all year for some states and for half of it in others.
How long a chart printed on 1 January 2026 stayed right for a new claim
Current also means showing what is coming. A chart for 2026 should already carry Washington's 2027 premium of 1.2%, announced on 16 October 2026 (Washington ESD); Massachusetts' change to the employer share from 1 January 2027 (Massachusetts DFML); and Virginia's program, enacted in 2026 with contributions by 1 April 2028 and benefits by 1 December 2028 (Va. Code § 60.2-801). Each belongs on the chart as "enacted, not yet in force", with its date.
Test 2: does the cell apply to this employer's size?
A chart that gives one premium split per state is wrong for every employer below the state's size line. The lines differ from state to state and from rule to rule, and a few states count heads in their own way: Washington averages the employees reported on the last day of each of the past four quarters, on 30 September each year (RCW 50A.10.030); Colorado counts employees on the payroll for 20 or more calendar workweeks in the prior year (Colorado FAMLI).
The 2026 size lines a state leave chart has to carry
| State | Line | What changes at the line |
|---|---|---|
| Washington | Fewer than 50 employees | No employer share of the premium; employee share still collected |
| Washington | 25 or more workers | Job protection after 180 days (from 1 Jan 2026) |
| Oregon | Fewer than 25 on average | No employer portion of the 1% contribution |
| Massachusetts | Fewer than 25 covered individuals | Effective rate 0.46% instead of 0.88% |
| Minnesota | 30 or fewer employees, and an average wage test | Small employer rate 0.66% instead of 0.88% |
| Colorado | Nine or fewer employees | Remit only the 0.44% employee share |
| Delaware | 10 to 24 employees | Only the parental leave provisions apply |
| Maryland (from 2027) | Fewer than 15 employees | Exempt from the employer portion |
| Virginia (from 2028) | 10 or fewer employees | Remit only the employee half |
Test 3: does the cell match the agency's own page, word for word?
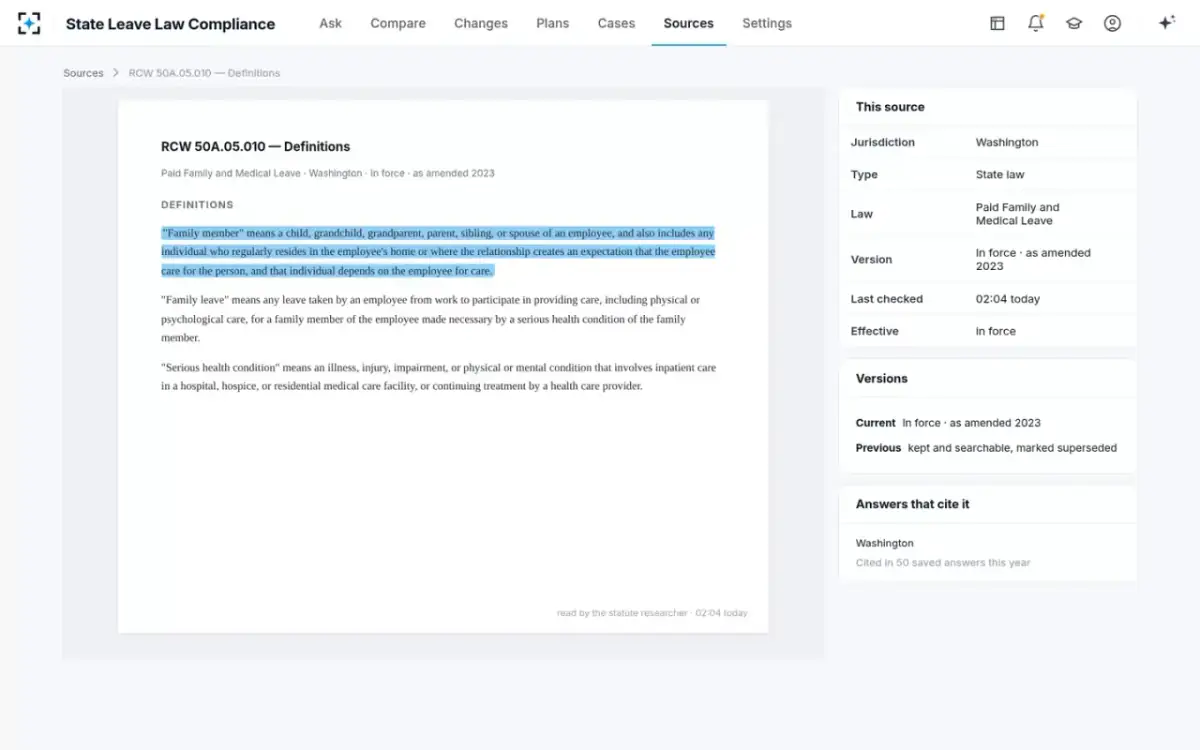
Matching means the same number and the same words, because paraphrase is where errors hide. Washington's 2026 split is "Employers will pay 28.57% of the total premium and employees will pay 71.43%" (Washington ESD); a chart that rounds it to "about 70/30" will compute the wrong deduction on every paycheck. Washington's family definition also covers a person who lives with the employee or depends on the employee for care (RCW 50A.05.010); a cell that reads "grandparents, siblings" drops that whole clause.
Even official summaries can lag the statute. The Women's Bureau page, as captured on 16 October 2026, says "Three states, New Hampshire, Vermont, and Virginia, have voluntary programs that allow some workers and employers to purchase private family or medical leave insurance" (DOL Women's Bureau). Virginia's Code, updated for 2026, now creates a state program and provides that from 1 April 2028 "each employer shall remit to the Fund contributions" (Va. Code § 60.2-806). A chart built from the federal summary would carry the old Virginia; a chart built from the statute carries the new one, dated.
The same number, the same words, the same section, and the date it applies from. Anything less is a paraphrase, and paraphrase is where leave answers go wrong.
The test that catches most chart errors
What should a leave law chart include?
Enough columns to answer the four layers separately, and a source column for every one of them. The list below is what a 2026 chart needs to support a real answer rather than a first guess.
The columns a 2026 state paid leave laws chart needs, and why
| Column | Why it is needed | Example of a cell that fails |
|---|---|---|
| Who counts as family, quoted | Family lists differ more than any other term | “Extended family” instead of the statute’s words |
| Weeks, by type and combined | States split family, medical, parental and safe leave | “12 weeks” for Washington, where 16 can be combined |
| Wage replacement formula | Most states pay on a sliding scale | “90%” without the wage it applies up to |
| Maximum weekly benefit, with its year | Resets on each state’s date | A 2025 maximum shown as current |
| Waiting period | Decides whether the first week is paid | Blank, read as “none” |
| Job protection test | Separate from benefit eligibility | The FMLA’s 12 months and 1,250 hours copied into a state row |
| Premium, split and size line | Drives payroll deductions | One split for all employer sizes |
| Private plan allowed | Changes who pays and decides claims | “Yes” with no approval process |
| Source, version, date read | Makes every other column testable | A link to a summary page |
One Washington row, scored against the three tests
Washington shows how a chart drifts. A row last revised in 2025 carries the 0.92% premium, a rounded split and the job-protection rule that applied before 1 January 2026. Each of those fails a test in 2026. The right-hand column is the row rebuilt from the agency's pages, with a date on every cell.
The same Washington row, failing and passing the three tests
A row last revised in 2025: 0.92% (the 2025 rate): fails test 1.
The row rebuilt from the agency, 27 October 2026: 1.13% for 2026; 1.2% announced for 2027 (ESD, 16 Oct 2026).
A row last revised in 2025: “About 70/30”: fails test 3.
The row rebuilt from the agency, 27 October 2026: Employers 28.57%, employees 71.43% in 2026; 29.3% and 70.7% in 2027.
A row last revised in 2025: Not shown: fails test 2.
The row rebuilt from the agency, 27 October 2026: Fewer than 50 employees: no employer share (RCW 50A.10.030(5)).
A row last revised in 2025: The pre-2026 rule: fails test 1.
The row rebuilt from the agency, 27 October 2026: Employer with 25+ workers, after 180 days, as of 1 January 2026.
A row last revised in 2025: No year shown: fails test 1.
The row rebuilt from the agency, 27 October 2026: $100 to $1,647 a week in 2026.
A row last revised in 2025: “Grandparents, siblings”: fails test 3.
The row rebuilt from the agency, 27 October 2026: The RCW 50A.05.010 definition quoted, including the care-and-dependence clause.
How often are state leave law charts updated, and how often should they be?
Many are revised once a year, after the January resets, and a few mid-year. The law moves more often than that: the 2026 changes above fall in January, May, June, July, October and, for 2027, in announcements made in the autumn. A chart that is accurate to the agencies needs reading on each agency's schedule, which in practice means checking every source on a cycle short enough to catch a change before a leave that depends on it starts.
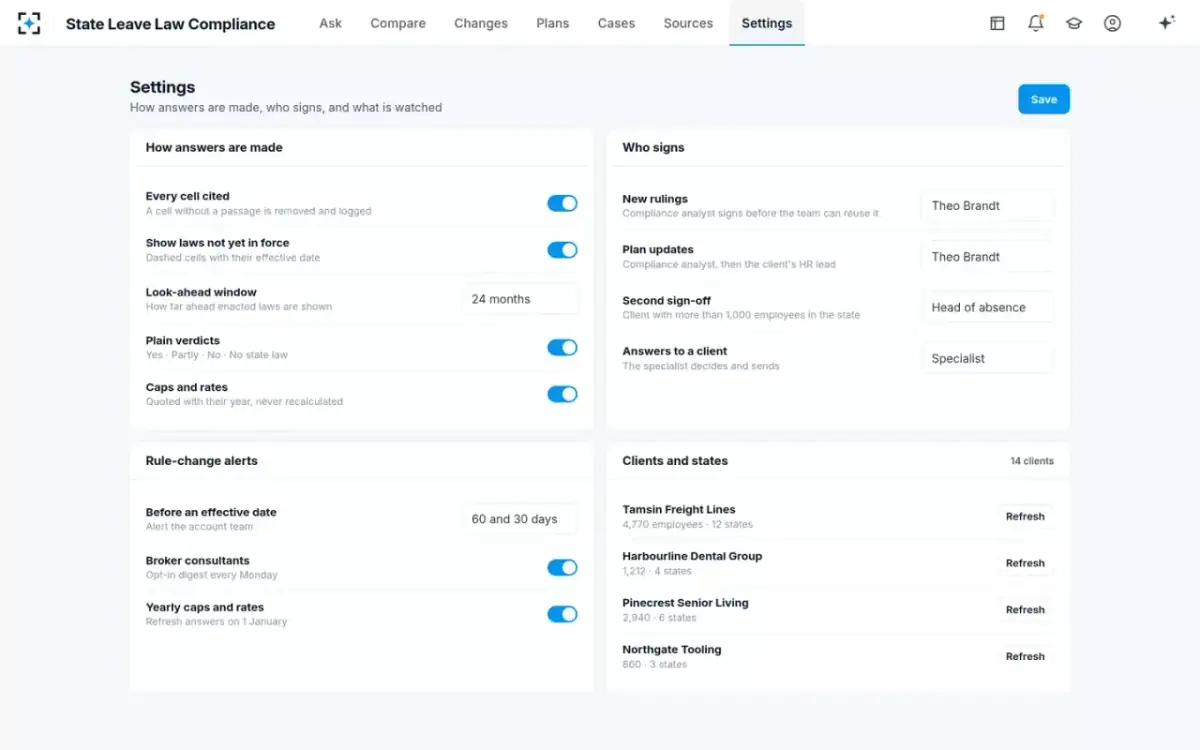
State Leave Law Compliance reads its sources each night and draws enacted laws dashed until they apply, with a look-ahead the team sets (24 months in the sample setting) and alerts 60 and 30 days before an effective date. A team using it should still set its alerts by each agency's own dates rather than by the calendar year, because several states reset mid-year.
The chart's rules, set by the team: cited cells, dated laws, alerts before effective dates
Are leave law charts reliable?
As an index, yes; as the basis for an answer, only if every cell passes the three tests on the day. The failures are predictable: a figure from the wrong year or benefit year, a size line left out, a definition paraphrased, a law shown as current before it pays or missing after it is enacted. Each one produces a specific harm: a wrong weekly payment, a wrong payroll deduction, a policy that is silent where the law now pays, or an employee told a leave is not protected when it is.
The fix is not a better chart but a chart whose cells can be re-tested. That needs the source under every cell, so a reviewer can open the passage and compare it, and a date on every figure, so a reviewer can tell when it stops applying. The same discipline applies to rates: PFML 2026 rates by state sets out each state's premium with its size line, and states with paid family leave in 2026 gives each program's benefits, dated.
Chart, research service or software: what to look for when buying
Whatever is bought, the test is the same three questions asked of a sample of its cells. A purchased chart will usually pass test 3 for the figures it carries and fail test 2, because it is written for a typical employer. A research service will answer one question well and leave the team to keep the answers current. Software that answers questions should show the passage, the version and the date behind every cell, and should show a law not yet in force as such.
Here is where State Leave Law Compliance fits and where it does not. It answers a leave question for all of a client's states and all four layers at once, each cell cited, with the client's own policy read against the law and a redline drafted where the policy falls short. It does not run payroll, decide a state benefit (the state sets the amount), file claims, or replace counsel; it needs each client's policy documents and headcount by state, and its answers are decided by the leave specialist and signed by a compliance analyst. In the sample run, the answer checker read all 48 cells of a 12-state answer back against their passages; that is a result on fictional data, and the test to run is the same on yours.
Test 3 in one click: the cell opens to the passage, its version and when it was read
Questions people ask
Which states changed leave laws in 2026?
Delaware and Minnesota began their programs on 1 January 2026 and Maine paid its first benefits from 1 May. Washington's premium rose to 1.13% and its job protection widened to employers with 25 or more workers; Oregon, Rhode Island and the District of Columbia changed figures in June, July and October; Virginia enacted a program that pays from December 2028.
How do I check a state leave rule?
Find the statute section and the program agency's current page, and compare the words and numbers with your chart. Check the date the figure applies from, whether it applies to the employer's size, and whether anything enacted but not yet in force changes it before the leave ends.
Is the Department of Labor's paid leave map enough?
It is the best federal index, with links to each state agency, but it is a summary. As captured in October 2026 it still listed Virginia among voluntary programs, while Virginia's 2026 Code requires contributions from 2028. Use it to find the agency, then read the agency.
Should a state leave chart include paid sick leave?
As a separate chart. The Women's Bureau counts 18 states and the District of Columbia with paid sick leave laws as of December 2024; those laws cover shorter absences, with their own accrual and use rules, and mixing them into a family and medical leave chart confuses both.
What is the difference between a leave chart and a leave answer?
A chart gives one value per state for a typical employer; an answer applies the law to one employee, one employer size, one reason and one set of dates. Answers built from charts inherit every stale cell, which is why the answer should cite the passage rather than the chart.