To create a loss triangle, take a claims extract valued at a date, group each claim into a cohort (usually the accident year), choose what to measure (paid losses, case-incurred losses or claim counts), add up each cohort's cumulative value at each successive valuation date, and lay those values out with cohorts as rows and age in months as columns. The older the cohort, the more ages it has, which gives the table its triangular shape; the ratios between adjacent columns are the age-to-age development factors reserving methods use. The arithmetic is simple. The hard part is the handful of decisions on the way, about dates, reopened claims, recoded claims and payments dated into closed periods, because each is a place where a data error quietly enters a triangle. Botminds' Reserving Data Validation, a data quality solution for actuaries, checks those decisions on every claim extract before it becomes a triangle; this guide builds one by hand so the decisions are visible.
From extract rows to triangle cells: four mechanical steps, three decisions
Agent
Cut the extract at the valuation dateKeep every transaction dated on or before the valuation date; nothing after it.
Never: mixes two valuation dates in one diagonal
A person decides
Decide the cohortAccident year (the usual choice), report year, or policy or underwriting year. This fixes which row each claim belongs to.
A person decides
Decide the measure and basisPaid, case-incurred (paid plus case reserves) or claim counts; gross or net of reinsurance, salvage and subrogation; with or without defence costs.
Agent
Place each transaction in a cellRow = the claim’s cohort; column = age at the valuation date, in months from the start of the cohort.
Agent
Cumulate along each rowEach cell is everything to date for that cohort at that age.
A person decides
Decide reopened, recoded and back-dated claimsSame claim or new claim; which line a moved claim sits in; which period a late-booked payment belongs to.
Agent
Compute age-to-age factorsEach cell divided by the cell to its left; averages by column for the method to use.
Never: selects the factor
What is a loss triangle?
A loss triangle, or development triangle, is a table of how the value of groups of claims changes over time. Friedland's study text for the Casualty Actuarial Society defines it in one line: "A development triangle is a table that shows changes in the value of various cohorts over time" (Friedland, Estimating Unpaid Claims Using Basic Techniques, CAS, 2010). The cohort is the row, the age is the column, and every diagonal running from bottom left to top right is one valuation date.
Accident years are the usual cohort. "Aggregation by accident year is, by far, the most common grouping of claims data for the actuarial analysis of unpaid claims," the same text says; it groups claims by the date of the event that triggered coverage, so each row is a fixed population of accidents whose cost emerges over the following years. Report years fix the number of claims at the end of the year; policy or underwriting years match claims to the premium that paid for them, at the cost of a longer wait.
What data do you need for a loss triangle?
Claim-level transactions with dates, not totals. At minimum: a claim identifier, the accident date, the report date, the line or coverage code that places the claim in a segment, and each payment and case reserve change with its accounting date. Friedland lists the key dates for organising claim data as policy effective dates, accident date, report date, accounting date and valuation date, and distinguishes the last two carefully: the accounting date defines which claims the liability covers, while "The valuation date is the date through which transactions are included in the database used in the evaluation of the liability, regardless of when the actuary performs the analysis."
Definitions matter as much as fields. Is a reopened claim the old claim number or a new one? Are recoveries netted in paid or held separately? Do case reserves include expenses? Two extracts with identical fields can build different triangles if those answers differ, which is why the actuarial standard on data quality asks the actuary to know how each data element is defined.
How to create a loss triangle, step by step: a worked example
Take a deliberately small extract: seven claims from one line, accident years 2023 to 2025, valued at 31 December 2025. It is fictional and far too small to estimate anything, but every decision a real extract needs shows up in it.
Step 1: the extract, valued 31 December 2025
| Claim | Accident date | Reported | Paid in 2023 | Paid in 2024 | Paid in 2025 | Note |
|---|---|---|---|---|---|---|
| A | 10 Mar 2023 | Mar 2023 | 4,000 | 6,000 | 0 | Closed 2024 |
| B | 20 Nov 2023 | Jan 2024 | 0 | 3,000 | 5,000 | Reported in the next year |
| E | 2 Jun 2023 | Jun 2023 | 1,000 | 0 | 2,500 | Closed 2023, reopened 2025 |
| C | 5 Feb 2024 | Feb 2024 | – | 2,000 | 7,000 | Open |
| D | 15 Aug 2024 | Sep 2024 | – | 0 | 1,500 | Closed 2025 |
| F | 3 Apr 2025 | Apr 2025 | – | – | 3,500 | Open |
| G | 30 Dec 2025 | Jan 2026 | – | – | – | Not in the extract: an IBNR claim at the valuation date |
Step 2: choose the cohort. Accident year: A, B and E belong to 2023; C and D to 2024; F to 2025. Claim B was reported in January 2024 but happened in November 2023, so it sits in the 2023 row; on a report-year basis it would sit in 2024. Claim G happened before the valuation date but is not in the extract at all, because nobody knew about it yet. That gap is what IBNR estimates fill, and no triangle built from reported data contains it.
Step 3: choose the measure. Paid losses, cumulative, net of nothing for simplicity. A case-incurred triangle would add each open claim's case reserve at each valuation date.
Step 4: place and cumulate. Age is measured from the start of the accident year, so accident year 2023 is 12 months old at 31 December 2023, 24 months at the end of 2024 and 36 months at the end of 2025. As Friedland puts it, "The age (or maturity) is generally measured in terms of the time from the start of the cohort period." Accident year 2023 has paid 5,000 by 12 months (A's 4,000 and E's 1,000), 14,000 by 24 months (plus A's 6,000 and B's 3,000) and 21,500 by 36 months (plus B's 5,000 and E's 2,500 after reopening).
Step 4: the cumulative paid triangle, and step 5: its age-to-age factors
| Accident year | 12 mo | 24 mo | 36 mo | 12→24 | 24→36 |
|---|---|---|---|---|---|
| 2023 | 5,000 | 14,000 | 21,500 | 2.800 | 1.536 |
| 2024 | 2,000 | 10,500 | 5.250 | ||
| 2025 | 3,500 | ||||
| Weighted | 3.500 | 1.536 |
Step 5: compute factors. Divide each cell by the one to its left: accident year 2023 grew by a factor of 2.800 from 12 to 24 months and 1.536 from 24 to 36. Averaging down each column, here weighted by volume, gives the pattern a development method projects forward. Which average to use, how many years to include and what tail to apply are selections, and they belong to the actuary; how actual development then compares with the selected pattern is set out in actual vs expected in actuarial reserving.
How are reopened claims handled in triangles?
It depends on the claims system, and that is the problem. Claim E closed in 2023 and reopened in 2025. If the system reopens the same claim number, its 2,500 lands in accident year 2023 at 36 months, as above, and the claim count stays at one. If the system issues a new claim number with a new report date, the payment may still land in accident year 2023 but the reported count for 2023 rises by one, and on a report-year basis the claim moves to 2025 entirely.
The profession's guidance has flagged this for decades. The Berquist and Sherman interview list, as updated in Friedland's text, asks claims executives: "What procedures are followed in recording reopened claims? Are such claims coded to the report date of the original claim or to the date of reopening?" The CAS Statement of Principles reprinted there notes that "The method of assigning report dates to reopened claims can also affect the IBNR reserve" (Friedland, CAS, 2010). Even the NAIC's proposed rewrite of the Schedule P instructions drew a warning on the point: the Academy commented in March 2026 that a draft definition of reported claim counts could be read as counting a reopened claim twice, once when it closed and again when it reopened (Academy letter to the NAIC).
Reopening rates also move. In the sample insurer that runs through Reserving Data Validation, 86 workers' compensation claims reopened in one quarter against a four-quarter average of 41, after a file clean-up had closed 61 claims early. The reserving lead noted it in the data memo rather than adjusting it, and flagged the claims for case reserve review.
What is the difference between paid and incurred triangles?
A paid triangle counts money out of the door; an incurred triangle counts money paid plus money the claims department expects to pay on known claims. Each rests on its own assumption about the claims operation, and each breaks when that operation changes.
Paid and incurred triangles, and what each assumes
Paid triangle: Cumulative payments to the valuation date.
Case-incurred (reported) triangle: Cumulative payments plus case reserves at the valuation date.
Paid triangle: Consistent speed of settlement and payment.
Case-incurred (reported) triangle: Consistent adequacy of case reserves.
Paid triangle: A new claims system, a backlog push or a payment-date change alters timing.
Case-incurred (reported) triangle: Case reserving practice strengthens or weakens, or recoveries post into case reserves.
Paid triangle: Payments dated into closed quarters; duplicate payment loads.
Case-incurred (reported) triangle: Negative case reserves; recodes moving open claims between lines.
Paid triangle: Recoveries netted in paid can make cells fall.
Case-incurred (reported) triangle: Finance’s “incurred” often includes IBNR; an actuary’s case-incurred does not.
Because the two fail differently, actuaries build both and compare them. A paid triangle that jumps while the incurred one does not points to a timing change; the reverse points to case reserves, which is a question for the claims side (the case reserves versus IBNR guide sets out where the adjuster's number ends).
What is a diagonal in a loss triangle, and why do new errors land there?
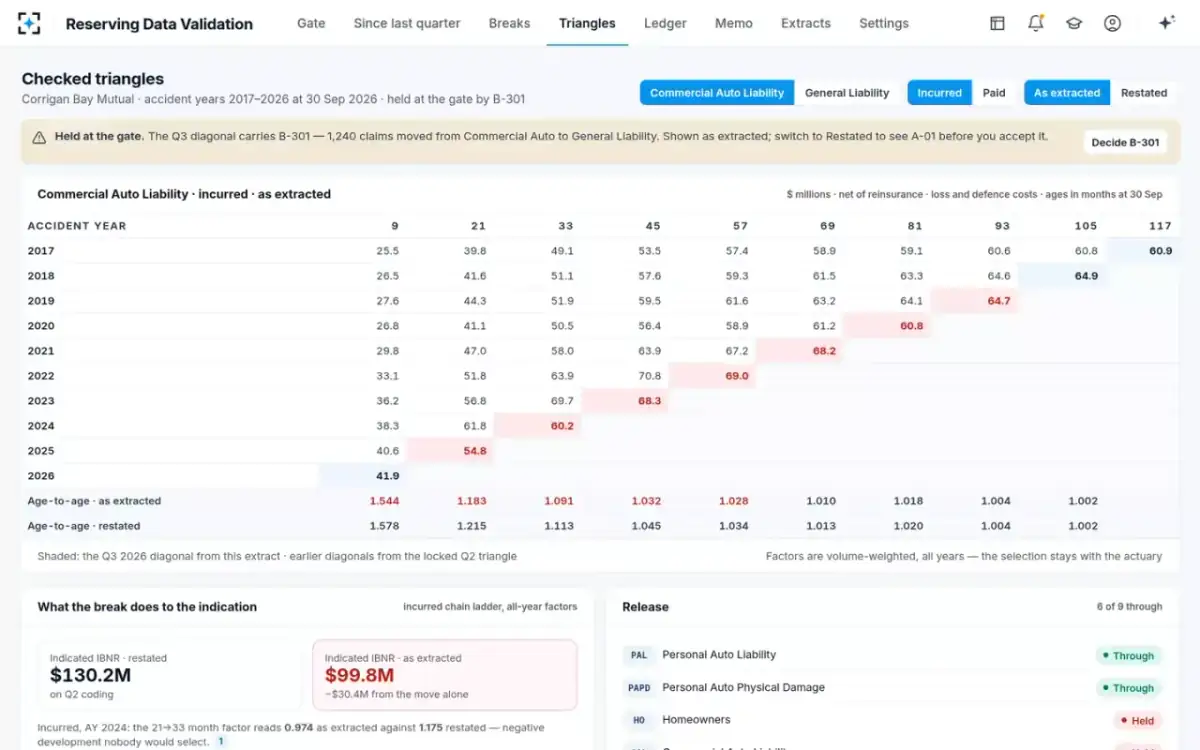
A diagonal is every cohort's value at one valuation date. "Each subsequent diagonal in the reported claim triangle represents a successive valuation date," Friedland writes; in the worked example the 31 December 2025 diagonal is 21,500, 10,500 and 3,500. Each quarter or year, reserving adds one new diagonal from the latest extract and, in principle, leaves every earlier one alone.
That is why the newest diagonal is where most new errors land, and why the earlier ones are worth guarding. Suppose claim C had been recoded to another line in 2025. Its 9,000 would leave this triangle's 24-month cell for accident year 2024, which would read 1,500, while the 12-month cell built last year still includes C's 2,000. The factor would read 0.750: negative development no actuary would select, caused by the data rather than the claims. A real recode does the same at scale. In the sample insurer, one coding-table change moved 1,240 claims out of Commercial Auto, and the accident year 2024 factor from 21 to 33 months read 0.974 as extracted against 1.175 restated. And a payment dated into a closed quarter rewrites an earlier diagonal, which is why Reserving Data Validation compares every earlier cell with last quarter's locked triangle and flags changes above 0.25% in its sample configuration.
A triangle with its newest diagonal shaded, as extracted and restated
How to make a loss triangle in Excel or Python without losing the trail
In Excel, put one transaction per row with accident year, age at valuation and amount as columns, then build the triangle with a pivot table or SUMIFS over accident year and age, and cumulate across. In Python, the same is a group-by and a cumulative sum, and open-source libraries such as chainladder build triangles directly from transaction data. Either way, three habits keep the triangle checkable:
Before you trust a triangle you built
- Keep the extract it came from, unchanged
Next quarter’s comparison needs exactly the data this triangle used, not a refreshed copy.
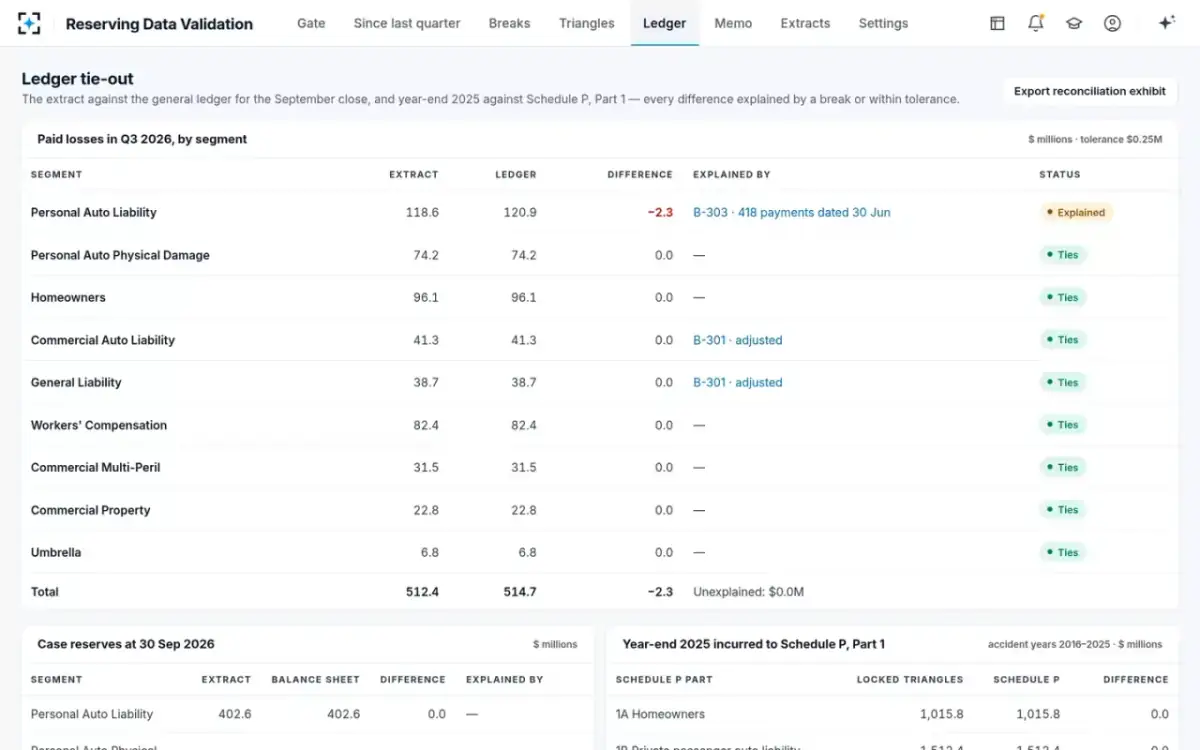
- Tie the newest diagonal to the general ledger
Paid in the period by segment; every difference named.
- Compare earlier diagonals with last quarter’s
Any change in a cell that should be closed is a back-dated payment, a recode or a conversion.
- Compare claims, not only totals, with last quarter
Claims that changed line, accident date or number move cells while totals stay flat.
- Write down each decision
Cohort, measure, basis, reopened-claim treatment, segment mapping and coding-table version.
- Build paid and incurred side by side
Disagreement between them is the cheapest diagnostic there is.
The newest diagonal tied to the general ledger, segment by segment
The decisions in the last two items are the ones that change most when systems change. A claims platform migration can renumber claims or alter payment dates in a single weekend, and the claims system migration guide for reserving sets out what to freeze and compare around one.
How often are loss triangles updated?
Usually every quarter for internal reserving and every year for the statutory annual statement. "Actuaries typically use claims data at month-end, quarter-end, half-year-end, or year-end valuation dates," Friedland notes, and the valuation date need not equal the accounting date: year-end reserves are often estimated from data valued at 30 September or 30 November and rolled forward. Each update adds a diagonal, which is the moment to check that the earlier diagonals have not moved. Reserving Data Validation runs those checks the day the extract lands; how they work is on the Reserving Data Validation page.
Questions people ask
What is an accident year triangle?
A triangle whose rows are accident years: each row holds the claims from accidents that happened in one calendar year, and each column shows their cumulative value at a given age. It is the most common layout in U.S. reserving and the one Schedule P uses for its loss development parts.
Can a loss triangle show negative development?
Yes, legitimately: claim counts can fall when claims closed without payment are excluded, and incurred can fall when claims settle below their case reserves or when recoveries are included. Negative development can also be a data artefact, such as claims recoded out of the segment, which is why a falling cell should be traced to its claims before it is accepted.
What is the difference between a loss triangle and a loss development factor?
The triangle is the table of cumulative values; a loss development factor, or age-to-age factor, is the ratio of one column to the previous one for a cohort, or an average of those ratios. Selected factors, chained together to ultimate, are what development methods apply to the latest diagonal.
Are Schedule P triangles gross or net of reinsurance?
The loss development triangles in Schedule P are net of reinsurance; the Casualty Actuarial Society's research data set, for example, takes its incurred and paid triangles from Schedule P Parts 2 and 3 as net losses. Internal triangles may be gross, net or both, and a triangle should always say which.
How many years should a loss triangle include?
Enough for the line's claims to settle, so long-tailed lines such as workers' compensation or general liability need more years than auto physical damage. Schedule P's development parts show ten accident years; internal triangles often keep more history where the data are consistent, and less where a system change makes older years incomparable.