Data quality KPIs are measures that show, quarter after quarter, whether data is fit for the use it is put to. For reserving data that use is specific: building loss triangles and estimating unpaid claims from a claim and payment extract. So the useful KPIs are specific too. They count breaks found before any development factor is selected, days from the extract landing to released triangles, the difference to the general ledger that nobody can explain, claims that changed since last quarter without a cited cause, and the days of rework when an error surfaces late. Generic dashboard measures such as null rates and row counts miss the errors that move triangles, because a recode or a back-dated payment batch leaves every field valid. Botminds' Reserving Data Validation, a data quality solution for actuaries, checks each claim extract before it becomes a triangle and produces these measures as a by-product of the checks.
Worked figures on this page come from a fictional mutual insurer whose extracts run through the solution: four quarters checked by hand, then three with the checks run on landing. Targets are ours or the solution's design targets, and are called targets.
Eight data quality KPIs for reserving data, with definitions and targets
| KPI | Definition | Target |
|---|---|---|
| 1. Breaks found before factors | Breaks found by the checks before factor review, divided by all breaks found in the quarter, including those found later | 100% |
| 2. Days to released triangles | Calendar days from the extract landing to the last segment released to the reserving workbook | One day (the solution’s design target); your own baseline first |
| 3. Unexplained difference to the general ledger | Paid in the quarter and case reserves, extract minus general ledger, by segment, after named breaks | Zero above tolerance (sample tolerance $0.25 million per segment) |
| 4. Changes without a cited cause | Claims whose line, dates, state, cause or catastrophe code changed since last quarter and are not tied to a change-log entry or within tolerance | Zero above tolerance; each one a named break |
| 5. Prior-diagonal drift | Largest change in any earlier triangle cell against last quarter’s locked triangle, after adjustments | Within 0.25%, or explained |
| 6. Adjustments documented with their claims | Adjustments in the data memo that list their claims, amount, cause and approver, divided by all adjustments | 100% (the solution’s design target) |
| 7. Rework days after factor review | Person-days spent redoing triangles, exhibits or selections because of a data error found after factors were reviewed | Zero |
| 8. False holds | Segments held for a change later accepted as expected, such as catastrophe codes added under a ticket | Falling each quarter |
What are data quality KPIs for reserving data?
They are quality measures tied to the decisions reserving data feeds, reported each quarter against a target. A KPI earns its place if a bad value would change what the reserving team does: hold a segment, restate a triangle, delay the review or tell the appointed actuary. Row counts and field completeness are inputs to KPIs; they are rarely KPIs themselves, because an extract can be 100% complete and still put 1,240 claims in the wrong line.
The eight above share one design rule: each is computed from things the checks already produce. A break list, a general ledger tie, a comparison with last quarter's locked extract and a data memo are the evidence a reserving review needs anyway. A KPI that requires a separate survey or a quarterly spreadsheet will be skipped in the busiest quarter, which is the one that matters.
The six data quality dimensions, translated for a claims extract
Most data quality frameworks measure six dimensions, and they translate cleanly to reserving. The UK Government Data Quality Framework, published by the Government Data Quality Hub in 2020, uses the six core dimensions defined by DAMA UK: completeness, uniqueness, consistency, timeliness, validity and accuracy (UK Government Data Quality Framework). Two of its definitions do most of the work for an actuary. "Consistency describes the degree to which values in a data set do not contradict other values representing the same entity." "Timeliness describes the degree to which the data is an accurate reflection of the period that they represent, and that the data and its values are up to date."
For a claims extract, "the same entity" is the same claim last quarter and the same money in the general ledger, and "the period they represent" is the accounting date of every payment. That is why consistency and timeliness carry most reserving KPIs, while validity and uniqueness are handled by field rules. The framework adds a warning reserving teams know well: "It is important not to confuse the completeness of data with its accuracy."
Six data quality dimensions, and the reserving test for each
| Dimension | What it asks of a claims extract | Check that measures it | KPI |
|---|---|---|---|
| Completeness | Every claim and transaction through the valuation date is present | Control totals; open-claim roll-forward; vanished claims against last quarter | 4 |
| Uniqueness | Each claim and payment appears once | Duplicate transaction rule; renumbered claims matched to their originals | 4 |
| Consistency | Values agree with last quarter and with the general ledger | Claim-by-claim comparison; general ledger tie; prior-diagonal check | 3, 4, 5 |
| Timeliness | Each payment sits in the period it belongs to; the extract arrives when the review needs it | Back-dated payment check; days to released triangles | 2, 5 |
| Validity | Codes exist, dates are possible, amounts have the right sign | Field rules: no negative case reserves, accident before report, closed after opened | 1 |
| Accuracy | Values match reality | Not testable by the reserving team alone; ASOP No. 23 asks for a review, not an audit, and leaves accuracy with the data supplier | 6 |
How do you measure reserving data quality without an audit?
By measuring consistency, which a reserving team can test, rather than accuracy, which it cannot. The actuarial standard on data quality asks for a review of the data for reasonableness and consistency, not an audit of whether every value is true, and it places the accuracy of supplied data on the supplier; the plain-words guide to ASOP 23 sets out what the review involves. The KPIs follow the same line. They say whether this quarter's data contradicts last quarter's, contradicts the general ledger, or contradicts itself, and whether each contradiction was explained before it reached a factor.
The American Academy of Actuaries makes the same point for audit committees. Its 2020 overview for property and casualty audit committees, reprinted in the Academy's 2025 practice note on loss reserve opinions, says that "beyond reconciling with Schedule P, the actuary is required to review the data for sufficiency, reasonableness and consistency" (American Academy of Actuaries, 2020 overview in the 2025 practice note). Sufficiency, reasonableness and consistency can all be counted.
What does bad claims data cost an insurer? Price one late break
Mostly rework, and occasionally much more. No public source gives a benchmark for what a bad extract costs, so price it with your own numbers. The terms below are the ones that move, written as a formula a reserving lead can fill in for one quarter.
The cost of one break found after factors were reviewed
Rework
people × rework days × loaded day rate
Rebuilding triangles and exhibits, re-running selections, rewriting the memo
Reserving lead
Delay
days late × cost of a compressed review
Less time for the reserving committee, the appointed actuary and the auditors
Chief actuary
Wrong number risk
probability the break is missed × misstatement it would cause
A recode left in can move indicated IBNR between lines by tens of millions
CFO
Outside review
extra hours from auditors, examiners or a consulting actuary
Unsupported adjustments draw questions; unacceptable work can be redone at the company’s expense
Appointed actuary
Put the sample insurer's worst hand-checked quarter through it. A general liability jump was found in week three and cost six days of rework. If three people did that rework at the BLS median wage for actuaries ($130,000 a year in May 2025, about $62.50 an hour over 2,080 hours), the wage cost is about $9,000 before benefits and overhead (BLS; the arithmetic and the staffing are our assumptions). That is the small term. The large one is the number that would have been carried had nobody noticed: in the sample, one coding change alone swung indicated IBNR by $63 million between two lines on mechanical all-year factors.
The far end of the range is public. In 2009 the SEC charged an Ohio insurer and its chief executive after, it alleged, more than $1 million of reinsurance claims notified shortly before the annual filing were never properly booked, so the 2003 financial statements materially understated expenses and loss reserves (the release is quoted in insurance claims reconciliation). The company and its chief executive settled without admitting or denying the allegations; he agreed to a $60,000 civil penalty (SEC Litigation Release No. 21300, 2009). It was a booking failure rather than an extract error, but it shows what a claim that never reaches the numbers can become.
How many days should it take to release triangles?
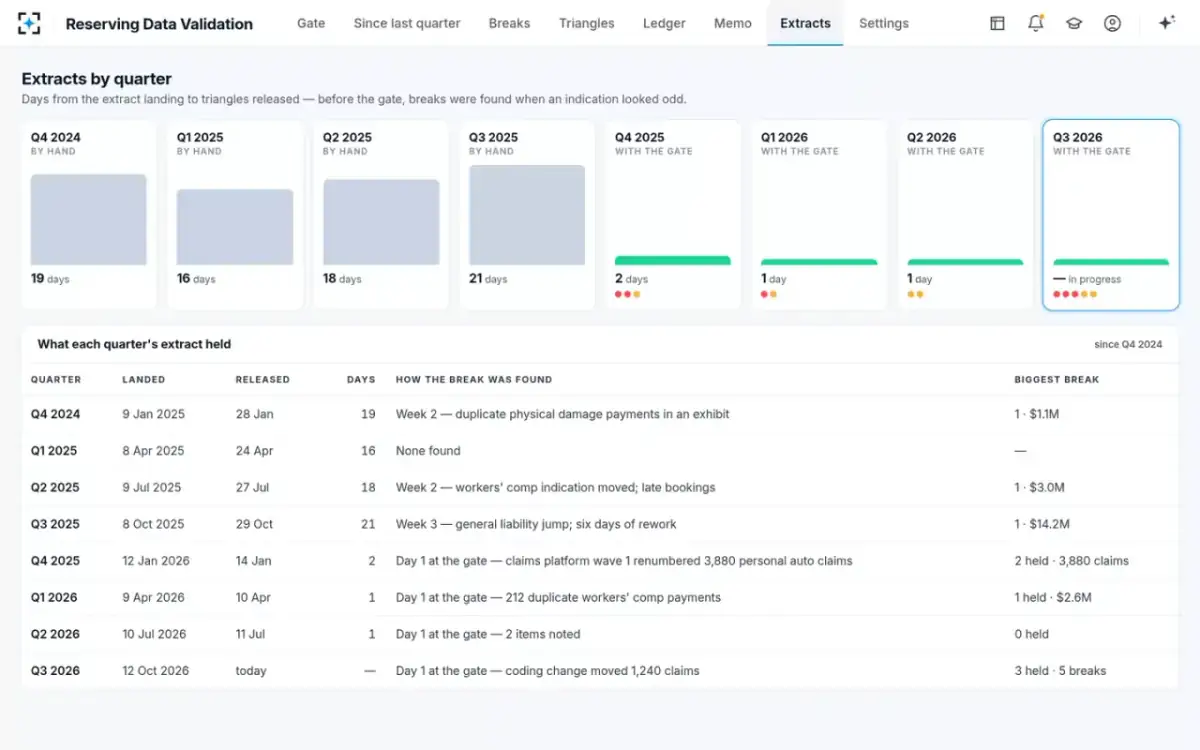
As few as the checks allow, measured from the extract landing to the last segment released. There is no public benchmark, so the useful comparison is a team with itself. The sample insurer's four quarters checked by hand took 16 to 21 days; most of that time was not checking but noticing and tracing, because errors surfaced only when an indication looked odd.
Days from extract to released triangles, quarter by quarter
Where the days go is the more useful KPI for a team planning its own change. The split below is an estimate for the 21-day sample quarter.
Where a 21-day quarter's data days go, by hand
Extract to released triangles, 21 days
- Profiling and control totals · 10%
- Tying paid and case to the general ledger · 10%
- Building triangles and exhibits · 14%
- Noticing the jump · 19%
- Tracing claims and cause with claims data · 19%
- Rework and the data memo · 28%
What is an acceptable unexplained difference to the general ledger?
Zero above a stated tolerance, with every difference below it acknowledged. The right tolerance depends on segment size and on how the analysis uses the data; in the sample configuration it is $0.25 million of paid per segment per quarter. What a team should never report is a net figure that hides offsetting differences, because a recode produces exactly that: a shortfall in one line and an equal excess in another.
In the sample quarter, the extract's third-quarter paid was $512.4 million against $514.7 million in the general ledger for the September close. The whole $2.3 million sat in one segment and was explained by one break, 418 July payments dated 30 June, so the unexplained difference was $0.0 million. Regulators take the same view of the year-end reconciliation to Schedule P, where differences the appointed actuary considers immaterial should still be acknowledged; the Schedule P reconciliation guide covers that tie in detail.
Every quarter's extract, its days and how its break was found
How to report data quality to the chief actuary and the board
Report fewer numbers, with the claims behind the bad ones. A chief actuary needs the eight KPIs by segment and the trend; an audit committee needs to know whether data limited the analysis and what was done about it. The Academy's overview suggests the board or audit committee "may consider asking management and/or its Appointed Actuary about the quality of the data and whether there are limitations on its use and/or reliability for projection purposes" (American Academy of Actuaries, 2020). A quarterly page that answers that question before it is asked is the most useful report a reserving team can send upward.
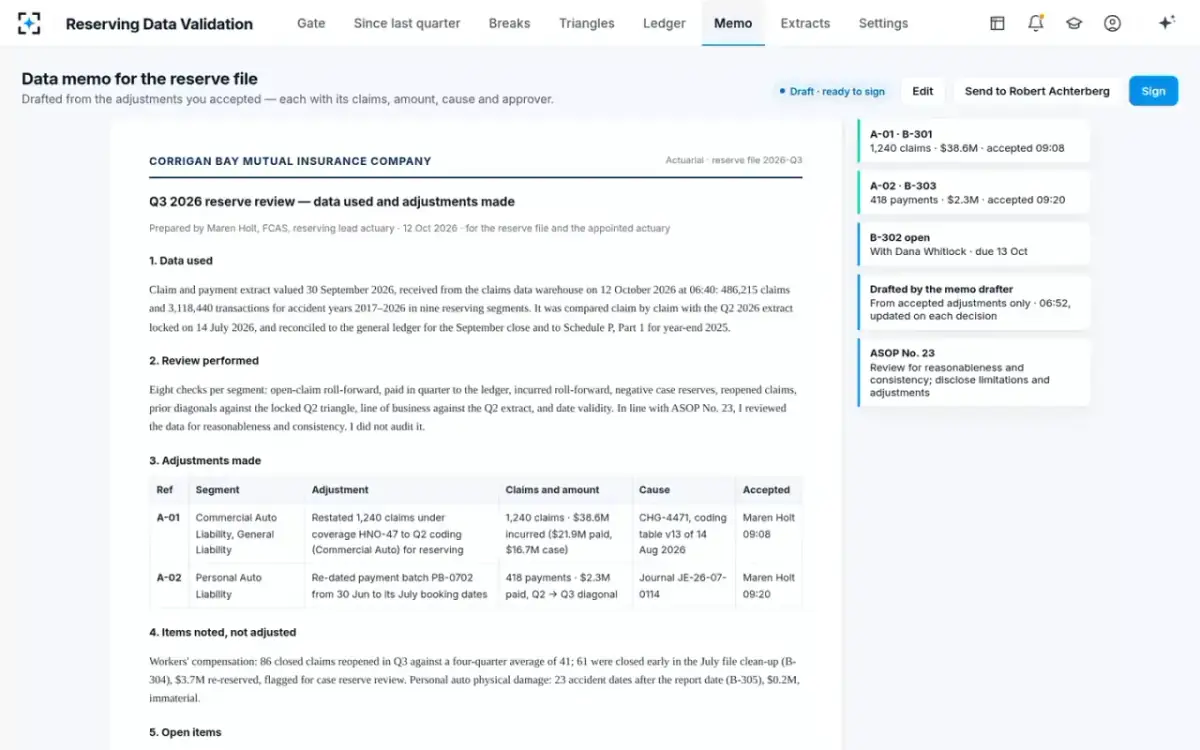
The data memo is the natural home for it. In the sample quarter the memo listed the data used, the review performed, two accepted adjustments with their claims, amounts, causes and approvers, the items noted but not adjusted, the one open item and the data limitations, and was signed by the reserving lead before it went to the appointed actuary.
The data memo: adjustments with their claims, and what was only noted
How to set data quality targets that hold
Start from your own last four quarters, publish the targets with the tolerances behind them, and only ever tighten them. A target set before the baseline is known is either trivial or ignored. Measure four quarters, set each target at or just better than the best of them, and lower it when the process improves.
Three cautions keep the KPIs honest. Tolerances are judgments, so every change to one should be visible with its effect: in Reserving Data Validation, the settings screen shows what a new tolerance would hold on today's extract before it is saved. False holds count against the process, not in its favour, because a check that holds every catastrophe-code update will be switched off. And KPI 1 needs an honest denominator: breaks found after factor review, by the committee, the auditors or next quarter's comparison, must be counted, or the measure will always read 100%. How the checks that produce these numbers sit in front of a team's existing reserving software is covered in data validation software for actuaries, and the checks themselves on the Reserving Data Validation page.
Questions people ask
What is the difference between a data quality metric and a data quality KPI?
A metric measures something, such as the share of claims with a valid accident date. A KPI is a metric chosen because it tracks an outcome the business cares about and is reported against a target, such as days from extract to released triangles. Most reserving teams need many metrics and fewer than ten KPIs.
What is rework in reserving?
Rework is redoing triangles, exhibits, selections or the data memo because a data error surfaced after the work was done. It is the costliest symptom of late data checks; in the fictional sample insurer, one break found in week three of a quarter cost six days.
Should data quality KPIs be reported by segment or in total?
By segment, with the total as a footnote. Recodes and back-dated batches produce offsetting differences that net to nearly nothing in total, so a total-only report can show a clean quarter in which two segments were wrong by the same amount in opposite directions.
Who owns data quality KPIs for reserving data?
The reserving lead usually owns the KPIs and the claims data owner owns the fixes at source. The UK Government Data Quality Framework's principles stress accountability at every level and treating issues at source rather than applying temporary fixes, which maps to that split.
Do Solvency II firms need data quality KPIs?
Solvency II requires insurers to have processes and procedures that ensure the appropriateness, completeness and accuracy of data used for technical provisions, and the actuarial function must assess its sufficiency and quality. KPIs like these are a practical way to show those processes work quarter by quarter.