Prior authorization denial rates vary by program and by service: Medicare Advantage insurers denied 7.7% of prior authorization requests in 2024, Medicaid managed care plans denied 12.5% in 2019, and in June 2024 Medicare Advantage plans denied 12% of requests for skilled nursing facility admission. What the rate cannot show is how many of those denials were wrong, and that is the number a health plan pays for: most denials that are appealed in Medicare Advantage are overturned, and each overturn means reading the case twice, writing two decisions and risking an audit finding. Botminds' Prior Authorization Automation is built to cut the wrong denials rather than the denials: its agents cite the page for every criterion before anyone decides, so a denial reaches a physician only when the chart contradicts a criterion or a named document is truly missing.
Prior authorization denial rates by program: the latest published figure for each
What is the prior authorization denial rate for Medicare Advantage?
7.7% in 2024: Medicare Advantage insurers fully or partly denied 4.1 million of 52.8 million prior authorization determinations, according to KFF's analysis of CMS data (KFF). The rate was 6.4% in 2023 and 7.4% in 2022. Most denials, 73% in 2024, were denials in full; the rest approved part of what was asked, such as 10 of 14 therapy sessions.
The average hides a wide spread. Among the largest Medicare Advantage insurers, the 2024 denial rate ran from 4.2% to 12.8% of requests, and KFF found that insurers with fewer requests per enrollee tended to deny a larger share of them. KFF suggests the differences likely reflect, among other things, which services each insurer subjects to prior authorization and how often it exempts providers. A plan comparing itself to the national figure should compare service by service, which CMS's data cannot yet do: the CMS reporting KFF used is aggregated to the contract level and carries no service type.
Denial rates in Medicaid, post-acute care and the Marketplace
Medicaid managed care denies more often, and post-acute care is denied more often than other services. OIG found that the Medicaid managed care plans it reviewed denied "approximately 2.2 million requests for the prior authorization of services in 2019, which is 1 out of every 8 requests (12.5 percent)", that 12 of the 115 plans had denial rates above 25%, and that most state Medicaid agencies did not routinely review the appropriateness of a sample of denials (OEI-09-19-00350).
For post-acute care the 2026 figures are sharper. In June 2024 the 19 Medicare Advantage organizations OIG reviewed denied 12% of requests for skilled nursing facility admission, with plan rates from 0.4% to 23%, and denied requests for skilled-nursing-level care from nursing home residents 40% of the time (OEI-09-24-00331). In its companion report, the three largest organizations denied long-term acute care and inpatient rehabilitation requests at higher rates than most of their peers (OEI-09-24-00330). The Senate Permanent Subcommittee on Investigations' majority staff reported in 2024 that at one large insurer the post-acute denial rate rose from 10.9% in 2020 to 22.7% in 2022 (PSI staff report); that is a staff finding, not a finding of law.
Marketplace figures are often quoted next to these, and they measure something else. KFF found that HealthCare.gov insurers denied 19% of in-network claims in 2024 (KFF), but those are claims for services already delivered, not prior authorization requests, and only 9% of the in-network denial reasons were missing prior authorization or referral.
How many prior authorization denials are overturned on appeal?
In Medicare Advantage, most of the few that are appealed. In 2024, 11.5% of denied requests were appealed to the insurer, up from 7.5% in 2019, and 80.7% of those appeals were partly or fully overturned; in every year from 2019 to 2024 more than eight in ten were (KFF). For skilled nursing admissions in June 2024, 18% of denials were appealed and 95% of appeals were overturned (OIG). For long-term acute care and inpatient rehabilitation the overturn rates were 36% and 43%, with inpatient rehabilitation overturns ranging by plan from 14% to 86% (OIG).
The pattern is old. OIG reported in 2018 that Medicare Advantage organizations "overturned 75 percent of their own denials during 2014–16, overturning approximately 216,000 denials each year" (OEI-09-16-00410). Those figures covered all appealed preauthorization and payment denials, so they are not directly comparable with KFF's; what they show is that high reversal rates are not new.
What 100 Medicare Advantage prior authorization denials became in 2024
All denials in 2024
- Not appealed · 88.5%
- Appealed · 11.5%
The appealed denials
- Overturned in part or in full · 80.7%
- Upheld · 19.3%
The split shows why the overturn rate is both alarming and incomplete. Nine of every hundred denials were reversed, but almost nine in ten were never tested. If the denials that were appealed resemble the ones that were not, the plan is carrying a large stock of wrong decisions nobody challenged. If providers appeal only their strongest cases, the overturn rate overstates the problem. Neither assumption can be checked from published data.
What the overturn rate cannot tell you
An overturned denial is not proof the first decision was wrong; it may mean the appeal brought evidence the plan never had. KFF says so directly:
“This raises questions about whether the initial request should have been approved, although it could also indicate that the initial request was missing the required documentation to justify the service.”
KFF, Medicare Advantage prior authorization determinations in 2024
The only published study that separated the two found both. OIG physicians and coding experts re-reviewed a sample of Medicare Advantage prior authorization denials from June 2019 and found that "among the prior authorization requests that MAOs denied, 13 percent met Medicare coverage rules" (OEI-09-18-00260). Two causes accounted for most of them: plans applying clinical criteria not contained in Medicare coverage rules, and plans saying a request lacked documentation when the records already in the case file supported approval. The second cause is the one a reading problem creates and a reading tool can remove; the insufficient documentation guide follows it page by page.
Are prior authorization denial rates public now?
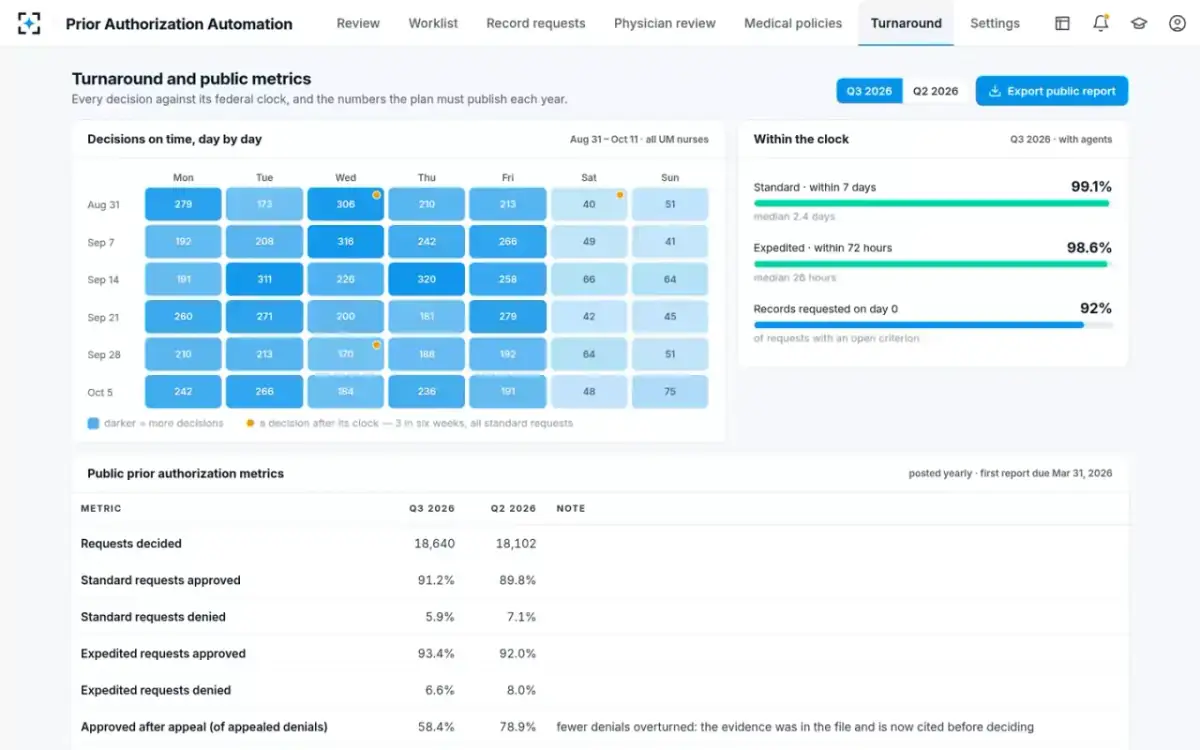
Yes, for Medicare Advantage, Medicaid and the other payers CMS-0057-F covers, at an aggregate level. Since 2026 each Medicare Advantage organization must post, by 31 March for the previous year and at contract level, the percentage of standard and expedited requests approved and denied, the percentage approved after appeal, the percentage approved after an extension, and the average and median decision times (42 CFR 422.122(c)). The first postings, covering 2025, were due on 31 March 2026.
These numbers are aggregated across all items and services, so they will not say which services a plan denies most. KFF reported in January 2026 that CMS was piloting plan- and service-level data collection and anticipated extending it to all plans in 2027. OIG has recommended the same: that CMS regularly collect request-level data including service type and contractor. For now the published metric a plan will be compared on is the approved-after-appeal percentage, which puts every denial the plan reversed on appeal on its public website.
The public prior authorization metrics come from the same screen that counts every decision
Pricing a wrong denial from the plan's side
No public source gives a cost per prior authorization appeal, so a plan has to build its own from five lines, and every input is a number the plan already has. A wrong denial costs the first review that produced it, the reconsideration that reverses it, the risk that a missed clock sends it to the independent review entity anyway, the share of an audit finding it contributes to, and the cost of the delayed care to the member and the provider's time.
The cost of one wrong denial, written as a sum a plan can fill in
First review, wasted
nurse minutes + physician minutes × loaded cost per minute
The original review, which produced a decision that did not stand.
UM operations
Reconsideration
physician reviewer time + appeals staff time + notice
A Medicare Advantage medical necessity reconsideration must be made by a physician with appropriate expertise, within 30 days for a standard pre-service request.
Appeals and grievances
Clock risk
share of reconsiderations decided late × cost of an IRE case
A late reconsideration counts as an affirmation and the file goes to the independent review entity (422.590).
Appeals and compliance
Audit exposure
probability a sampled case is cited × cost of a corrective action plan
CMS program audits test timeliness and whether decisions followed Subpart M.
Compliance
Whatever the inputs, a wrong denial costs more than a right decision, because it is decided twice, the second time by a physician under a second clock. Then multiply by the plan's own count. A plan's approved-after-appeal rate times its appealed denials gives the reversed denials it knows about; the 88.5 in a hundred never appealed are the ones it does not.
The clock line deserves weight. Under 422.590(d), a Medicare Advantage plan that misses the reconsideration deadline is treated as having upheld its own denial, and the file must go to the independent entity (the clocks are laid out in how long a Medicare appeal takes). A wrong denial that is then handled late becomes an external case with the plan's weakest file at its centre.
The numbers behind a wrong denial in Medicare Advantage
80.7%
of appealed prior authorization denials overturned in 2024
KFF, CMS data
11.5%
of denials appealed in 2024
KFF, CMS data
13%
of sampled 2019 denials met Medicare coverage rules
HHS-OIG, 2022
30days
for a standard pre-service reconsideration
42 CFR 422.590
Which services have the highest prior authorization denial rates?
Post-acute care, on the evidence available. OIG's 2026 reports single out skilled nursing, long-term acute care and inpatient rehabilitation, and the Senate staff report found post-acute denial rates at three large insurers far above their overall rates. In the OIG's 2019 sample of denials that met Medicare coverage rules, three service types stood out: advanced imaging such as MRIs and CT scans, post-acute stays, and injections. No public dataset yet gives denial rates by service for all plans; that is what CMS's service-level pilot is meant to supply.
The high-denial services share a feature: their criteria depend on the patient's function and progress, written in therapy notes and nursing assessments spread across a long record. A criterion such as "able to tolerate about three hours of therapy a day" can be met on one page and contradicted on another. Those are the criteria where a reviewer reading under a 72-hour clock is most likely to miss the page, and where a medical necessity file that holds up matters most.
Lowering wrong denials, not denials
A plan that sets out to lower its denial rate can do it by approving more of everything, which is not the goal. The goal is that every denial issued would survive its own appeal. Three changes do most of the work. Before denying for missing documentation, prove the document is absent from the case file. Before denying on a criterion, check that the criterion is Medicare's own or a published internal criterion applied where Medicare's is not fully established. And when a document truly is missing, ask for it on the day the request arrives, by name, so the decision can still be made inside the clock.
A past wrong denial, found in the member's history and not repeated
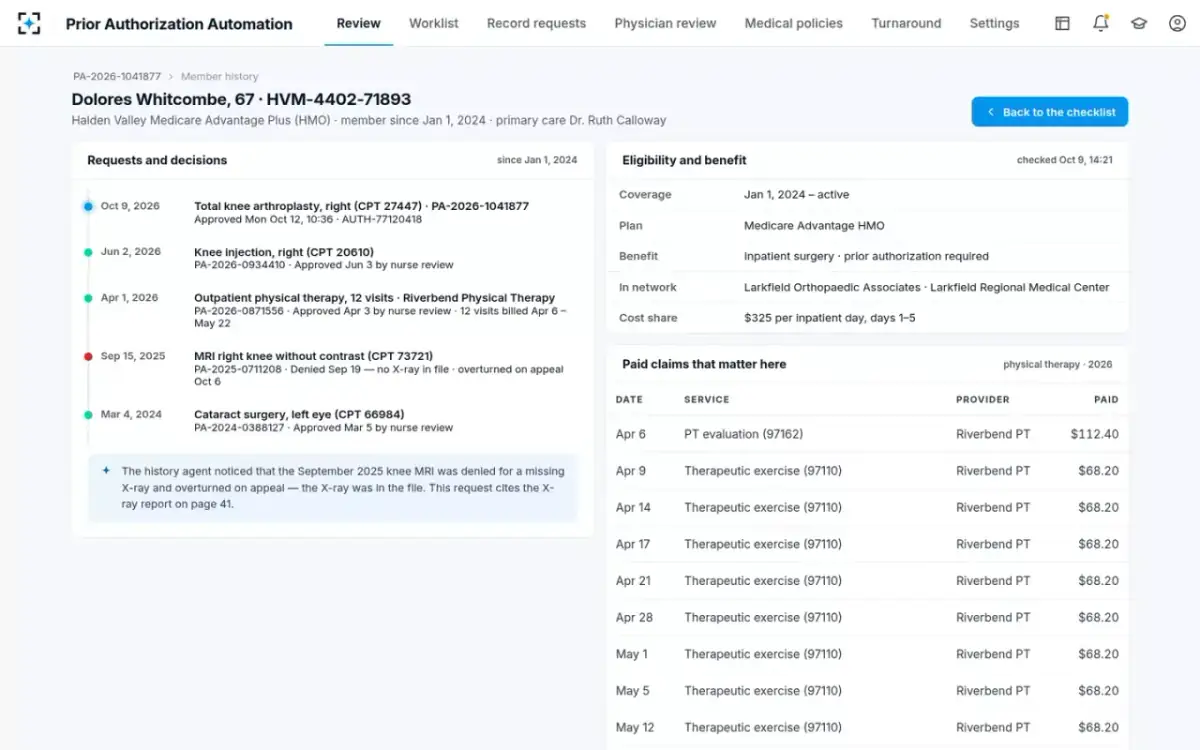
In Prior Authorization Automation those three checks are the agents' default behaviour: the criteria matcher marks a criterion as not found only after listing what it searched, the policy library shows whether each policy is Medicare coverage or plan criteria, and the missing-records agent drafts a request for the named document as soon as a criterion is open. Whether that lowers a particular plan's overturn rate is a question for its own data; a pilot on closed requests replays last quarter's overturned denials to find out.
Questions people ask
What percentage of prior authorizations are denied?
In Medicare Advantage, 7.7% of requests in 2024 were fully or partly denied, according to KFF's analysis of CMS data. OIG found 12.5% in Medicaid managed care in 2019, and 12% for skilled nursing facility admissions in Medicare Advantage in June 2024. Rates differ widely by insurer and by service.
Why are prior authorization denial rates rising?
The Medicare Advantage rate rose from 6.4% in 2023 to 7.7% in 2024, back to roughly its 2022 level of 7.4%; KFF's data do not show why. KFF found that insurers with fewer requests per enrollee generally denied a larger share, so a plan that narrows prior authorization to fewer services may see its rate rise even as its total denials fall.
How much does a prior authorization appeal cost a health plan?
No public source gives a figure, so a plan should compute its own: the wasted first review, the physician-led reconsideration, the risk of a late decision going to the independent review entity, and audit exposure. Every input is in the plan's own staffing and appeals data. A wrong denial always costs more than a right decision, because it is made twice and the second time by a physician.
Do denial rates measure whether a plan is denying correctly?
No. A low rate can hide wrong denials and a high rate can reflect a narrow list of hard services. Overturn rates come closer but still mix wrong denials with appeals that brought new evidence; OIG's 2022 re-review, which found 13% of sampled denials met Medicare coverage rules, is the closest published measure of wrong denials.
Where can I find a health plan's prior authorization metrics?
On the plan's own website: since 2026 each Medicare Advantage organization must post, by 31 March for the previous year and at contract level, its approval, denial, approved-after-appeal and extension percentages and average and median decision times. The first postings were due on 31 March 2026, and the guide to prior authorization metrics reporting shows how each figure is built from request timestamps.