A workload forecasting tool for policy services should answer one question each morning: which open items will miss their promise in the next few days, and what would it take to stop that. It does it by projecting when each item will be finished from three inputs: how much work is arriving, how long each kind of work takes, and who is rostered to do it, adjusted for experience. Queue-level forecasts that say the backlog will grow by a few hundred items are useful for staffing plans; servicing promises are kept or missed item by item, so the forecast has to go down to the item. Botminds' Policy Servicing Analytics forecasts the finish of every open item up to three business days ahead, marks the ones that will pass their promise, and tests a rebalancing plan on request, while the workforce planner decides whether anyone moves.
The worked example comes from a fictional sample insurer, Ashcombe Mutual, on Monday 12 October 2026, with two in-house teams and two outsourcers and 6,842 open items. Every figure from the sample is fictional; the method is general.
One outsourcer's endorsement misses, forecast on Monday for each day to Thursday, and after a tested rebalance
What a workload forecasting tool must answer for policy services
It must name the items that will miss and say why. A forecast that only reports a total, 731 items will miss by Thursday, tells a head of policy services there is a problem; one that lists each item with its promise, its forecast finish and its reason tells the workforce planner what to do. At the sample insurer the reasons fall into two kinds: capacity ("queue position 1,212") and a genuine wait on someone else ("needs lienholder letter", "holder wording to check", "territory re-rate"). Only the first kind can be fixed by moving people.
The forecast also has to cover every team that does the same work. The sample insurer's 731 forecast misses split 164 at one outsourcer, 418 at the other, 112 and 37 at its two in-house teams. A rebalance that only looks inside one team cannot borrow capacity from another, which is usually where the slack is.
The forecast method: arrivals, handle time and the roster
The method is a running balance for each queue, item by item. Each business day, the backlog grows by what arrives and shrinks by what the rostered people can finish; each item's forecast finish is the moment the work ahead of it, plus itself, has been done. Everything else, priorities, tenure, overtime, moved staff, changes one of the terms.
The forecast written as terms: what grows the backlog, what clears it
Arrivals
Forecast requests a day, by request type
Sample: 548 endorsements a day after 1 Oct renewals
From every intake channel
Capacity
Σ people × productive hours ÷ handle time × tenure factor
Sample: 471 endorsements a day finished
From the roster and measured handle times
Backlog tomorrow
Backlog today + arrivals − capacity
Sample: +77 endorsements a day
Per queue
Item finish
Now + (queue position ÷ capacity a day)
Sample: position 1,212 at 471 a day ≈ 2.6 days
Against each item's promise
The sample numbers show how quickly a small gap accumulates. The outsourcer's endorsement arrivals rose to 548 a day after 1 October renewals; it finishes 471. At 77 a day for ten working days, that is 770 more items, close to the 778 its open work grew by between 29 September and the sample Monday, from 1,840 to 2,618. A weekly sheet would have reported the growth once a week; the running balance shows it the day the arrivals change.
Workload demand forecasting: where the arrivals come from
Arrivals are the hardest input and the most predictable one, because much of servicing demand is scheduled by the insurer itself. Renewals generate endorsements, billing questions and cancellations in the weeks around each renewal date; the sample outsourcer's endorsement arrivals rose to 548 a day after 1 October renewals. Rate changes, form changes and policy conversions generate calls and change requests when their notices land. Mortgagee changes can arrive in batches when a lender transfers its loan servicing.
A workload demand forecast therefore starts from two sources: history by request type and day of the week, and the insurer's own calendar of renewals, notices and conversions. The second is often missing from forecasts built inside operations, because the renewal and notice calendar sits with underwriting and product teams. Feeding it in explains spikes that a model working from history alone would treat as noise.
Why forecast item by item, not queue by queue
Because promises belong to items. An add-driver request at queue position 1,212, with the queue clearing about 471 a day, will be reached in about 2.6 working days; its two-business-day promise expires on Tuesday afternoon, and the forecast finish is Wednesday. A dwelling limit increase at position 1,566 is reached in about 3.3 days, a day after its Wednesday-morning promise. Both are on the sample forecast, with exactly those dates.
Promise risk in Policy Servicing Analytics: every item that will miss, its promise, its forecast finish and why
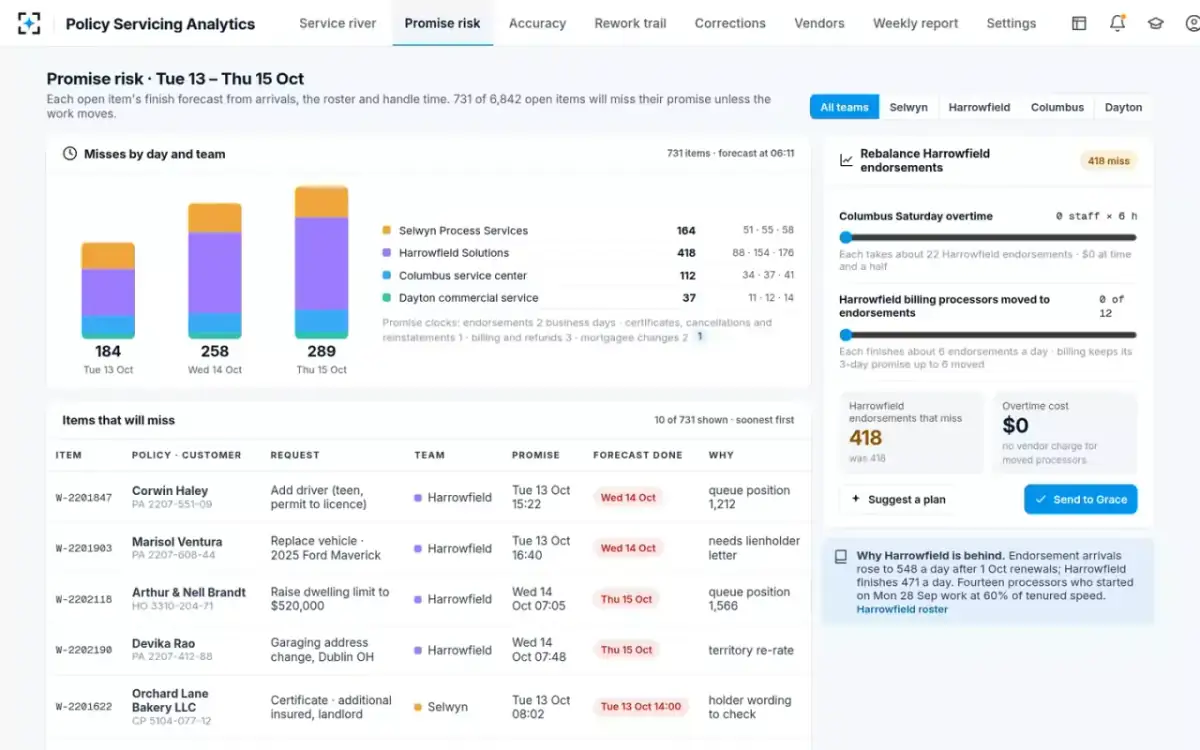
Item-level forecasting also catches the requests whose promise is shorter than the queue's average. Certificates and cancellations carry one-business-day promises at the sample insurer, so a certificate queue can miss while its team's overall backlog looks steady; one outsourcer's certificates were forecast to produce 96 misses by Thursday. A queue-level forecast averages them away.
New starters and tenure: capacity is not headcount
Capacity is people times productive hours divided by handle time, and new people have longer handle times. At the sample outsourcer, 14 processors who started on 28 September were working at 60% of tenured speed. Counting them as full heads would overstate the line's capacity and understate its misses, which is the most common way a forecast built from headcount goes wrong.
Tenure also links the forecast to accuracy. The same 14 new starters were 82.2% accurate on endorsements against 98.0% for tenured staff, so some of their output came back as rework that took capacity elsewhere. A forecast that ignores rework counts the same transaction as finished twice, once when it is keyed wrongly and once when it is fixed; how rework is attributed is set out in the rework rate formula.
Testing a rebalance on paper before anyone moves
A forecast earns its keep when it can test a fix. On the sample Monday the head of policy services asked for a plan for the outsourcer's endorsements, and the solution proposed two moves: overtime for 12 in-house processors, each taking about 22 of the outsourcer's endorsements, at a cost of $4,536 at time and a half; and 6 of the outsourcer's 12 billing processors moved to endorsements, each finishing about 6 a day, which billing could absorb and still keep its three-day promise. Together they add about 264 + 108 = 372 endorsements of capacity over the three days, and the forecast misses fall from 418 to 46.
A rebalance tested in Policy Servicing Analytics: misses and overtime cost before anyone moves
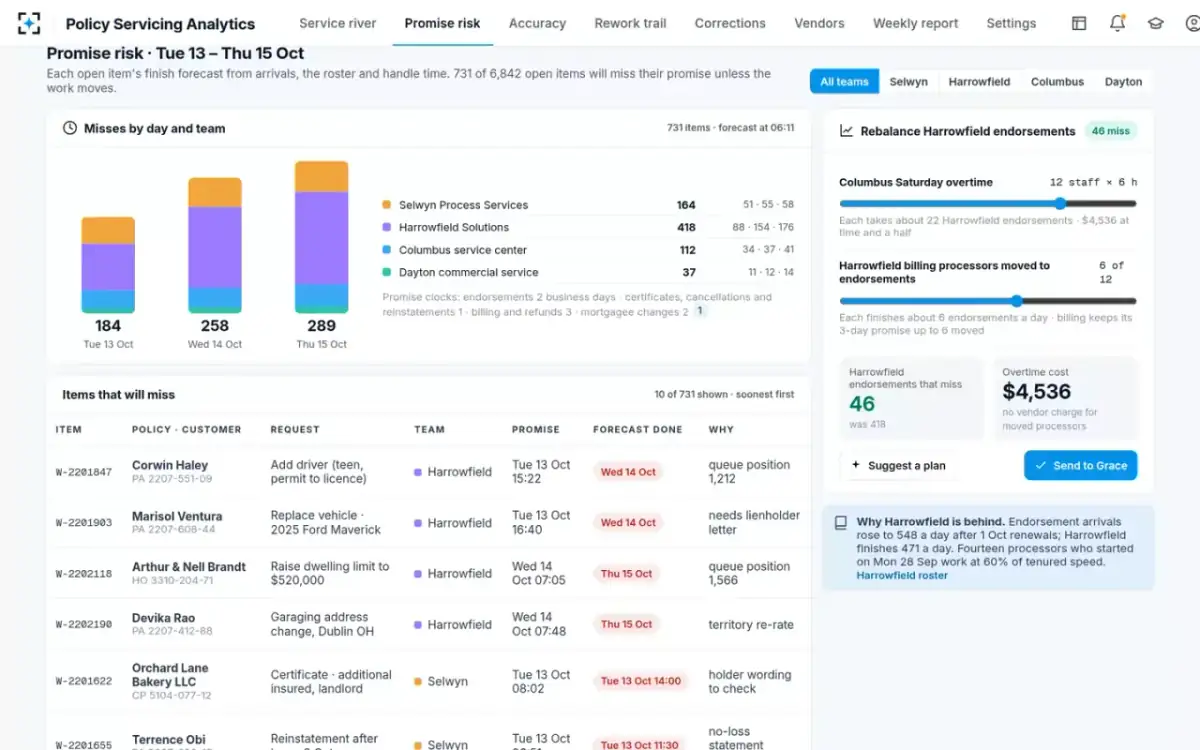
Two details make the test trustworthy. The plan shows its own cost and its effect on the lines it borrows from, so nobody fixes endorsements by breaking billing. And the plan is a proposal: the Promise forecaster never moves work, and the sample plan waited for the workforce planner's approval. The examiners' procedure for policyholder requests asks them to check that requests are handled as soon as reasonably possible (NAIC Market Regulation Handbook, 2017 edition, Policyholder Service Standard 5; the same test applied to one emailed request is in endorsement request email); a rebalance tested on Monday is the practical meaning of "reasonably possible" for a queue that will otherwise miss on Tuesday.
Workload forecasting in Excel: what a spreadsheet can and cannot do
A spreadsheet can run the queue-level balance well: one row per day, columns for arrivals, capacity and backlog, and a formula for each. It can also hold the roster and a tenure factor. Where it struggles is the item level, the thousands of open items each with its own received time, promise clock and reason, refreshed during the day, and the comparison of the forecast with what actually happened, which needs the same items read again.
The inputs are the same either way, and they are the part worth getting right first: arrivals by request type and day of the week, measured handle times by request type and tenure, the roster with start dates, and each request type's promise clock from first receipt. A spreadsheet built on measured handle times will beat a tool built on assumed ones.
Backlog report template: what the morning report should show
A backlog report template for policy services, line by line
- Open items by team and request type
From every system where work arrives, with work caused by other teams' errors shown separately.
- Change since the last report, and why
Arrivals against finishes per queue: the sample outsourcer's endorsements at 548 in and 471 out a day.
- Items forecast to miss, by day
For the next three business days, by team: 184, 258 and 289 on the sample.
- The reason for each miss
Capacity, or a named wait on a customer, lender or holder.
- The oldest open item per request type
Averages hide the item that has waited a week.
- Refunds against their legal limit
Tracked separately from the internal promise, because the statute's clock may start on a different date.
- The proposed rebalance, with its cost
Misses before and after, overtime cost and the effect on the lines that lend people.
- Who has approved what
The workforce planner approves moves; the head of policy services signs the report.
How to tell whether the forecast is any good
Compare what it said with what happened, every day, at the item level. For each day in the horizon, count the items it forecast to miss that did miss, the ones it forecast to miss that finished on time, and the misses it did not see. The first number should be high and the last low; if the misses it did not see share a cause, such as a request type whose handle time was underestimated, the input is wrong, not the method.
Run the check before relying on the forecast, ideally over a few weeks of your own queues, and keep running it. The forecast in Policy Servicing Analytics shows the arrivals and capacity behind every number, so a planner can see which input moved when a forecast was wrong. A four-week test of the whole servicing view, forecast included, is laid out in the operations dashboard guide; to see the forecast on sample data, start from Policy Servicing Analytics.
One Monday morning: the forecast is ready two hours before anyone has to decide
- Read, check, link, forecast, draft14 min
- Before anyone opens it06:00 to 08:10
- Read, decide, sign31 min
Questions people ask
What is workforce forecasting?
It is projecting the work that will arrive and the people and hours needed to do it, over a horizon from hours to months. For policy servicing the short horizon matters most: which promises fail in the next few days at the current roster, and what change would prevent it. Longer horizons feed hiring and outsourcing decisions.
How is forecasting back-office workload different from forecasting call center workload?
A call centre staffs to calls arriving in short intervals, and an unanswered call is abandoned. Back-office servicing work waits in a queue, so the question is not how many people are needed this half hour but when each waiting item will be finished and whether that is before its promise.
What is the backlog management index?
It is items closed divided by items opened in a period, times 100: above 100 the backlog is shrinking, below it growing. On the sample, the outsourcer's endorsements ran at 471 finished against 548 arriving a day, an index of about 86.
How far ahead can a backlog forecast see?
As far as the inputs stay stable. The sample insurer forecasts three business days ahead, long enough to rebalance and short enough that arrivals and the roster are known; it alerts when forecast misses in that horizon pass 100 for any team.
Can a workload forecasting tool move work automatically?
It could, but it should not without a person. In the sample the forecaster proposes and tests a plan, with its cost, and the workforce planner approves it; moving people between lines affects other promises, contracts and staff, and those are judgements to sign for.