A useful insurance operations dashboard template for policy servicing has five panels: open work by team and request type, the items that will miss their promise, accuracy measured on finished work, rework traced to the team that caused it, and each outsourcing contract against its terms. The template is the easy part. The hard part is whether the numbers in it come from the systems where the work happens, refreshed while the day can still change, or from a weekly spreadsheet that each team fills in about itself. A template is worth adopting only after it has been tested on four weeks of your own queues and finished work. Botminds' Policy Servicing Analytics builds that view from the insurer's queues every 15 minutes rather than from weekly sheets, and a pilot on a sample of your own data shows whether its numbers tie out.
The screens and numbers on this page come from a fictional sample insurer, Ashcombe Mutual, with two in-house teams and two outsourcers. The regulatory examples are Florida market conduct examinations and the NAIC's examination standards, linked where quoted.
“…the data used for MCAS reporting is not a live or production system, but is updated daily from the production system; it is not static.”
Imperial Fire and Casualty Insurance Company, responding to Florida's examiners, 2016
An insurance operations dashboard template for policy servicing: the panels that matter
Each panel should answer a question someone acts on the same day, and each number should open the items behind it. The template below is the one the sample insurer's head of policy services reads every morning; the definitions matter more than the layout, so they are written out.
The five panels of a policy servicing operations dashboard, defined
| Panel | What it shows | Defined as | Who acts on it |
|---|---|---|---|
| Backlog | Open items by team and request type, ten working days back | Every item received and not finished, from every policy, billing and service system and each vendor's work log | Head of policy services |
| Promises at risk | Items forecast to miss their promise in the next three business days | Forecast finish from arrivals, the roster and handle time, against a promise clock that starts at first receipt | Workforce planner |
| Accuracy | Measured accuracy per team and request type, beside each vendor's reported figure | Finished transactions matching their request and not redone within the rework window | Quality analyst |
| Rework by source | In-house work caused by other teams' wrong transactions | Later changes to the same policy and field, linked to the first transaction, minus changes the customer asked for, plus the calls, reprints and notices they caused | Team leads and vendor manager |
| Contracts | Each outsourcing term against what was measured, and the credit it implies | The contract schedule's own floor, unit, rate and cap | Vendor manager |
The definitions column is where most templates fall short. A backlog that counts only items a vendor has picked up hides the ones waiting to be assigned. An accuracy figure from the vendor's own sample is a different measure from one on every transaction. A rework count that does not link the correction to its source charges the team that fixed the error. The KPI definitions are set out in full in policy servicing KPIs and metrics.
Insurance operations dashboard examples: three readers, three views
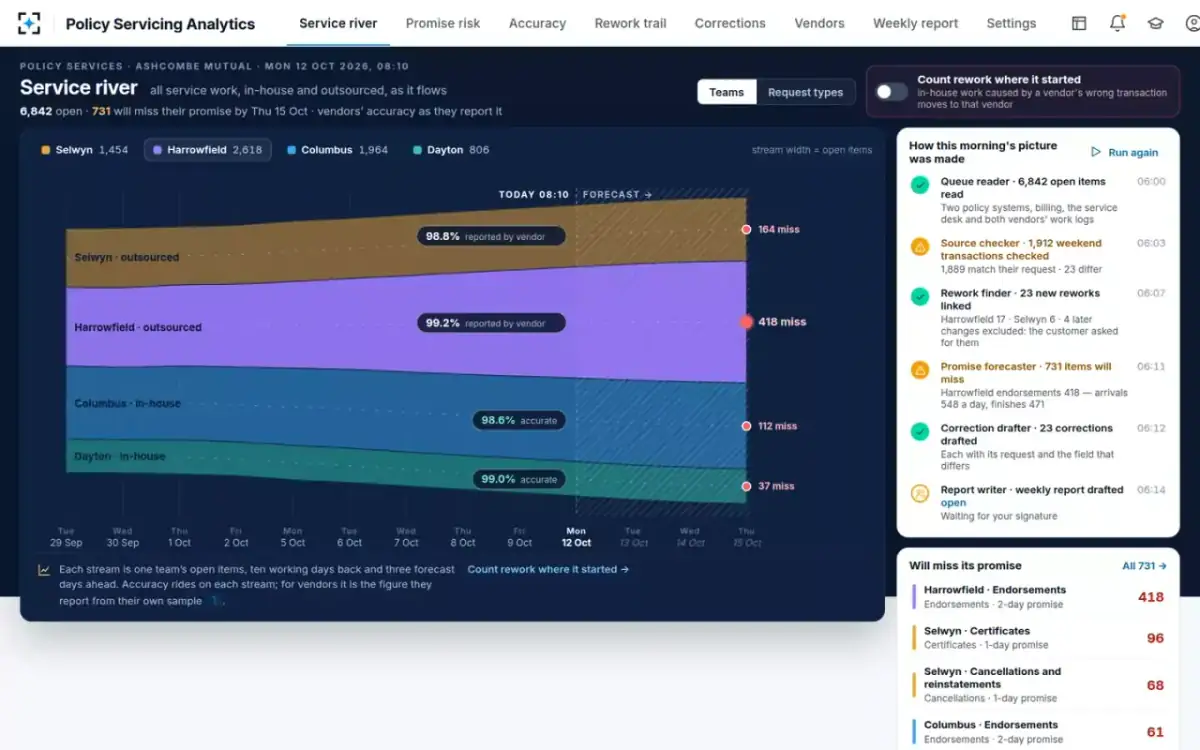
The same five panels serve three readers, and each starts somewhere different. The head of policy services starts from the whole picture: every team's stream of open work, with accuracy riding on each and the forecast misses at the right edge. The vendor manager starts from the contracts panel. The workforce planner starts from promises at risk, item by item, with a rebalance tested before anyone moves.
The head of policy services' view in Policy Servicing Analytics: all service work as one river
Why a dashboard template in Excel or Power BI goes stale
A template fails when it is filled from copies of the data rather than from the systems that hold the work. Weekly spreadsheets are the common case: each team reports its own backlog and accuracy once a week, so by the time the sheet shows a backlog, the promise is already missed. A business intelligence tool connected to a reporting extract is better and still fails the same way if the extract lags, or if it was built for one purpose and reused for another.
Florida's examiners found exactly that in regulatory reporting. In a 2016 target examination of the data behind the Market Conduct Annual Statement, they found Imperial Fire and Casualty "made 6 report line errors in the filing of the 2011 MCAS Private Passenger Automobile Report, 5 errors in the filing of the 2012 MCAS Private Passenger Automobile Report and, 14 errors maintaining complete records of complaints received from consumers." The company's explanation, quoted at the top of this page, was that the reporting data was a daily copy of the production system that kept changing (Florida Office of Insurance Regulation, target examination of Imperial Fire and Casualty Insurance Company, 5 April 2016).
A second Florida examination the same month found First Protective Insurance Company had made "27 report line errors in each of the 2011 and 2012 MCAS Homeowners Reports and 26 errors maintaining complete records of complaints received from consumers," and recommended that "the Company adopt policies and procedures to improve reporting accuracy" (Florida Office of Insurance Regulation, target examination of First Protective Insurance Company, 22 April 2016). The NAIC standard behind both is one line: data reported to a department must be complete and accurate (NAIC 2024 Market Regulation Handbook examination standards, Operations/Management Standard 18; how examiners test it against MCAS is in the MCAS filing requirements). An operations dashboard is not a regulatory filing, but it draws on the same systems, and the same discipline applies: the number on the screen should tie back to the system where the work happens.
What does a servicing dashboard need underneath it?
It needs every place work arrives and is finished, read often enough to change the day. At the sample insurer that is two policy systems (a core migration is under way, so both are live), billing, the service desk and mailbox where requests arrive, each outsourcer's work log with the vendor's own item number kept beside the insurer's, the staffing rosters with tenure, and the outsourcing contracts. The queues are read every 15 minutes.
It also needs the requests themselves, not just the transactions. Accuracy cannot be measured from the policy system alone, because the policy system holds what was keyed, not what was asked. The comparison of each finished transaction with the email, PDF, portal form or call note that started it is what turns an activity dashboard into a quality one.
How to test a dashboard template on four weeks of your own queues
Test it the way an examiner would test a report: does each number tie to the system it claims to come from, and does it say something the team did not already know? Four weeks is long enough to cover a month-end, a full contract measurement period and a run of forecasts that can be compared with what happened. The plan below is our suggested shape for that test, not a fixed product schedule.
A four-week test of a servicing dashboard on your own data: what is checked each week
- Read every queueWeek 1
- Check every transactionWeek 2
- Forecast promisesWeek 3
- Contracts and reportWeek 4
- Counts tie to each systemTie-out
- Differences you agree withAccuracy
- Forecast vs what happenedMisses
- A credit and report you would signSign-off
Week one is the tie-out: open items by team and request type should match each source system's own count for the same moment, with every difference explained. Week two puts the accuracy check in front of the quality analyst, who reads the differences it found and says which are real; if the analyst disagrees with many, the definition of an error needs work before anything else. Week three runs the promise forecast every morning and compares it with what actually missed. Week four computes each contract's credit on the measured month and produces a weekly report the head of policy services would sign.
What to have ready before the dashboard pilot
Inputs for a four-week dashboard test, and why each one matters
- Queue exports or read access for every system where work arrives or is finished
Both policy systems during a migration, billing, the service desk and mailbox: a backlog that misses one system is not a backlog.
- Each outsourcer's work log, with its item numbers
Without the vendor's identifiers a wrong transaction cannot be linked to its request or its rework.
- Finished transactions with their source requests
Emails, PDFs, portal forms and call notes: accuracy is measured against what was asked.
- Staffing rosters with start dates
The forecast needs who is on each line; accuracy by tenure needs start dates.
- Your promise clocks per request type
Business days, and when the clock starts: first receipt, not vendor pickup.
- The outsourcing contracts' measurement schedules
Floors, units, rates, caps, rework and dispute windows, so credits are computed as written.
- One person who can say what counts as an error
Usually the quality analyst: the test is only as good as the agreed definition.
How to judge the pilot: numbers that tie out, and numbers you did not have
Judge it first on whether its numbers are right, then on whether they are new. The NAIC's examiners' handbook makes the first point about samples in words that apply to any dashboard: "No amount of rigor in sample design can surmount data that is inaccurate: a valid sample drawn from inaccurate data will still produce invalid conclusions" (NAIC Market Regulation Handbook, 2017 edition, Chapter 14, Data Verification). A beautiful chart on an extract that does not tie out is worse than the weekly sheet, because it is believed.
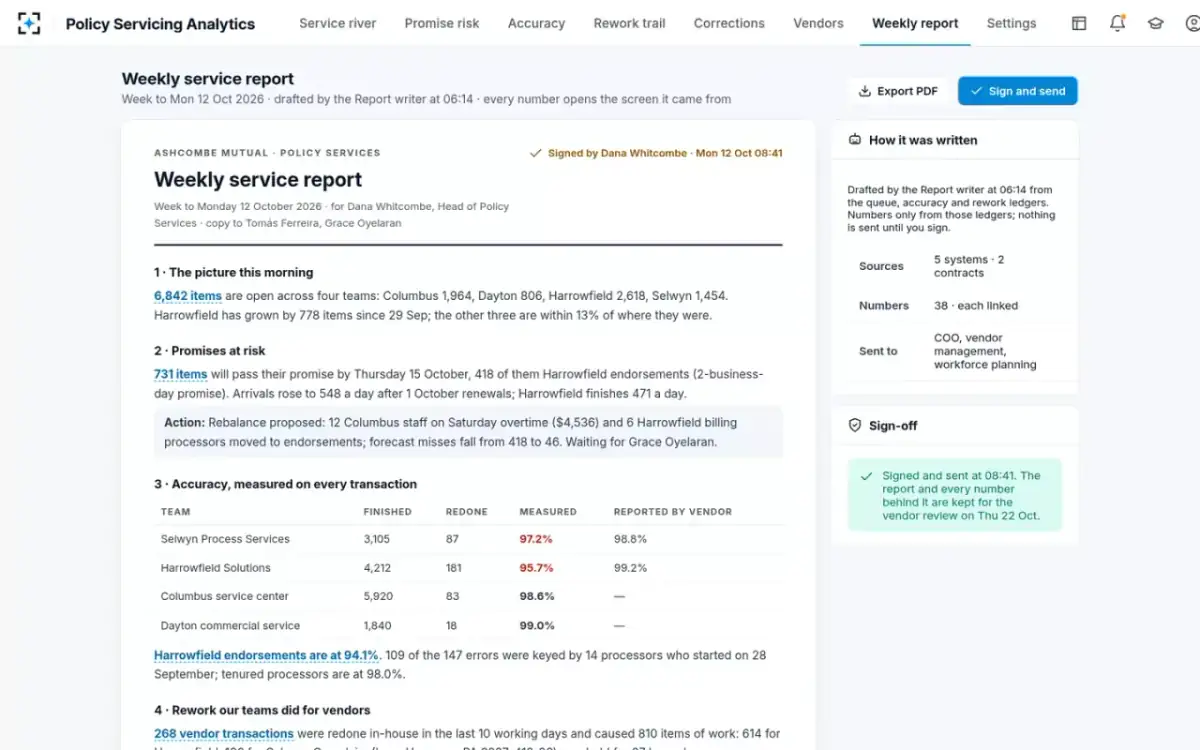
The second test is whether the pilot shows something the weekly sheets did not. On the sample data, three things appear only once every transaction is checked and every rework linked: the two outsourcers' measured accuracy (95.7% and 97.2%) against what they report (99.2% and 98.8%); 810 items of in-house work that exist only because a vendor's transaction was wrong; and 731 items forecast to miss their promise by Thursday, seen on Monday, with 418 of them in one vendor's endorsements.
The weekly service report, drafted from the dashboard and signed: every number linked to its screen
Where the hours go: a week of service oversight, before and after
The time a dashboard saves is mostly time spent assembling it. For a head of policy services and a quality analyst at the sample insurer, Botminds estimates a week of oversight at about 28 hours by hand: collecting and merging each team's sheet, sampling finished transactions, tracing in-house rework back to a vendor, preparing the vendor review and writing the weekly report. With the solution the estimate is about 4.5 hours, and the mix changes: most of what remains is the quality analyst ruling on what the check found.
A week of service oversight: where 28 hours go by hand, and where 4.5 go with Policy Servicing Analytics
By hand, 28 hours
- Merging sheets, 6 h · 21%
- Sampling by hand, 10 h · 36%
- Tracing rework, 5 h · 18%
- Vendor review, 4 h · 14%
- Report, 3 h · 11%
With the solution, 4.5 hours
- Sheets, 0.5 h · 11%
- Ruling on differences, 2 h · 44%
- Rework, 0.5 h · 11%
- Vendor review, 1 h · 22%
- Report, 0.5 h · 11%
Insurance operations analytics software or a template: where the solution fits
A template in Excel or a business intelligence tool is the right choice when the numbers already exist in one clean source and the question is how to display them. It is the wrong choice when the numbers do not exist yet: accuracy against the request, rework linked to its source, and a forecast of which items will miss their promise all have to be computed, every day, from several systems. That computation is what Policy Servicing Analytics does; its screens are the display of it.
It does not replace the insurer's business intelligence platform for finance or underwriting reporting, and it does not write anything back. It reads, measures, forecasts and drafts; people approve rebalancing, rule on disputed reworks and sign the report. If a pilot shows that your queues and transactions already produce trustworthy numbers in an existing tool, the template on this page is yours to use there. To see the dashboard on sample data, start from Policy Servicing Analytics; to see the forecast behind the promises panel, read the workload forecasting guide.
Questions people ask
Can I build an insurance operations dashboard in Power BI?
Yes, if the measures it displays already exist in a source it can read. Backlog counts usually do; measured accuracy, rework linked to its source and promise forecasts usually do not, because each must be computed from the requests, the transactions and later changes together. Those computed measures can be exported to a BI tool once they exist.
Is there an insurance operations dashboard template in Excel?
The five panels and definitions on this page work as a spreadsheet layout. The limit is refresh: a sheet filled once a week from each team's own figures shows a backlog after the promise is missed, which is the problem the sample insurer started with.
How often should a servicing dashboard refresh?
Often enough to move work the same day. The sample insurer reads its queues every 15 minutes and forecasts three business days ahead, with an alert when forecast misses in the horizon pass 100 for any team; a one-day promise clock cannot be managed from a nightly refresh.
What should an insurance operations dashboard show for outsourced work?
The same panels as for in-house work, measured the same way, plus each contract's terms against the measured month. On the sample data that shows one vendor's endorsements 81.4% on time against a two-business-day promise, and its accuracy credit if the month closed that day.
What is the difference between insurance operations analytics software and a dashboard tool?
A dashboard tool displays measures; operations analytics software computes them from the underlying work. For servicing, the computation is the hard part: comparing each transaction with its request, linking corrections to their source and forecasting finishes item by item.