A life insurance placement rate is the share of applications, or of approved cases, that become paid policies in force; the rest are withdrawn before the policy issues, declined or postponed by underwriting, or not taken when the policy arrives. Placement matters to a new business department because the losses are not random: an applicant who waits weeks for a decision has weeks to accept another carrier's offer. The Society of Actuaries' 2022 survey of accelerated underwriting practices at 24 companies, written by Milliman actuaries, found fully underwritten applications were withdrawn more often (15%) than accelerated ones (13%) and not taken slightly more often. What a single waiting day costs, though, can only be measured on a carrier's own cases. Botminds' New Business Case Management is built to take days out of the wait, and this guide shows how to measure whether that is worth paying for.
Placement curves and cases on this page come from a fictional sample carrier, Cedarbrook Life, in the solution; the survey figures are linked where they appear.
Fully underwritten applications are withdrawn and not taken more often
What is a life insurance placement rate?
A placement rate is placed policies divided by a base, and the base must be named. Divided by applications received, it measures the whole funnel: underwriting declines, withdrawals and not-takens together. Divided by approved cases, it measures what happens after the underwriter says yes, which is where the producer and the case manager have the most influence. Both are useful; mixing them in one trend line is not.
The outcomes behind a placement rate, defined
| Outcome | What happened | Where it is usually recorded |
|---|---|---|
| Placed | Policy issued, delivered, first premium paid and accepted | Policy administration |
| Withdrawn | The applicant withdraws the application, before or after the underwriting decision but before issue | New business |
| Declined or postponed | Underwriting will not offer coverage now | New business |
| Not taken | The policy is issued but the applicant does not sign for it, or returns it during the free look | Partly new business, partly in-force administration |
| Incomplete | Closed for missing requirements; often counted inside withdrawn | New business |
Withdrawn and not taken: what the actuaries measured
The best public measurement comes from the Society of Actuaries' 2022 survey of accelerated underwriting practices, which polled 24 direct writers and was written by actuaries at Milliman, a consulting firm. It defined withdrawn as "when the applicant withdraws their application either pre- or post- underwriting decision", and reported that "The average withdrawal rate across AU eligible policies was 13%. This compares to a withdrawal rate of 15% on fully underwritten policies." On not-takens: "The average not taken rate for 2019 to 2022 across AU eligible applications ranged from 5% to 6% while the not taken rate for fully underwritten applications in these years ranged from 6% to 7%."
Three cautions keep those numbers in proportion. The sample is 24 companies that run accelerated programs, not the whole market. The difference between the two paths is small in averages and large between companies: the report's detailed tables put fully underwritten withdrawal averages at 13% to 18% across years and age groups, and individual companies from 2% to 33%. And the comparison is not a controlled experiment: accelerated-eligible applicants are younger and healthier by design, and the report found withdrawal rates were typically lower for applicants under 40 in both groups. The survey shows that waiting paths lose more applicants; it does not say how much of the loss the waiting caused.
Where accelerated-eligible applications ended up
The same survey traced the outcome of accelerated-eligible applications in 2021. On average almost three in four were issued, about one in six was not taken or withdrawn, and fewer than one in ten was declined or postponed.
Decisions on accelerated-eligible applications, 2021 averages
All accelerated-eligible applications
- Issued · 74%
- Not taken or withdrawn · 17%
- Declined or postponed · 8%
Read the middle segment as the size of the prize. Even on the fastest path in the industry, about a sixth of applications ended with the applicant walking away. A fully underwritten path, with weeks of waiting instead of hours, starts from that baseline and adds whatever the wait costs.
What is a good placement rate in life insurance?
There is no public standard, and no regulator or independent study publishes current placement rates for fully underwritten life business. The spreads in the Society of Actuaries survey explain why a single benchmark would mislead: one company's fully underwritten not-taken rate was 1% and another's 40%. Product, price competitiveness, distribution channel and the age of the applicants move placement as much as service does.
A good placement rate is therefore a trend against yourself, cut the same way every quarter: by channel, face band, age band and the class offered against the class applied for. In the fictional sample carrier's report, 69% of approved fully underwritten cases were placed in the third quarter of 2026. That figure means nothing on its own; the same figure split by days to decision is where the argument for faster case management either holds or fails.
Does the free look count as not taken?
In the Society of Actuaries survey it does. Its definition of not taken reads: "The applicant receives the policy but opts not to sign it or surrenders during the free-look period." The report adds a warning every analyst should heed: the second part "might be difficult for companies to retrieve since it often resides in the inforce admin system rather than the new business system."
That sentence is a measurement instruction. A placement rate built only from the new business system will overstate placement by every policy returned in its free-look window, commonly at least ten days, and 30 days for replacements under the NAIC's model and for buyers aged 60 and over in California. Join the in-force system's free-look returns back to the application before reporting. The clocks that start at delivery, and who owns them, are set out in life insurance policy delivery requirements.
How does cycle time affect placement? Build the curve
Sort every approved case by its days from application to decision, group them, and compute placement for each group. The result is a placement-by-days curve, and it is the single most persuasive chart a new business department can show its distribution partners, provided it is read honestly.
A sample carrier's placement by days to decision, before any adjustment
The sample curve falls by seven to nine points a week across its middle, roughly a point a day. It is tempting to call that the cost of a day. It is not, yet. A case that took five weeks is more likely to be a large face amount (more requirements), an older applicant (more requirements, and more withdrawals in the survey data), or an impaired life with an APS and a rated offer. Each of those lowers placement on its own, whether or not the case was slow.
Correlation is not cost: what to strip out first
Compare like with like before pricing a day. The most important control is the offer: an applicant offered a higher premium than they applied for is weighing a different deal whatever the wait, and rated cases are slow because the evidence that rates them is slow. Comparing slow and fast cases within the same offer outcome removes most of that bias.
Two readings of the same placement-by-days curve
The naive reading: All approved cases, grouped by days to decision
The controlled reading: Only cases approved as applied, then separately cases rated or changed
The naive reading: Large and older cases sit mostly in the slow groups
The controlled reading: Within one face band and one age band at a time, then weighted back together
The naive reading: Channels with slower producers drag the slow groups down
The controlled reading: Within channel, or with channel as a control
The naive reading: Missing if read from the new business system only
The controlled reading: Joined back from in-force administration
The naive reading: Everything that differs between fast and slow cases
The controlled reading: Closer to what waiting itself costs
The controlled slope is likely to be flatter than the raw one, because the controls remove differences that lower placement on their own, and that is fine: it is the number a business case can survive an actuary reading. If the controlled curve is flat, faster case management will not raise placement much, and the case for it rests on staff time and producer satisfaction instead. If it still falls, the slope prices the day.
The price of a waiting day, worked
Once the controlled slope exists, the arithmetic is short. Multiply the placement lost per day by the approved cases that wait, by what a placed case is worth. Use annual premium if distribution reports in premium, or the carrier's own value of new business if finance does.
What one average day of waiting costs: price of a day = slope × volume × value
| Input | What it is | Illustration | Who supplies it |
|---|---|---|---|
| Slope | Placement points lost per day of waiting, from the controlled curve | 0.5 points a day, half the raw sample slope | New business analytics |
| Volume | Approved fully underwritten cases a year | 5,000 cases | New business |
| Value | Annual premium, or value of new business, of a placed case | $3,000 a year | Finance or distribution |
| Price of a day | Slope × volume × value | 0.5% × 5,000 × $3,000 = $75,000 of annual premium a year for each day the average case waits | The business case |
The formula also shows where the effort pays. Days removed from cases that would have been placed anyway are worth nothing; days removed from the middle of the curve, where the applicant is still deciding, are worth the most. That is why the order-on-day-zero and same-day stall rules matter more than shaving the underwriter's review: the waits they remove are the long, silent ones in the middle of a case. The full measurement of where those days sit is in life insurance cycle times.
Raising placement without changing the offer
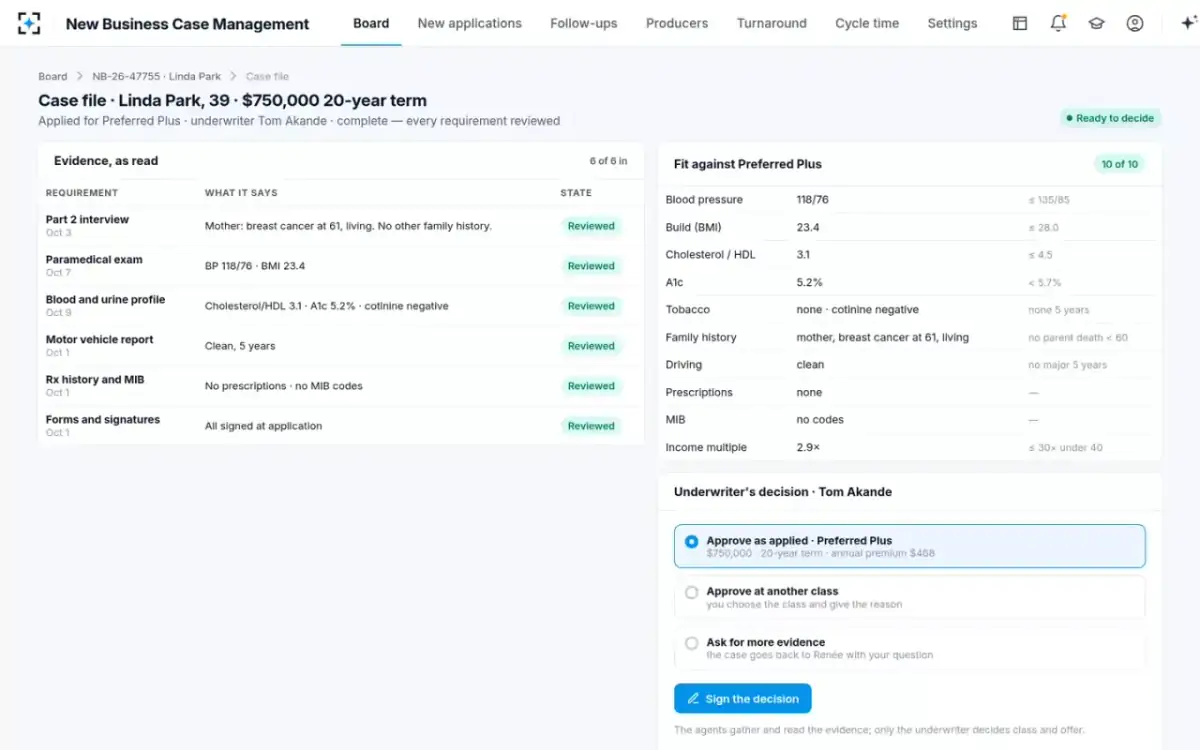
Case management can shorten the wait and keep the applicant informed; it cannot change the price, the class or the product. In New Business Case Management the agents order every requirement as the application is read, flag stalls the day they happen with the reason, and give the producer a written status (done, waiting on, needs you, expected date) without medical details. The underwriter decides the class and the offer, and nothing in the solution touches either.
The question that decides placement: 'will there be a decision this month?'
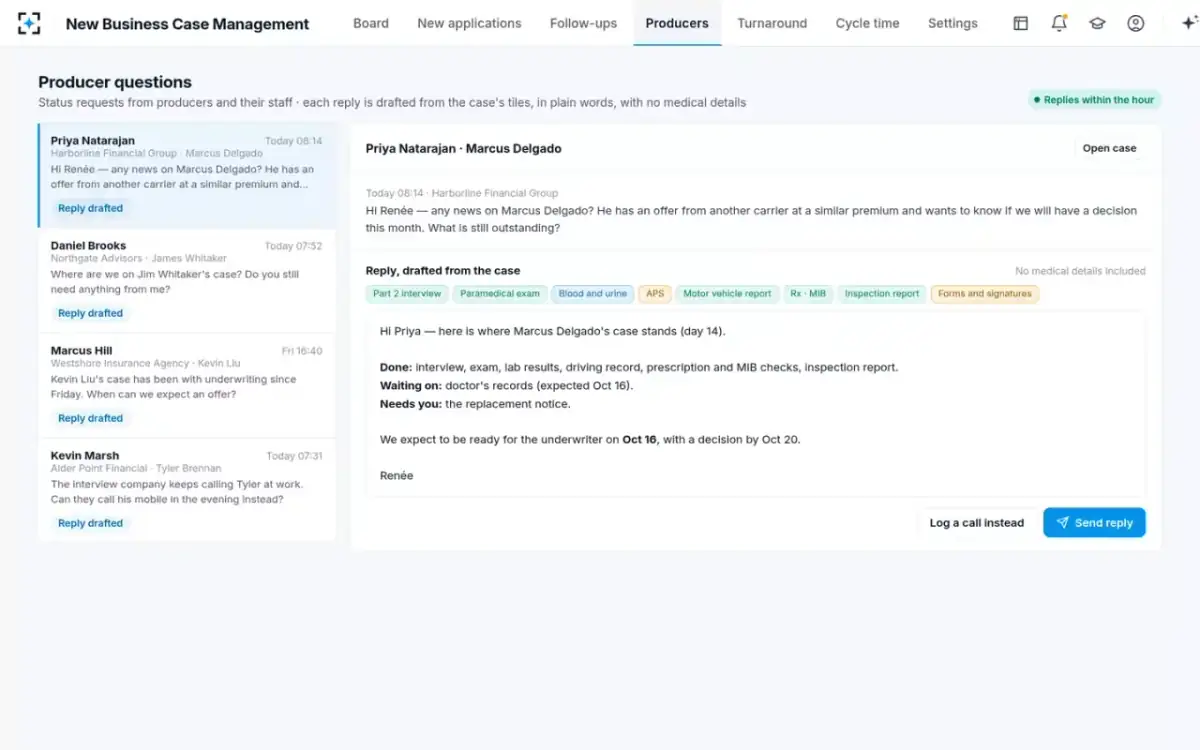
The producer's message is the placement problem in miniature. Marcus Delgado has another carrier's offer at a similar premium; what keeps him is a credible date. On the sample case the reply gives one: doctor's records expected 16 October, a decision by 20 October. Whether a date like that changes the outcome is exactly what the controlled curve measures, case by case, quarter by quarter.
The offer itself stays the underwriter's
Questions people ask
How is a life insurance placement rate calculated?
Placed policies divided by a named base: all applications received, or approved cases only. On approved cases it is placed ÷ (placed + withdrawn after approval + not taken). Free-look returns belong in not taken, which means joining in-force administration data back to the application.
What is the difference between placement rate and approval rate?
Approval rate is the share of applications the underwriter approves; placement rate is the share that become paid policies in force. A carrier can approve most applications and still place far fewer if applicants withdraw while waiting or decline the policy when it arrives.
What does not taken mean in life insurance?
The policy was issued but the applicant did not accept it, either by not signing for it on delivery or by returning it during the free look. In the Society of Actuaries' 2022 survey, fully underwritten not-taken rates averaged 6% to 7% from 2019 to 2022.
Why do life insurance applications get withdrawn?
Applicants change their minds, find cover elsewhere, balk at an exam or a medical-records request, or simply stop answering. The survey's definition counts withdrawals both before and after the underwriting decision; fully underwritten withdrawals averaged 15%, against 13% on accelerated-eligible applications.
How can a carrier improve life insurance placement?
Shorten the silent waits in the middle of a case, give producers a date they can repeat, and measure placement by days and by offer so effort goes where applicants are still deciding. Price and product competitiveness matter at least as much and sit outside case management.
Do rated offers lower placement?
An offer at a higher premium than the applicant expected asks them to decide again at a new price, and rated cases tend to be slow because the evidence that rates them is slow. That is why rated and changed offers need their own placement curve before anyone prices a waiting day.