Medical affairs analytics is the attempt to say, with numbers, what a medical organisation knows and what changed because it knew it — and insights are the hardest part of it to measure, because the output is understanding rather than a transaction. The result is a profession that counts what it does instead of what it changes: engagements, submissions, publications. The surveys of the profession say so plainly. Botminds' Medical Insights Management reports a specific and limited set of numbers against that problem — how long an insight takes to reach a theme, how many themes reached a decision, how many actions were completed, and how often the agents and the insights lead agree on a code — and this guide is as much about which of those claims is weak as about which is strong.
The survey figures below come from two peer-reviewed global surveys of the same population of 1,023 medical affairs professionals across 63 countries, published a year apart. The screens and worked figures are the solution's sample data, on a fictional company and product.
The measurement gap, in the profession's own survey answers
40%
say their organisation measures the impact of its field medical team at all
67%
call measuring that performance difficult or very difficult
3%
say the measures they use today are very effective
What is medical affairs analytics actually measuring?
In many organisations today, activity — and the reason is structural rather than lazy. Medical affairs has no obvious success metric of its own, nothing like sales revenue or a regulatory approval, so it has tended to measure what it does rather than what that changes: in the 2025 survey, 92% of organisations counted clinician engagements, while only 40% used the quality of the insights gathered. Absent a single outcome number, the available numbers are counts of work done, and counts of work done are what gets reported.
For an insights programme specifically, that produces a predictable dashboard: insights submitted, insights per colleague, themes identified, reports delivered. Every one of those is a measure of the programme's own throughput. None of them tells you whether the organisation understood anything, or whether anything changed. The useful question for a team building its first insights dashboard is not "what can we count" — it is "what claim do we want to be able to make in a leadership meeting, and what would make it checkable".
Why counting insights per colleague goes wrong
Because it is a count of inputs that people can produce at will, used as a proxy for a quality nobody has defined. The 2025 survey found the number of actionable insights submitted already in use as a performance measure by 53% of organisations, second only to counting engagements at 92% — while the same respondents, asked what should be measured, put the quality of the insights gathered near the top of the qualitative list at 67% and insight counts at 63% (Dyer, Hyder and Kraemer, Pharmacy, 2025). The gap between the two columns below is the whole argument.
What organisations count today, and what the profession says should be counted
Three specific failures follow from using the submission count as a target. It rewards volume, and volume is the thing that buries a signal — a colleague who writes four short notes where one belonged scores higher. It is not comparable across territories, because a colleague covering a large rural territory has fewer meetings than one covering a teaching hospital cluster. And it moves the moment it becomes a target, which means the trend line you were using to understand the field becomes a measure of how the field is responding to being measured.
The measurement problem underneath that gap is not subtle. The second survey, published in 2026, found the two most commonly named challenges were "difficulty defining and measuring the quality of MSL activities (76%)" and "reliance on quantitative standards that do not reflect MSLs' value (61%)" (Dyer and colleagues, Cureus, 2026). Three-quarters of a profession says it cannot define quality, and is measured on quantity in the meantime.
Four measures that hold up
Four claims about an insights programme can be made honestly, defended in a leadership meeting and audited afterwards. Each is defined below with the denominator it needs and the way it typically goes wrong.
Four measures, their denominators, and how each one fails
| Measure | Definition and denominator | Its failure mode |
|---|---|---|
| Cycle time | Median days from a captured insight to the theme it joins, to the decision on that theme, and to the completed action. Denominator: insights or themes in the window, counted separately per leg. | Reported as a mean, where one 41-day outlier moves the number more than fifty ordinary cases. Always the median, and always with the count. |
| Decision coverage | The share of themes that reached a recorded decision inside the quarter. Denominator: themes that met the minimum size in that quarter. | Gamed by deciding everything as "keep watching". Report the split across the four decisions, not the headline share. |
| Action completion | The share of actions arising from key insights that were completed by their due date. Denominator: actions due in the window, not actions created. | Denominator drift. Counting actions created makes a busy quarter look productive; counting actions due is the honest version. |
| Coding agreement | Agreement between two coders — two people, or agents and the insights lead — on a dual-coded sample, per dimension. Denominator: the sample, with its size stated. | Reported as a percentage with chance left in. Pair it with a chance-corrected figure, and report the dimension that scored worst. |
Notice what is not on that list. Nothing here measures whether the decision taken was the right one, and nothing measures a change in clinician behaviour. Both are real questions and neither is answerable from insight data: the first needs the outcome of the evidence that was generated, and the second needs a different study entirely. A dashboard that claims either is overreaching, and a director who has seen one such claim will discount everything else on the screen.
How do you measure the quality of an insight?
Not with a quality score assigned at capture — that is a measure of how strongly the conversation landed on the colleague who wrote it. Three approaches work better, and the third is the only one that is genuinely a quality measure rather than a proxy.
Completeness against a defined record. Does the insight carry the fields that make it usable later — the date of the exchange, the channel, the segment, the region, the passage close to verbatim, the request if there was one, the codes with their scheme version? This is mechanical, cheap and worth doing, and it is not quality; it is hygiene.
Citability. What share of insights in a quarter were actually cited in a theme statement or a report sentence? This is a real quality signal, because a note that nobody could cite was either too vague or about nothing. It also has a well-behaved denominator and cannot be gamed by writing more.
Panel review on a sample. Two or three people independently score a random sample of fifty insights against a short rubric — is the passage specific, is the segment recorded, could a claim be built on it — and you report the agreement as well as the score. It is the approach that comes closest to the thing people mean by quality, and it costs about half a day a quarter. A programme that calls quality unmeasurable may simply not have tried it.
Cycle time, in three legs
Cycle time is the strongest measure in the set because the clocks already exist: every step is timestamped by the work itself. Measure it in three legs, because they fail for different reasons and a single end-to-end number hides which one is broken.
Capture to theme is a systems measure. It falls when channels are integrated and coding is automatic, and it is the leg where the solution's own design target sits — a median of 2.1 days, which is a design goal rather than a measured result. Theme to decision is a governance measure: it is long when nobody is clearly the decider, and no technology fixes that. Decision to action completed is an organisational measure, often the longest leg, and the one a leadership team can actually move.
Why cycle time is a median, and what the mean does to it
Ten insights, days to their theme
1, 1, 2, 2, 2, 3, 3, 4, 6, 41
A realistic shape: most insights join a theme quickly, and one sat in a channel that syncs weekly, through a holiday.
The raw data
Median
(2 + 3) ÷ 2 = 2.5 days
The middle of the distribution. Unmoved by how extreme the outlier is.
What to report
Mean
65 ÷ 10 = 6.5 days
More than twice the median, and the whole difference is one case. Report this and you are reporting an incident, not a cycle time.
What not to report
What to report alongside
median, the count, the window, and the worst case
The outlier is worth naming separately — it is usually a channel that syncs on a slow schedule, which is a fixable problem.
The honest version
Denominators, small cells and the regional slice
Every number on an insights dashboard is a ratio whose denominator is a choice, and the regional slice is where the choice bites. A theme that is 47% United States is 47% of something: of the insights in that theme, of the insights in the window, or of the interactions that produced them — three different claims from the same bar chart.
Two rules keep a regional slice honest. Say the denominator on the tile, in words, every time. And set a floor below which a cell is shown as a count rather than a share: the public-health presentation standards for proportions suppress estimates built on a denominator below 30, which is a reasonable reference line to adopt even though it was written for national survey estimates and does not bind a medical affairs report (NCHS Data Presentation Standards for Proportions). Below a much smaller number — five in this solution's default — the cell should fold into a single other group entirely, because a cell that small can point at an individual. The arithmetic of windows, baselines and small cells is worked through in how to tell a real emerging theme from a busy month.
What a quarterly dashboard should show a director
Six tiles, and every one of them should answer the question "what would I do differently". The sample dashboard shows insights captured and the change on the previous quarter; the share coded by agents with the agreement figure behind it; the median capture-to-theme time; actions done and how many had their impact measured; insights per week by channel; and theme momentum against the previous quarter.
The quarterly view: four tiles, a channel series and a ranked list of what moved
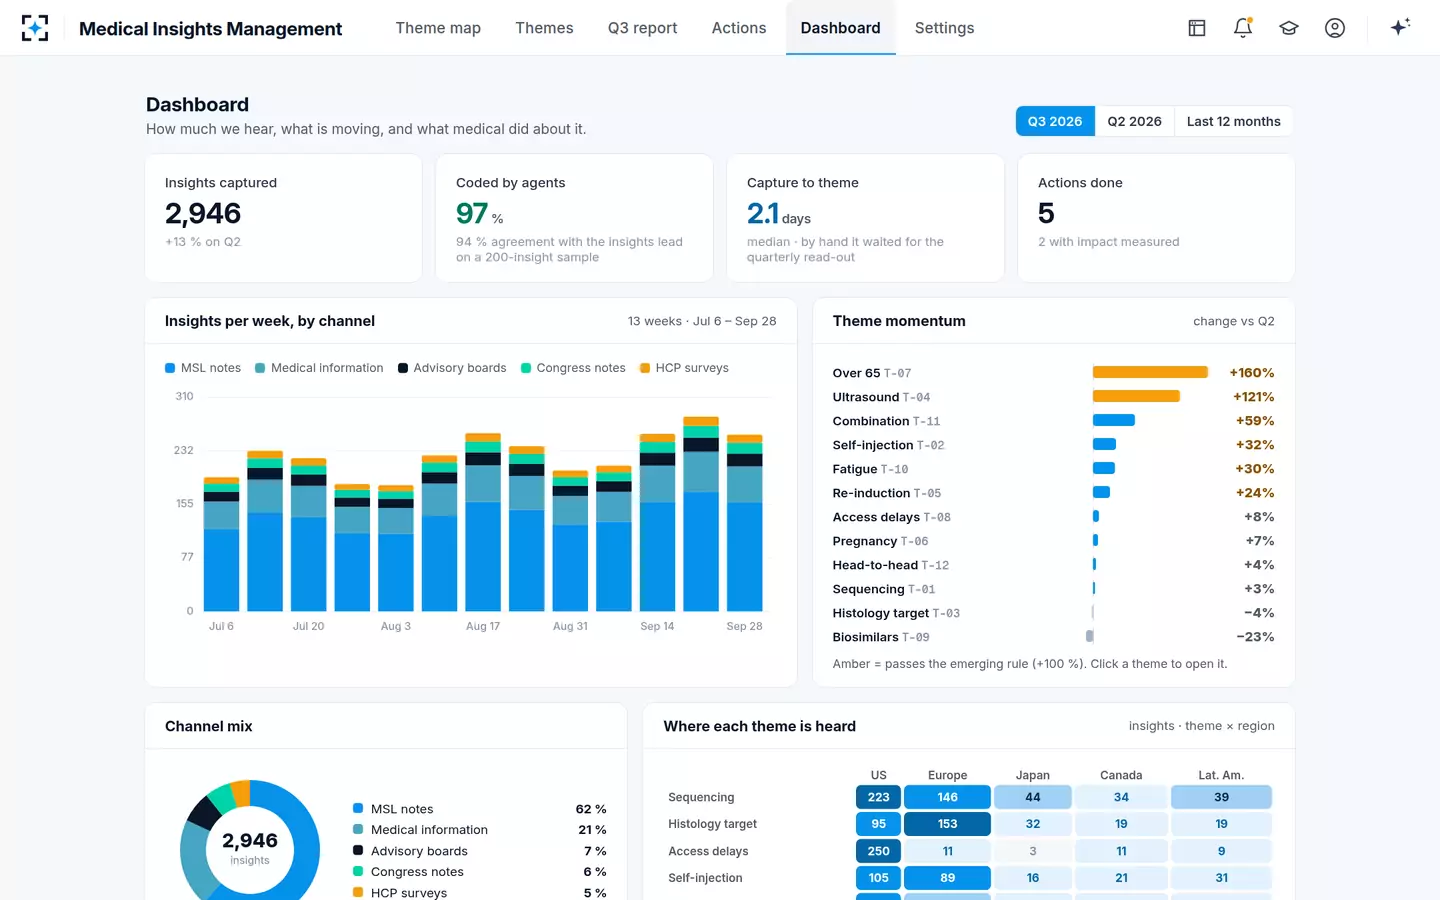
Three things on that screen are worth copying regardless of what you build it in. Every tile carries its comparison, so no number stands alone. The momentum list is ranked by change and includes the themes that fell, which is the half dashboards easily drop. And the channel series is stacked rather than totalled, so a jump caused by one advisory board is visible as one advisory board.
A review to run on your own dashboard once a quarter
- Every tile names its denominator in words
Not "47% US" but "47% of this theme's insights in the quarter". If the denominator will not fit on the tile, the tile is the wrong shape.
- Every tile names its window, with dates
Four weeks against the four before, or quarter against quarter — never one of each on the same screen without saying so.
- Every number is labelled for what kind of number it is
Measured, target, or estimate. A design goal printed in the same type as a measured result will be read as a measured result.
- Someone can name the decision each tile serves
Walk the dashboard with the director who reads it and ask, tile by tile, what they would do differently. Delete the ones with no answer.
- The agreement figure is current and says which statistic it is
A percent-agreement number and a chance-corrected number are different claims; quote the sample size and the date of the test.
- Themes that fell are on the screen
An alerting rule written for growth produces a dashboard that only shows growth, and a programme that never notices a question being answered.
Reporting agreement honestly, including the number you did not like
Any claim that agents code insights accurately is an accuracy claim, and accuracy claims have a published standard for how they should be presented. The AI risk management framework is explicit: an accuracy figure should always come with a clearly defined, realistic test set that reflects how the system will actually be used, plus an account of how the test was run, all written into the supporting documentation (NIST AI Risk Management Framework 1.0). For an insights programme that means four things travel with the number: what sample it was measured on, how large it was, which dimensions were scored, and when.
Two honest habits follow. Report per dimension, because a scheme can agree almost perfectly on product and poorly on sentiment, and the blended figure hides it. And publish the dimension that scored worst — it is the one that tells a reader what the data can bear, and a report that only shows the best number has told the reader nothing about the rest. How to run that test, and why a high percentage can sit next to a mediocre chance-corrected score on the same sample, is worked through in the coding scheme that still holds next quarter.
Activity measures and impact measures, and what each can support
Activity measures: Insights submitted, interactions held, themes identified, reports delivered.
Impact measures: Decision coverage, action completion against due dates, cycle time to a decision, evidence gaps closed.
Activity measures: Capacity planning, spotting a channel that has gone quiet, and noticing a territory where logging has stopped.
Impact measures: A claim that the organisation acted on what it heard, and how quickly, with the dates to back it.
Activity measures: Any claim about understanding, quality, or influence. A rise in submissions is a rise in submissions.
Impact measures: A claim that the decision was correct, or that clinician behaviour changed. Both need evidence from outside the insights programme.
Activity measures: Volume rises and specificity falls; the trend line becomes a measure of the incentive.
Impact measures: Pressure moves onto the decision-makers and the action owners, which is where it belongs — but decisions can be rubber-stamped, so report the split.
Activity measures: An operations view for the team that runs the programme.
Impact measures: The quarterly view a medical director reads.
What to stop reporting, and what to say when it is asked for
Three numbers are worth retiring, and each comes with a replacement to offer in the same sentence, because "we do not report that" on its own loses the argument.
Insights per colleague. Offer instead the share of your declared listening priorities with any coverage this quarter, and the distribution of insights by submitter — which answers the real question behind the request, whether anybody has stopped contributing, without creating a league table.
Total insight count as a headline. Offer the count with its channel split and the change by channel. A rise that is entirely one advisory board is a different fact from a rise across all five channels, and the second is the only one worth putting in a summary.
Any single blended accuracy percentage. Offer per-dimension agreement with the sample size, the date and both statistics. It is a longer answer and it is the one that will survive the follow-up question.
There is a fourth category: numbers that are honest but need a label. Days saved by automation is an estimate, built from assumptions about what the work took before; a design target is a goal, not a result; and a figure from the sample data describes a demonstration, not a customer. Each of those is fine to show, and each should say which it is on the face of the tile.
Where the numbers end up: a report whose every sentence opens its evidence
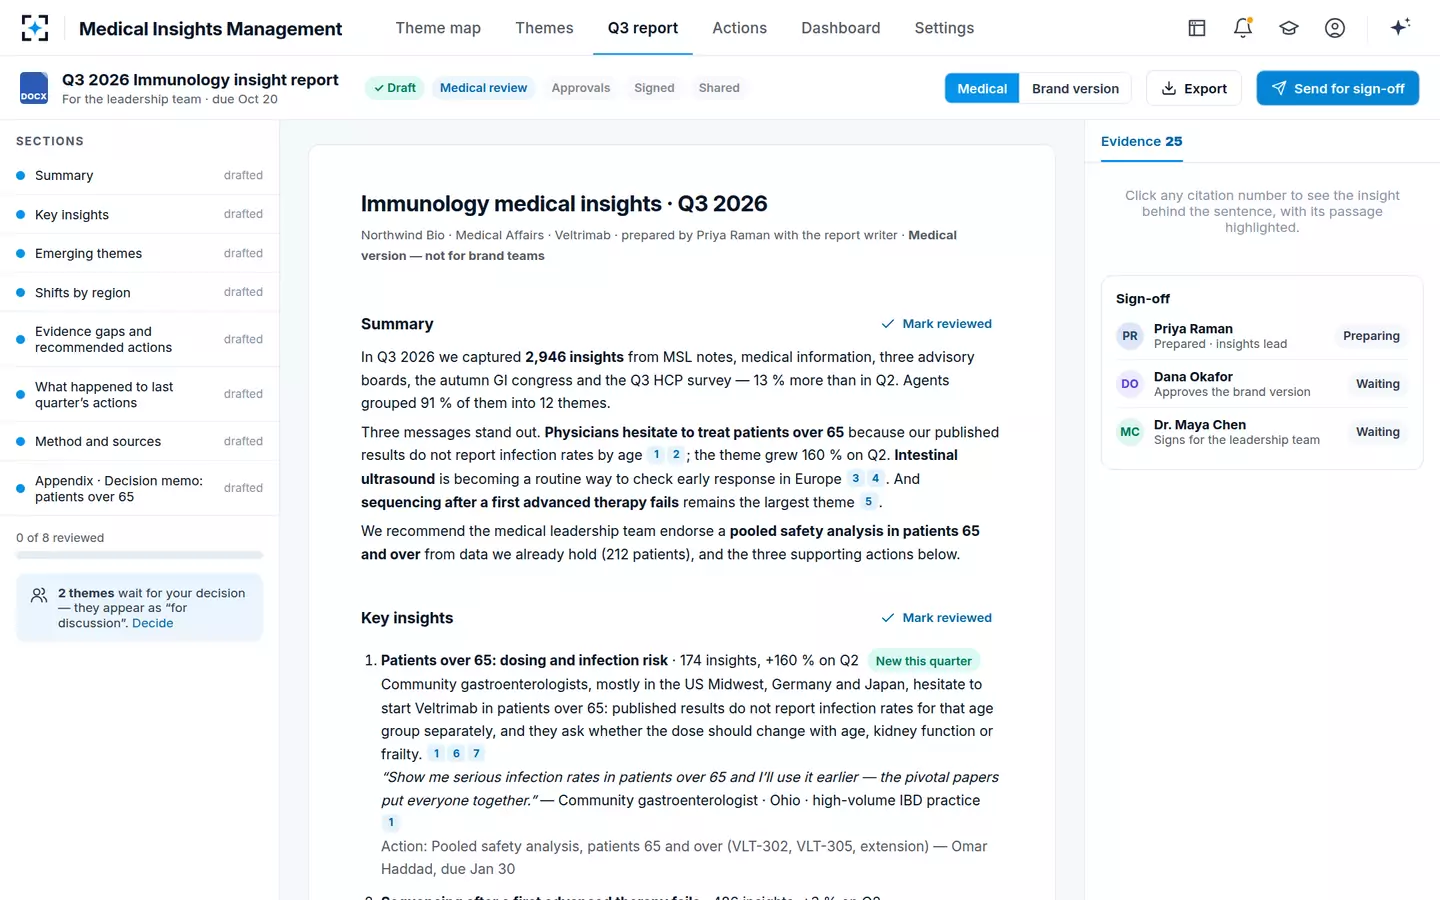
Where this solution helps with measurement, and where it does not
Worth being explicit, because an analytics page about our own product should say what it cannot do. Medical Insights Management can measure the first leg of cycle time well, because it owns the clock: the insight arrives, the agents code and cluster it, the theme exists. It can report decision coverage and the split across the four decisions, because the decision is taken inside it and recorded with a reason. It can report action completion against due dates, because the actions carry owners and dates. And it can support an agreement test, because the agents' codes and the insights lead's corrections sit side by side.
It cannot tell you whether a decision was right. It cannot measure clinician behaviour change, which needs data from outside any insights system. It will not make a count comparable across territories that have different coverage models. And the figures on its own pages are labelled for a reason: 2,946 insights in a quarter is a demonstration on a fictional company; 2.1 days to a theme and 97% coded with 94% agreement are design targets for a live deployment; the days-saved comparison is an estimate of a quarterly cycle, not a measured result. Ask any supplier, including us, which of their numbers is which — and where the insights layer belongs in your systems sets out the rest of the evaluation.
If you are building the first version of this dashboard, start smaller than you think: median capture-to-theme, decision coverage with its four-way split, action completion against due dates, and one agreement figure per dimension. Four honest tiles beat twelve that need a footnote each, and the argument for why counting submissions is not among them is set out in what a medical insight is, and what is only an observation.
Questions people ask
What KPIs should a medical insights team report?
Four hold up: median cycle time in three legs, decision coverage with the split across the decisions taken, action completion measured against actions due rather than actions created, and coding agreement per dimension with its sample size. Report each with its denominator and window, and label every figure as measured, target or estimate.
Should you count insights per colleague?
No, not as a performance measure. It is an input count that people can produce at will, it is not comparable across territories, and it moves as soon as it becomes a target. If the question behind the request is whether anyone has stopped contributing, answer that directly with the distribution by submitter and the coverage of your listening priorities.
How do you measure time from insight to action?
In three separate legs — capture to theme, theme to decision, decision to action completed — each as a median with its count and window, because they fail for different reasons. A single end-to-end figure hides which leg is broken, and the third leg is often far longer than the first.
How do you report a regional slice with small numbers?
Name the denominator in words on the tile, show small cells as counts rather than shares, and fold the smallest groups into a single other category. The published presentation standards for proportions suppress estimates on a denominator below 30; that line was written for national survey estimates, but adopting a stated threshold is better than arguing cell by cell.
How do you prove the value of an insights programme?
With a chain rather than a number: this theme, these cited notes, this decision on this date, this action with this owner, completed on this date, and what it produced. Two or three such chains per year, each checkable end to end, make a stronger case to a leadership team than any dashboard, because each one can be audited by anyone who doubts it.
What should a quarterly insights dashboard not show?
A league table of colleagues, a blended accuracy percentage with no sample size, a total insight count with no channel split, and any claim about clinician behaviour change. Keep estimates and design targets on the screen if they are useful, but label them as such — an unlabelled target read as a result is the error that costs a dashboard its credibility.