An insight taxonomy is the controlled list of codes a medical affairs team applies to every captured insight — the topics, the product or indication, the sentiment, the clinician segment — so that thousands of unlike notes can be counted together. It is harder to get right than it looks, because a taxonomy is a measuring instrument and it is rarely treated as one: schemes grow a code every time somebody meets a new case, nobody records which version coded which note, and a trend line quietly breaks the quarter the list changes. Botminds' Medical Insights Management treats the scheme as a versioned setting that agents apply and people can override: the coder applies topic, product, sentiment and clinician segment to every record from every channel, uncertain codes go to the insights lead, and every change to the scheme is recorded with the date it took effect.
Worked numbers on this page are either our arithmetic on a fictional sample, or the published study they are drawn from, and each is labelled where it appears. The screens come from the solution's sample data, on a fictional company and product.
What is an insight taxonomy, and what does it have to do?
It has to do three jobs, and they pull against each other. It has to describe what the field actually hears — which pushes toward more codes. It has to be applied the same way by different people on different days — which pushes toward fewer. And it has to stay comparable with last year — which pushes toward never changing it at all. A scheme that optimises any one of the three fails at the other two.
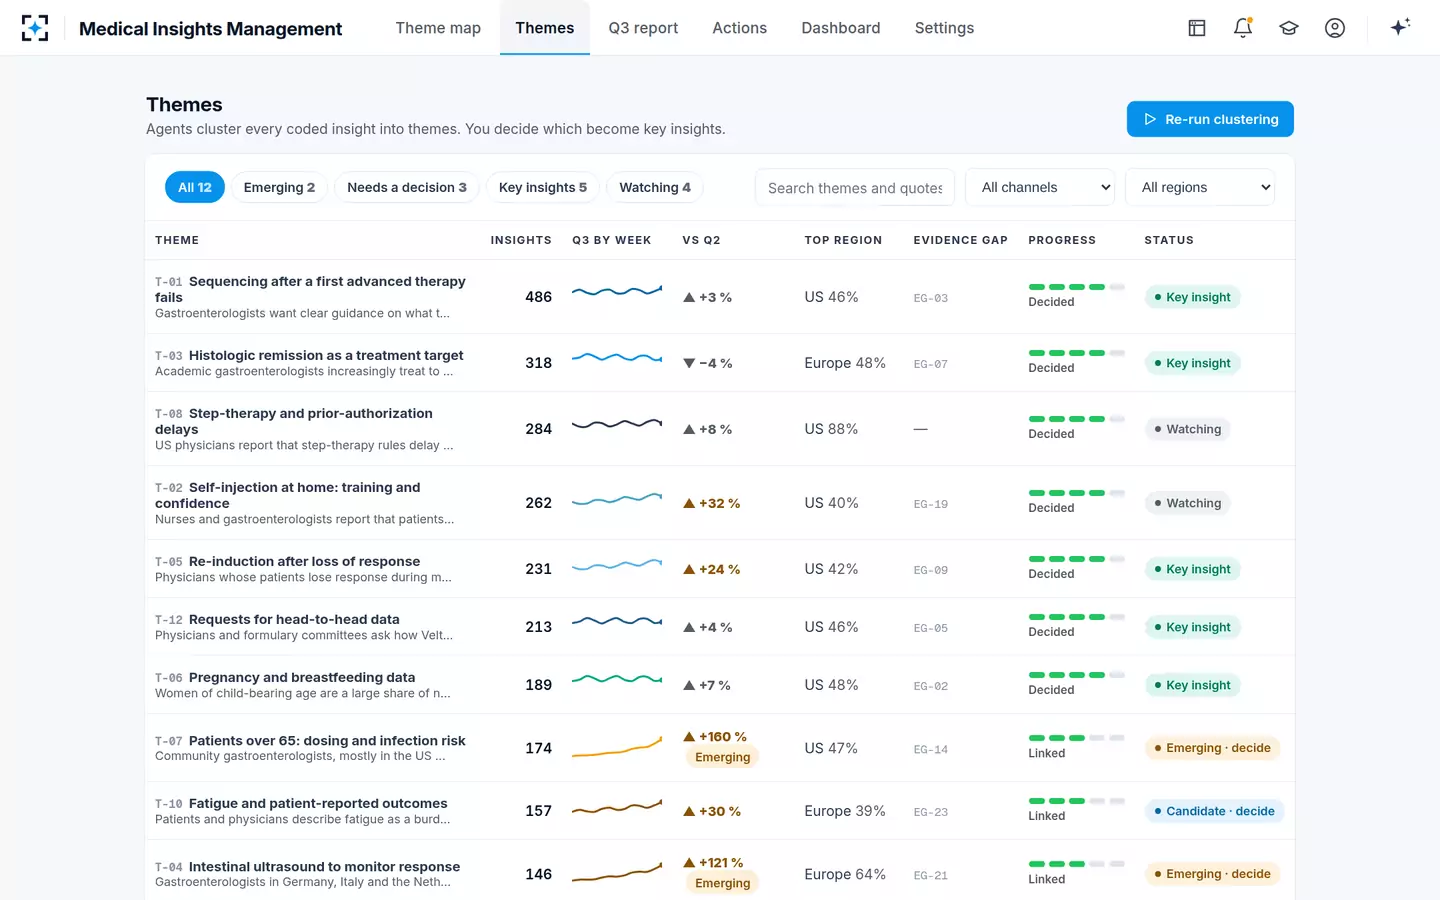
The useful corrective to the instinct to build the perfect tree is to think in dimensions that matter to the people who use them. Not a complete ontology of the disease area — a small number of axes that somebody actually filters on.
The test of relevance is blunt: for each dimension, name the decision it changes. If nobody would do anything differently depending on the value, you have built a field that will be filled in badly, because the people filling it in can tell.
Four dimensions that earn their place
Four axes cover much of what a medical insights programme needs to answer. Each has a decision behind it, which is the only reason it survives.
Four dimensions, the values they take, and the decision each one serves
| Dimension | Example values | The decision it serves |
|---|---|---|
| Topic | Use in older patients · infection risk · sequencing after a first failure · access and prior authorisation · self-administration | What the theme is about, and therefore which evidence gap or plan objective it maps to. This is the axis the clustering works on, and the one worth spending time on. |
| Product and indication | The product · a named comparator · the class · disease-area, no product | Who owns the theme. A theme about the class belongs to a different conversation from one about a specific product, and a theme about a competitor rarely belongs to the medical plan at all. |
| Sentiment | Concern · curiosity · confidence · dissatisfaction · neutral | How urgent it is. Concern rising inside a steady topic is a different signal from a topic growing with neutral sentiment, and only the first usually needs a response this quarter. |
| Clinician segment | Community or academic · specialty · prescribing volume band · region | The denominator. Many findings worth reporting are differences between segments, and a theme without segments cannot be read against the population it came from. |
Two tempting dimensions are usually mistakes. "Priority" assigned at capture is one: the colleague in the room is the worst-placed person to judge how important a remark is across a book of thousands, and a priority field mostly records how strongly the conversation landed. "Action required" is the other: it belongs to the theme, not the note, and putting it on the note produces a backlog of individually actionable items that nobody can sequence.
Listening priorities sit above the codes, not inside them
A coding scheme describes what arrived. A listening plan describes what you went looking for. Keeping them in two layers is what lets you notice a silence — a declared question with no insights against it is a finding, and a scheme that has quietly absorbed your priorities as codes will never show you one.
In practice that means the listening priority is a separate field on the record, filled in with "none" when the note answers nothing you asked for, while the topic code describes the subject regardless. The two disagree often, and the disagreement is informative: a priority with plenty of coverage but all of it in one topic usually means the question was asked too narrowly. What a medical insight is, and what is only an observation works through why the priority belongs in the definition at all.
How many codes before a scheme stops being applied consistently?
There is no published number, and anyone who offers one is guessing. What can be said with confidence is the shape of the trade-off, and how to find your own ceiling empirically rather than by argument.
The shape: agreement between coders falls as the number of codes rises, and it falls fastest where two codes are near-synonyms. A scheme with sixty topics may well have a dozen pairs that no two people split the same way, and those pairs tend to absorb much of the disagreement. Cutting the scheme is usually cheaper than training around it.
The empirical ceiling: dual-code a sample under the proposed scheme, measure agreement per dimension, and look at the confusion — which pairs of codes the two people swapped. If one pair accounts for a fifth of the disagreement, merge it and re-measure. Repeat until the remaining disagreements are genuine judgement calls rather than definitional ones. Expect to end with fewer topics, fewer sentiment values and fewer segment values than you started with, because that is what two people can hold in their heads.
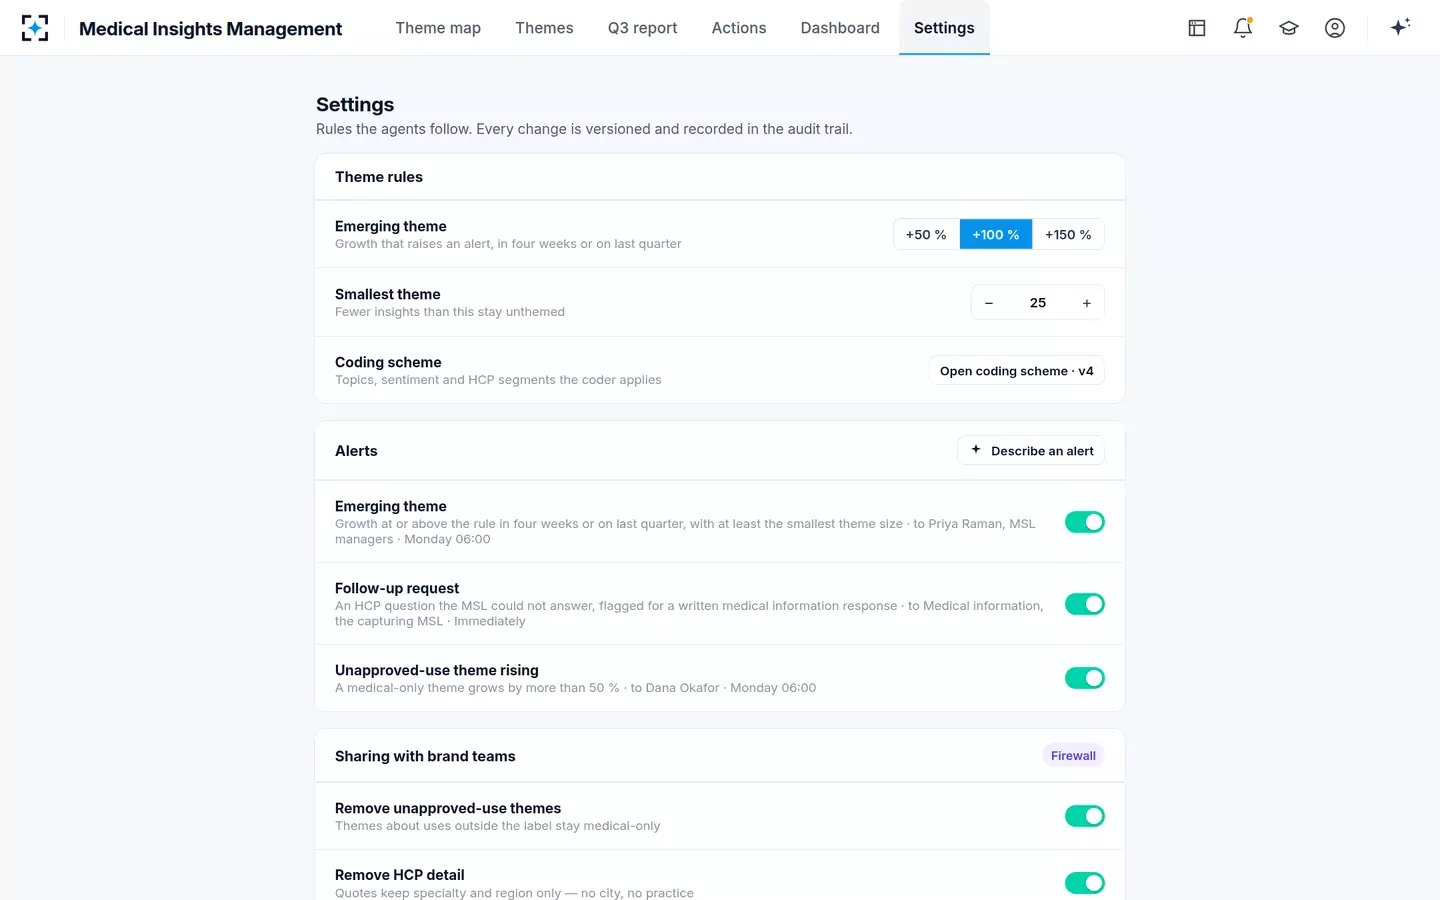
A second ceiling is worth setting at the same time: the smallest group you will report. In the sample settings the smallest theme is 25 insights, and regions or segments below 5 insights fold into a single other category rather than being shown. A scheme whose codes routinely produce cells of three is not measuring anything, however precise it looks.
What four dimensions look like once they are applied to a quarter
How do you measure agreement between two coders?
Give the same sample to two coders independently, compare them code by code, and report two numbers: the raw share on which they agreed, and the share left once you subtract the agreement chance alone would have produced. The second is Cohen's kappa, and it is the number that should go in the report, because the first flatters any scheme with a rare code in it.
The arithmetic is short enough to do by hand on one dimension, and doing it by hand once is the fastest way to understand why the two numbers diverge. The worked example below uses a fictional sample of 200 insights dual-coded for a single topic.
Agreement on one topic code, worked through on 200 dual-coded insights
Observed agreement
(10 + 179) ÷ 200 = 0.945
The two coders applied the topic to the same 10 insights, both left it off 179, and disagreed on 11.
The number most reports print
Agreement expected by chance
(0.080 × 0.075) + (0.920 × 0.925) = 0.857
One coder used the topic on 16 insights and the other on 15. Two people assigning at those rates at random would still agree on nearly six notes in seven, because the code is rare.
The number nobody prints
Cohen's kappa
(0.945 − 0.857) ÷ (1 − 0.857) = 0.62
The agreement left over once chance is removed, as a share of the agreement that chance could not have produced.
The number to report
What it licenses you to say
0.62 is just above 0.60
Barely inside the floor the health-research literature suggests. The same sample looks excellent at 94.5% and marginal at 0.62, and only one of those two readings is about the scheme.
The reading
Three practical rules come with the method. Score each dimension separately, because a scheme can be excellent on product and poor on sentiment and a single blended figure hides it. Use coders who have not discussed the sample. And re-measure after any change to the scheme — the number is a property of the scheme and the people together, not of the scheme alone.
Why 94% agreement and a kappa of 0.6 are not the same claim
Because one of them has had chance removed and the other has not. The gap is not a technicality: the literature's own worked example shows the same data set reading as excellent on one statistic and moderate on the other. In the published comparison McHugh describes, human and automated raters reached only moderate agreement on kappa (κ = 0.555), while the very same data gave an excellent 94.2% on percent agreement (McHugh, Biochemia Medica, 2012).
One published data set, two statistics, two different conclusions
Reported as percent agreement: 94.2%
Reported as Cohen's kappa: 0.555
Reported as percent agreement: Every time the two raters gave the same answer, including the times they would have agreed by chance.
Reported as Cohen's kappa: The agreement remaining after the chance agreement is subtracted, divided by the agreement chance could not explain.
Reported as percent agreement: Excellent. A scheme that two people apply almost identically.
Reported as Cohen's kappa: Moderate, and below the level this author treats as adequate for health-related work.
Reported as percent agreement: When one code is rare. The rarer the code, the more of the raw agreement is simply both raters saying no.
Reported as Cohen's kappa: Unchanged by rarity, which is the whole point of using it.
Reported as percent agreement: Quote it only alongside the kappa, and say which dimension it is for.
Reported as Cohen's kappa: Report it per dimension, with the sample size and the date.
What counts as good enough is a judgement, and the one on the record for health data is strict. McHugh reads any kappa under 0.60 as inadequate agreement — too weak to place much confidence in the results — and she is explicit that the older convention is too soft for this field, because Cohen's bands would let a score as low as 0.41 pass in health research. The bands below are hers, with the share of the data each level implies is reliable.
What each level of agreement implies about how much of the coded data is reliable
This bears directly on a number that appears on this solution's own pages. The design target for Medical Insights Management is that agents code 97% of insights with 94% agreement with the insights lead. That 94% is a percent-agreement figure on a sample, not a kappa, and it should always be quoted as one — the point of this section is that the two are different claims, and the stronger-sounding one is the weaker. What the equivalent test looks like when one of the two coders is a model, and what it does and does not prove, is the subject of what a model codes well and how to test it.
Version the scheme, or lose the trend you were trying to see
Every coded insight should carry the version of the scheme that coded it. Without that, a change to the list silently rewrites history: a topic that was split in two looks like a topic that collapsed, and a merge looks like a surge. The cost is not theoretical: an organisation that cannot read its insights on a consistent scheme over time has lost the ability to see a trajectory at all.
Versioning buys three specific things. A chart can be drawn on one version and footnoted at the boundary. A code definition can be tightened without pretending the old notes were coded under the new wording. And an analyst asked why a trend moved can answer with the scheme's own history rather than with a guess.
The scheme as a setting, next to the rule that decides what counts as emerging
A scheme's year, from draft to the version that replaces it
- Draft from last year's free text4 weeks
- Dual-coded sample, agreement measured per dimension2 weeks
- Merge the confused pairs, re-measure2 weeks
- Release with a version number and a migration note3 weeks
- Quarterly drift check against a fresh sampleeach quarter
What the free-text field must never carry
A coding scheme governs the structured fields; the free-text passage is where the risk lives. The de-identification guidance for health information is unambiguous that the two are judged the same way: "The de-identification standard makes no distinction between data entered into standardized fields and information entered as free text (i.e., structured and unstructured text) — an identifier listed in the Safe Harbor standard must be removed regardless of its location in a record if it is recognizable as an identifier" (HHS Office for Civil Rights, guidance on de-identification methods). That guidance governs covered entities rather than a manufacturer's insight programme, but it is the recognised way to judge whether a passage still identifies somebody, and it is the test worth borrowing.
Applied to insights, it rules out more than names. A practice name, a town small enough to be a town, a date that pins a specific clinic visit, and a description detailed enough to identify one patient are all identifiers in a passage however carefully the structured fields were filled in. In this solution the intake agent de-identifies at the point the record is created — specialty, practice setting and region in place of the person — so the passage a coder reads has already lost the parts that should never have travelled.
Recoding the back catalogue, and when to leave it alone
When a scheme changes, there are three honest options, and the usual mistake is choosing the fourth, which is to change the list and say nothing.
Recode everything. Right when the change is a split or a merge that can be applied mechanically — one old code becoming two with a rule that decides which, or two becoming one. Record that it happened, and keep the old code on the record alongside the new one so the trend can be drawn either way.
Recode a window. Right when the change needs judgement and the comparison that matters is recent. Recode the last four or eight quarters, footnote the boundary, and leave the older data on its own version. This is the common case.
Leave it alone. Right when the old data is still internally consistent and the new scheme answers a new question. A trend line stops at the boundary and a new one starts; that is less misleading than a continuous line across a definitional change.
The release checklist for a new version of a coding scheme
- A version number, and a date it takes effect
Every record coded after that date carries it. Without this, nothing else on the list is recoverable later.
- A definition, an example and an exception for every code
The exception is the one that does the work: it is where two coders learn which of two near-synonyms wins.
- A sample dual-coded by two people who did not discuss it
Two hundred insights is enough to see the confused pairs; fifty is not.
- An agreement score per dimension, with its sample size
Both numbers: the raw share and the kappa. Publish the one you did not like.
- A migration note saying what happened to the back catalogue
Recoded in full, recoded for a window, or left alone — and where the trend line breaks.
- A named owner and a review date
A scheme with no owner drifts; a scheme reviewed only when something breaks drifts further.
One last thing to decide before the scheme ships: what happens to an insight the coder is not sure about. Routing uncertain codes to a person is the difference between a measured scheme and a confident-looking one, and in this solution that route is a design rule rather than an option — uncertain codes go to the insights lead. Once the codes are stable, the question becomes what to do with the counts they produce, which is where telling a real theme from a busy month picks up.
Questions people ask
How many topics should an insight coding scheme have?
No published figure exists, so find your own ceiling: dual-code a sample, measure agreement per dimension, and look at which pairs of codes the two coders swapped. Merge the worst pair, re-measure, and stop when the disagreements left are genuine judgement calls. The number you land on is the one two people can apply the same way.
How do you code sentiment on a medical insight?
With a short list of values that describe the clinician's stance rather than the colleague's feeling about the conversation — concern, curiosity, confidence, dissatisfaction, neutral is enough for most programmes. Score it against what was said, not against how the meeting felt, and measure agreement on it separately: sentiment is often the dimension with the lowest score, and a blended figure will hide that.
What is a good inter-rater agreement score?
For health-related work, the published reading treats a Cohen's kappa under 0.60 as too weak to rely on, and calls the older convention that lets 0.41 pass too lenient for health data. Aim for 0.60 as a floor and 0.80 as a working target, and report the sample size and date alongside.
How often should a coding scheme be revised?
Review annually, revise when the evidence says so rather than on a calendar. The signal to revise is drift — a quarterly check on a fresh dual-coded sample showing agreement falling, or a growing share of insights landing in a catch-all code. Revising more than once a year makes trends expensive to read; never revising makes them meaningless.
What happens to last year's insights when the taxonomy changes?
One of three things, each stated openly: a mechanical recode where a split or merge can be applied by rule, a recode of a recent window with the boundary footnoted, or nothing at all, with the old data left on its own version and the trend line broken on purpose. What is not acceptable is a continuous chart across a definitional change with no note.
Can agents apply the coding scheme instead of people?
They can apply it; whether they apply it well is a measurable question and should be measured the same way you would measure a second human coder — a dual-coded sample, agreement per dimension, and both statistics reported. Keep the route for uncertainty open: a scheme where the coder must choose a code even when the note is ambiguous produces confident data and unreliable trends.