To identify emerging themes in MSL insights, or in any qualitative research data, an insights team clusters what people said by meaning, counts each cluster inside a stated window, compares it with the same cluster in a stated baseline period, and divides by something that accounts for how much listening happened — then checks that the rise survives all three of those choices. Many false alarms in insight work come from skipping one: a theme that "doubled" when the team grew, a theme that doubled because one colleague logs more carefully than the rest, a theme that doubled against a baseline nobody wrote down. Botminds' Medical Insights Management makes those choices explicit settings — the rule for what counts as emerging, the smallest theme worth naming, the smallest group worth showing — runs the comparison every Monday, and sources each alert to the notes behind it so the first question in the room is already answered.
The worked example below follows one theme through the solution's sample data, on a fictional company and a fictional immunology product. The method figures are from the qualitative research and statistical presentation literature, linked where they appear.
How do you identify emerging themes in qualitative data?
In five steps, and the order matters. Cluster by meaning rather than by keyword, so that two ways of saying the same thing land together. Count inside a window you fixed before you looked. Compare with a baseline of the same length. Divide by a denominator that accounts for the listening effort behind the count. And then look at the spread — how many different people, in how many different places, said it.
The fifth step is the one that separates a theme from an enthusiasm. A cluster of forty mentions from four colleagues in one country is a cluster of four opinions with good note-taking behind them. The same forty from twenty colleagues in six countries is a finding. Field notes are not a sample anyone designed: the colleagues who log most, and the clinicians who talk most, are over-represented by construction. Dominant voices do not announce themselves; the only defence is to look at the distribution every time.
What is data saturation, and how much is enough?
Saturation is the point at which more interviews stop adding anything new — and the research shows it arrives twice, at two very different sample sizes, which is why teams argue about it. In a study of 25 in-depth interviews, "code saturation was reached at nine interviews, whereby the range of thematic issues was identified. However, 16 to 24 interviews were needed to reach meaning saturation where we developed a richly textured understanding of issues" (Hennink, Kaiser and Marconi, Qualitative Health Research, 2017).
Thus, code saturation may indicate when researchers have "heard it all," but meaning saturation is needed to "understand it all."
Hennink, Kaiser and Marconi, Qualitative Health Research 27(4), 2017
That distinction maps onto insight work almost exactly, and it is worth making explicit in how a programme reports. Nine notes are enough to know a topic exists; they are not enough to say why clinicians hold the view, what would change it, or whether two apparently similar remarks are the same concern. Treating the first number as if it were the second is how an organisation ends up commissioning a study to answer a question it never understood.
Two kinds of enough, and what each one licenses you to say
Code saturation: Nine interviews, in the published study.
Meaning saturation: Sixteen to twenty-four interviews, in the same study.
Code saturation: The range of issues. You now know what the topics are.
Meaning saturation: A richly textured understanding of each issue: why, in what circumstances, and what would change it.
Code saturation: The theme exists and can be named. Enough to put it on the map and watch it.
Meaning saturation: The theme can carry a statement about cause, and an evidence need can be written from it.
Code saturation: Any claim about why, or about how widely held the view is.
Meaning saturation: A claim about prevalence. Depth is not representativeness; that needs a denominator.
Code saturation: Missing a topic entirely because nobody listened long enough.
Meaning saturation: Acting on a thin reading of a topic everyone agrees is real.
How many mentions make a theme? A count is not a signal
There is no universal number, and a threshold expressed only as a count is close to meaningless. A usable threshold has three parts, and all three have to be written down before the quarter starts or they will be chosen afterwards to fit the answer somebody wanted.
A minimum size. Below some number of insights, a cluster should not be named at all, because the statement you could write about it would rest on too little. In the sample settings that floor is 25 insights; fewer than that and the notes stay unthemed rather than being dignified with a name.
A baseline. Growth against what. Four weeks against the four before is a different claim from this quarter against last quarter, and a theme can pass one and fail the other.
A rate of change. In the sample settings the default is +100% — a doubling — with +50% and +150% also available. The number is a policy choice about how much noise the team will tolerate, not a scientific constant: a lower rule produces more alerts, most of them nothing, and a higher one is quiet until the thing is obvious.
One theme against the rule that would have flagged it
The two growth figures in that caption are worth separating, because a report that mixes them is a report nobody can check. The +106% is four weeks against the four before, measured in mentions. The +160% is this quarter against last, measured in insights. Both are true of the same theme and they are not the same measurement; a chart that puts them side by side without naming the window has stopped being evidence.
Choosing the window: four weeks against the four before, or on last quarter
The window is the single most consequential choice in the whole method, and it should be made for operational reasons rather than analytical ones. Ask what you can act on. If the response to a rising theme is a slide module and a standard response document update, a four-week window lets you start them six weeks earlier. If the response is an evidence plan decision that only happens quarterly, a four-week alert mostly produces anxiety.
Three properties to check once you have chosen. The window should be a whole number of weeks, because insight volume has a weekly rhythm — congresses, holidays, the fact that Friday notes get written on Monday. It should be long enough that a single large advisory board does not dominate it. And the baseline should be the same length as the window, immediately before it; comparing four weeks against a twelve-week average is a quietly wrong habit, because the longer period is smoother and will almost always make the short one look dramatic.
Seasonality deserves one caution. A quarter containing the major congress in the disease area is not comparable with one that does not, and in insight data the congress effect can be large. The honest handling is to say so in the report and, where the volume justifies it, to compare like quarters year on year as well as adjacent ones.
The denominator problem: what denominator should a theme count use?
Mentions, divided by something that measures how much listening produced them. The raw count rises when the team grows, when a new country is added, when a colleague returns from leave, and when the programme runs a campaign asking people to log more — and none of those is the world changing.
The same rise, before and after the denominator
Raw growth
(99 − 48) ÷ 48 = +106%
The number the map shows and the number that raises the alert. True, and not yet a finding.
What the count says
The denominator
colleagues who reported anything in the window
Not headcount: the number of people who actually submitted something, which is what measures listening effort rather than team size.
What you divide by
Mentions per reporting colleague
99 ÷ 31 = 3.19, against 48 ÷ 26 = 1.85
Suppose 26 colleagues reported in the baseline window and 31 in the latest one — a plausible shape for a growing team.
The corrected rate
Growth, corrected
(3.19 − 1.85) ÷ 1.85 = +73%
Still a strong rise, and a third smaller than the headline. Report both, or report this one and say what the raw figure was.
What survives
Three alternative denominators are worth knowing. Mentions as a share of all insights in the window is the easiest and is right when you are asking what the field is spending its attention on. Mentions per reporting colleague, as above, is right when the team is changing size. Mentions per clinician interaction is the most faithful and the hardest to get, because it needs the interaction count from a different system — but if you have it, it is the one that answers the question a director will ask.
Whichever you pick, the rule is the same: say it on the chart. An unlabelled count is not a measurement, and which insight measures survive scrutiny takes that argument further into the quarterly dashboard.
When a region cell is too small to show at all
Themes are most interesting when they differ by place, which is exactly where the numbers get too small to support the difference. There are two separate problems: a small cell is unstable, and a small cell can identify somebody. Both have conventional answers.
For instability, the public-health presentation standards are a defensible borrowing. The standards for proportions published by the National Center for Health Statistics require that "estimated proportions should be based on a minimum denominator sample size and effective denominator sample size (when applicable) of 30", and that "estimates with either a denominator sample size or an effective denominator sample size (when applicable) less than 30 should be suppressed" (NCHS Data Presentation Standards for Proportions). They were written for national survey estimates rather than for insight counts, and they are not binding on a medical affairs report — but they are a published line, and a team that adopts one stops arguing about each cell.
One theme by region, and what each cell can carry
| Region | Insights in the month | What the solution does | What a proportion would need |
|---|---|---|---|
| United States | 46 | Shown. | Above the published minimum of 30, so a percentage of this cell is reportable. |
| Europe | 33 | Shown. | Just above the minimum. A percentage is reportable; a percentage split further by country is not. |
| Japan | 11 | Shown as a count. | Below 30. Report the count, not a proportion. |
| Canada | 5 | Shown as a count — at the solution's small-group threshold. | Far below 30. A share of this cell is noise and should not be drawn. |
| Latin America | 4 | Shown as a count in the medical view; folded into a single other group in the brand version, because it is below the 5-insight threshold. | Not reportable as a proportion, and small enough that the cell could point at one colleague. |
The identification problem is simpler and stricter. A cell of three insights in one small market is one or two colleagues and possibly one clinician, and a report that shows it has published something about an individual however carefully the names were removed. Folding small groups into a single other category is the standard answer, and in this solution it is a setting with a default of five.
Merge, split, or leave it alone?
Clustering produces borderline cases every quarter, and the decision is a judgement call that should be made by a person with the evidence in front of them. Three questions settle most of them.
Would the same action serve both? If two clusters would produce the same pooled analysis, the same slide module and the same standard response update, they are one theme being described two ways. Merge them, and keep both names in the statement so a reader searching for either finds it.
Does the split survive the segments? If a theme separates cleanly into community and academic clinicians, or into two regions with different questions underneath, it is probably two themes and reporting it as one will average away the only interesting thing in it.
Is the difference in the words or in the meaning? Vocabulary differences across countries are a common false split. A theme named from a translated congress note and one named from a US field note will look different and mean the same thing.
In Medical Insights Management the clustering agent proposes merges and splits and never applies one on its own; the insights lead accepts or declines, and the decision is recorded. That is the right division of labour, because a merge changes a trend line and somebody should own having changed it.
What a theme statement has to prove before anyone acts on it
A statement is a claim about a population of clinicians, and it should carry its evidence the way any other claim does. Seven checks cover it.
Seven checks before you call a theme emerging
- The baseline is stated, and it is the same length as the window
Four weeks against the four before, or quarter against quarter. Not four weeks against a twelve-week average.
- The window is stated, with its dates
A reader should be able to reproduce the count from the dates alone.
- The denominator is stated
All insights in the window, reporting colleagues, or interactions — and the same one as last time.
- The theme meets the minimum size
Below the floor, a cluster is a group of notes, not a theme. The sample setting is 25 insights.
- The sources are spread across more than one country
A single-country theme may be real and is a different claim. Say which it is.
- No single colleague dominates the count
Check the distribution by submitter. One prolific note-taker can manufacture a theme without meaning to.
- Every sentence of the statement opens the notes behind it
If a clause cannot be cited, it is the author's reading and should be labelled as one.
Twelve themes, ranked by what moved
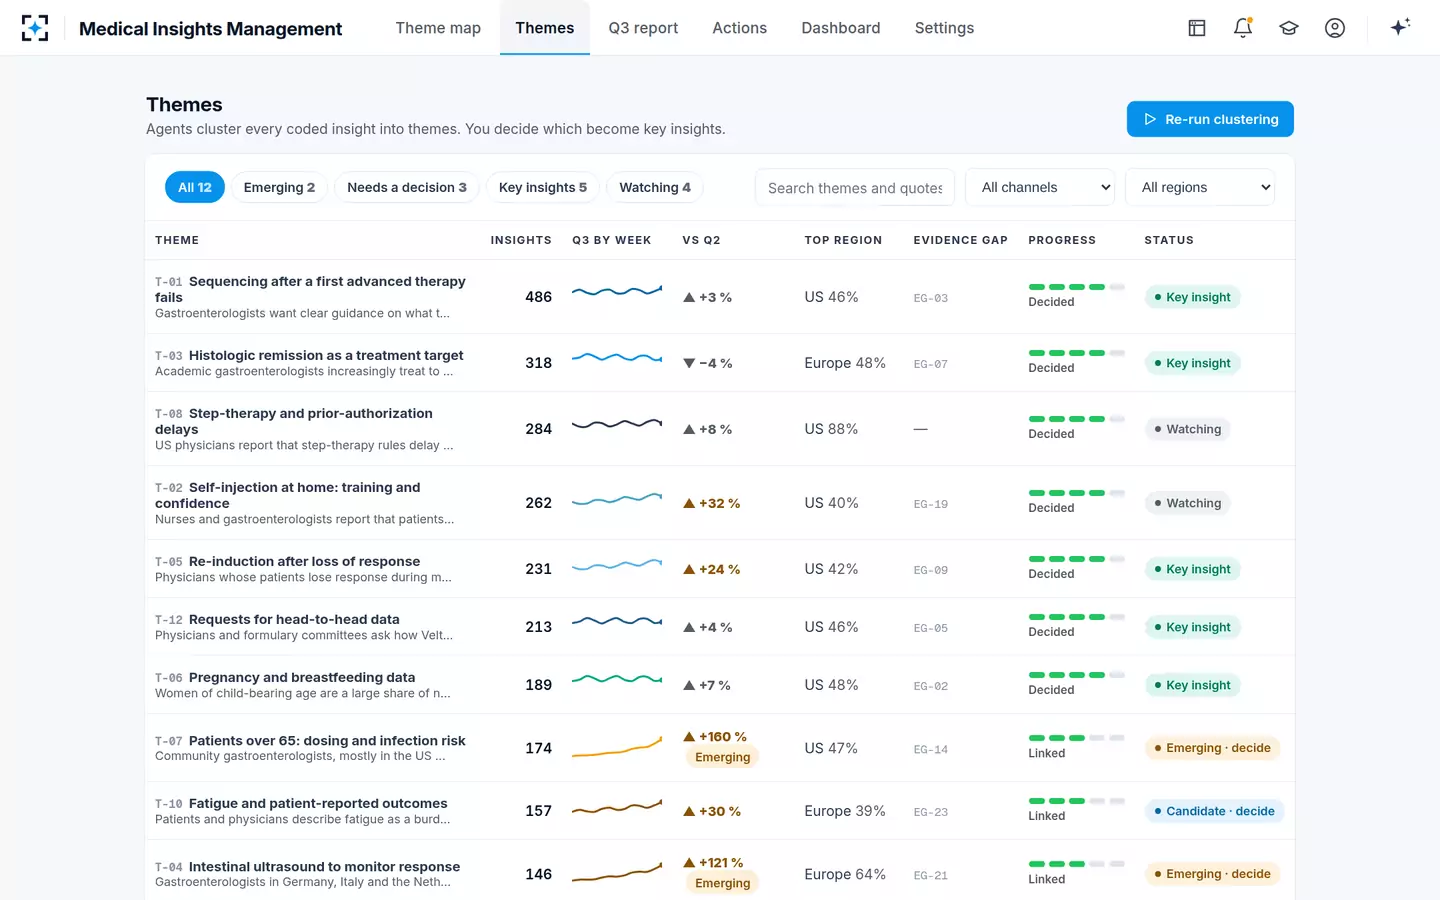
That screen makes one argument on its own. The biggest theme in the quarter has 486 insights and moved 3%; the theme everyone is about to talk about has 174 and moved 160%. A programme that reports by volume will lead with the first one every quarter, and will be describing the same stable subject for years.
Watch, decide, dismiss: a theme needs an ending
Themes that never resolve are the slow failure of an insights programme. The same cluster appears in four consecutive quarterly reports, each time described as emerging, and the leadership team stops reading the section. The cure is to require an ending: every theme that passes the rule gets a decision from a named person within the quarter, and the decision is recorded with a reason.
Four endings cover it: promote it to a key insight that goes to the leadership team with a recommendation; keep watching it, with the condition that would change that; merge it into another theme; or rule that it is not a theme, which is a legitimate and under-used answer. Keep the watching category honest rather than abolishing it: a single remark may matter only once it is seen to repeat, which is exactly what watching is for. Watching is a real state. Watching indefinitely is not.
One theme from first mention to a decision with an owner
- First mentions, below the minimum sizeQ2, unthemed
- Named as a theme and watchedlate Q2
- Monday scan flags it; evidence proposed; decided6–10 Oct
- Key insight, four owned actions with datesto Q4
The Monday alert, and the notes it rests on
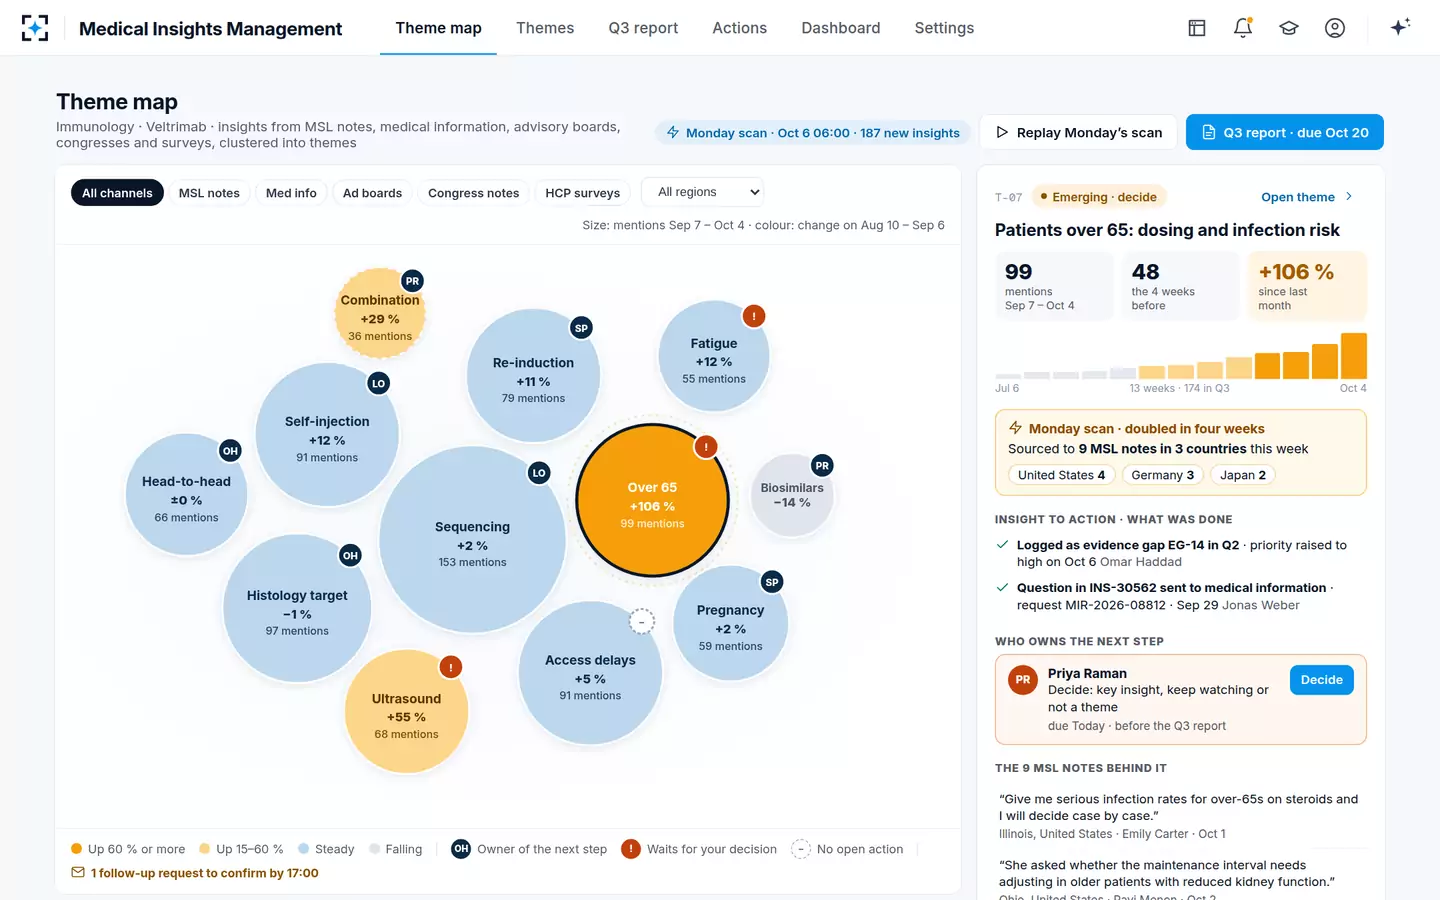
One habit is worth building into the Monday routine: before looking at what rose, look at what fell. A theme dropping by half is as informative as one doubling, and few programmes report it, because the alert was written to catch growth. In the sample data one theme is down 14% on the four weeks before, and nobody has asked why.
What the themes are made of, and why the codes underneath them have to be versioned for any of these comparisons to hold, is the subject of the coding scheme that still holds next quarter.
Questions people ask
How do you know a theme is growing and not just a busy month?
Divide by something. A raw count rises whenever listening rises, so compare mentions per reporting colleague, or mentions as a share of all insights in the window, against the same figure in the baseline period. Then check the distribution: if the rise comes from one colleague or one country, it is a local change, which may still matter but is a different claim.
How do you compare this quarter with last quarter?
On the same coding scheme version, the same channels and the same denominator, and with any congress or campaign in either quarter named in the footnote. If the scheme changed between them, either recode the earlier quarter or break the line and say why — a continuous trend across a definitional change is a common way an insights report misleads its own authors.
What is a false signal in insight data?
A rise that comes from the measurement rather than the world. Four common ones are a larger field team, a logging campaign, one unusually diligent colleague, and a survey or advisory board that asked about the topic directly — the last being the most deceptive, because it produces dozens of on-topic notes in days. Recording the channel on every insight is what lets you see it.
When should two themes be merged?
When the same action would serve both. If two clusters lead to the same evidence need, the same materials and the same owner, reporting them separately splits the count and weakens both. Keep both names in the merged statement so that a reader searching for either still finds it, and record who merged them and when, because a merge changes every trend line it touches.
How many sources does a theme need?
Enough to name it is far fewer than enough to explain it: the published interview study found the range of issues identified by nine interviews, but sixteen to twenty-four needed for a richly textured understanding. For a count-based programme, set a minimum theme size — 25 insights in the sample settings — and treat anything below it as unthemed rather than as a small theme.
Should a theme that is falling be reported?
Yes, and it often is not, because alerting rules are written to catch growth. A theme that halves may mean the question has been answered, that a competitor has changed the conversation, or that the colleagues who used to report it have moved on. All three are worth a sentence in the quarterly report, and the third is a problem with the programme rather than with the world.