Liquidity risk in mutual funds is the risk that a fund cannot meet redemptions without significantly diluting the shareholders who stay, and the best public measure of it is the SEC staff's quarterly statistics built from Form N-PORT. In the twelve months to March 2026, mutual funds reported $179bn of illiquid holdings against $131bn a year earlier, and the rise was led not by bond funds but by US equity funds, whose illiquid holdings went from $47bn to $67bn (SEC Division of Investment Management, Registered Fund Statistics, period ending March 2026). Every US open-end fund other than a money market fund must classify each holding into one of Rule 22e-4's four liquidity buckets every month and report it on N-PORT; the staff aggregate those buckets. The work is hard because the buckets are judgements made at each fund's own trade sizes, and the totals move with them. Botminds' Liquidity Risk Management Program is an agentic solution that proposes those buckets, cites the evidence for each and prepares the N-PORT liquidity fields for people to approve.
The tables below are read with their notes. They cover filings received through 6 August 2026; the staff aggregate, round and in places mask non-public data; and each fund is placed in an asset class by what it holds, not by its name. No fund is identified, here or in the source.
Illiquid holdings of mutual funds by asset class: April 2025 against March 2026
How much do mutual funds hold in illiquid assets?
Very little in aggregate, and more each month. In March 2026 mutual funds held $28.5 trillion of investments by gross value, of which $179bn, about 0.6%, was classified illiquid; a year earlier it was $131bn of $25.6 trillion, about 0.5% (Table 8.1). Against a 15% limit that looks remote. It is the wrong way to read it: the limit is per fund, and the aggregate hides a few hundred funds where illiquid holdings are a material share.
The question "are mutual funds illiquid" therefore has two answers. As a group, no: at least 90% of every asset class is in the highly liquid bucket, and more than 99% of US equity funds' holdings. Fund by fund, some are close to the line, and the staff's binned tables count them. An illiquid fund, in the rule's terms, is not a category at all; what exists is a fund with a share of illiquid investments, meaning those it "reasonably expects cannot be sold or disposed of in current market conditions in seven calendar days or less" without significantly changing their value (Rule 22e-4(a)(8)).
Liquidity risk in mutual funds, in four numbers from N-PORT
43%
rise in US equity funds’ illiquid holdings, $47bn to $67bn, April 2025 to March 2026
5×
net assets of US equity funds at 5% or more illiquid: $113bn to $572bn
162
mutual funds at 5% or more illiquid in March 2026, up from 114
of 8,117 mutual funds
0.6%
of all mutual fund investments classified illiquid, March 2026
US equity funds: illiquid holdings up 43% in a year
The largest move in the tables is in the asset class that should be the most liquid. US equity mutual funds' illiquid holdings rose from $47bn in April 2025 to $67bn in March 2026, with most of the climb from November 2025 ($47bn) to February 2026 ($67bn). The staff's report a year earlier put the April 2024 figure at $34bn, so the line has roughly doubled in two years (Table 8.1; earlier report, same series).
The tables do not say what the holdings are. They are consistent with a shift the SEC's examiners have already named: the fiscal 2027 priorities list "RICs holding complex products, less liquid or illiquid investments, including private credit" among developing areas the Division will monitor (SEC, FY2027 examination priorities, 23 October 2026). Pre-IPO shares, private placements and restricted stock inside daily-dealing equity funds would show up exactly here. A risk team that benchmarks a US equity fund against "equity funds hold almost nothing illiquid" is benchmarking against 2024.
In aggregate, US equity mutual funds are 99% highly liquid. Yet 38 of them now report 5% or more illiquid, and those 38 manage $572bn of shareholders' money.
How many mutual funds hold more than 5% illiquid?
In March 2026, 162 mutual funds reported 5% or more of net assets as illiquid, up from 114 in April 2025: 49 taxable bond funds, 38 US equity, 38 multi-asset, 26 municipal and 11 global equity (Table 8.3). The count is small against 8,117 mutual funds. The assets are not.
The net assets of US equity funds in the 5%-or-more bin rose from $113bn to $572bn, with the step change in December 2025, when the figure went from $49bn to $412bn (Table 8.2). With 38 funds in the bin, that is an average of about $15bn a fund, against about $5bn for the 21 funds there a year earlier: our arithmetic on the staff's figures, and the clearest sign that large equity funds, not boutiques, have crossed the 5% line.
Net assets of mutual funds at 5% or more illiquid, by asset class
Where the less liquid bucket lives
Less liquid investments, those that sell within seven days but settle later, are mainly a taxable bond story: taxable bond funds held between $134bn and $139bn of them in every month of the year, while global equity funds held under $25bn in eleven of the twelve months and US equity funds under $25bn in all of them (Table 8.1). The SEC has noted that "the vast majority of bank loan investments reported by open-end funds are classified as less liquid" (89 FR 73764, footnote 162), and in 2022 it proposed treating the whole bucket as illiquid. The proposal was not adopted, so a loan fund can still hold a large less liquid share without touching the 15% limit, while its cash arrives days after the redemption it is meant to pay.
Liquidity risk by asset class: the share of mutual fund holdings outside the highly liquid bucket, March 2026
| Asset class | Not highly liquid | Moderately liquid | Less liquid | Illiquid |
|---|---|---|---|---|
| Global equity | 6.1% | $112bn | $97bn | $30bn |
| Taxable bond | 4.6% | $73bn | $137bn | $48bn |
| Municipal bond | 2.6% | $5bn | $4bn | $14bn |
| Multi-asset | 1.2% | $24bn | $16bn | $20bn |
| US equity | 0.7% | $14bn | $12bn | $67bn |
Month-end spikes: what moves global equity funds' buckets
Global equity funds' moderately liquid holdings are the noisiest line in the tables: $293bn in April 2025, $28bn in July, $357bn in December and $112bn in March 2026, while their less liquid holdings jumped from $7bn in February to $97bn in March (Table 8.1). The staff do not explain the swings. One reading worth testing against your own funds is the calendar: a classification taken just before a long foreign market closure counts the closed days, and the SEC staff treat a long holiday closure that a fund can see coming as a liquidity risk in itself (SEC staff FAQ, Q34; the FAQ, question by question).
For a risk team the point is practical. If your own global funds' buckets move in the same months, the movement may be a day-count effect rather than a change in market depth, and the program should say so in its committee papers rather than let the board read it as deterioration. If they do not move when the aggregates do, ask why.
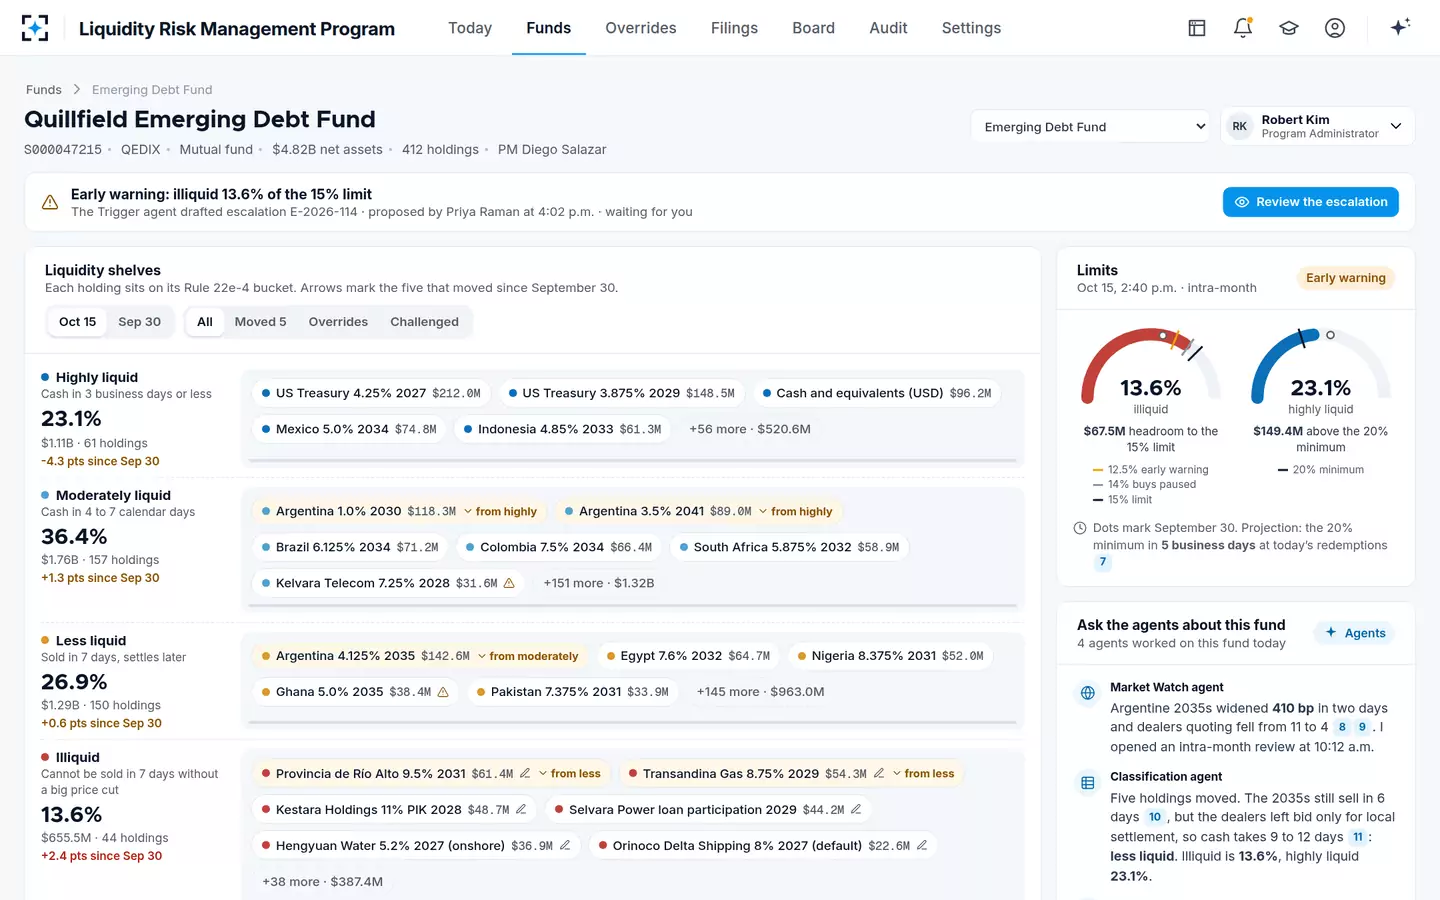
One fund's four buckets in Liquidity Risk Management Program, and what moved
What can the public see on Form N-PORT?
Holdings, yes; liquidity buckets, no. Funds report N-PORT data for every month and the public sees the third month of each quarter, but "information about liquidity and use of derivatives, remains confidential for all months of a quarter" (89 FR 73764, footnote 4). The Commission confirmed in 2024 that each investment's liquidity classification (Item C.7) and a fund's highly liquid investment minimum (Item B.7) stay non-public in individual reports, while "Commission staff may publish aggregate or other anonymized information" about them. The tables on this page are that aggregate.
Monthly public N-PORT, adopted in 2024, has been delayed to November 2027 for larger fund groups and May 2028 for smaller ones, and a February 2026 proposal would restore quarterly publication (91 FR 8582). Neither version would publish individual liquidity buckets. A fund's own bucket data will remain its own; its peers' will remain invisible except in the staff's aggregates.
How do I find a fund's liquidity classification?
From outside the fund, you cannot see it holding by holding. What you can see is the fund's public quarterly holdings on N-PORT, from which you can judge how much sits in restricted securities, loans, private placements and markets with capital controls; the fund's liquidity service providers, named on Form N-CEN since 17 November 2025 with the asset classes each one classified (89 FR 73764); and the staff's aggregates by asset class. From inside the fund, the classification is in the monthly N-PORT filing and in the program's own files, which the board and the SEC can ask to see.
Benchmarking your own funds against the SEC tables
The staff's tables are a free peer group, and they are most useful in three comparisons. First, the share: compute each fund's illiquid and not-highly-liquid shares and place it against its asset class line in Table 8.1 and its bin in Tables 8.2 and 8.3. A taxable bond fund at 6% illiquid is one of a few dozen; a US equity fund at 6% is one of fewer than forty. Second, the direction: if the asset class is moving and your fund is not, or the reverse, the difference needs a reason. Third, the method: the staff place funds by what they hold over a rolling twelve months, above 75% in one broad class and above 67% US-issued for "US equity", so a fund's own label may not be the staff's.
Reading the SEC's N-PORT liquidity tables without being misled
- Check the cut-off date
This edition reflects filings received through 6 August 2026; later amendments change the figures.
- Use the staff’s asset classes, not fund names
Prevalent asset class comes from holdings: over 75% in one broad class, rolling twelve months.
- Expect double counting
The liquidity tables include funds of funds.
- Read series, not single months
Global equity and taxable bond lines swing sharply from month to month.
- Treat masked cells as unknown, not zero
Non-public data are aggregated, rounded or masked (shown as ***), especially for ETFs.
- Compare per fund, not per industry
The 15% limit is per fund; the aggregate illiquid share of 0.6% says little about any one fund.
How Liquidity Risk Management Program prepares the fields behind the tables
Every number in the staff's liquidity tables starts as a fund's own Item C.7 entry, one bucket per holding per month. In Botminds' Liquidity Risk Management Program a Classification agent proposes each bucket from days to cash at the program's trade size and value impact, an Override agent writes the reason for anything the model cannot see from the documents themselves, a Checker agent compares the same security across every fund, and a Report agent prepares the N-PORT liquidity fields from the month's approved classifications. In the solution's sample data, a fictional 90-fund group, that is 60,418 holdings for one month end.
The approved buckets also feed the comparisons above. A fund that keeps its monthly shares by bucket, with the reason for every change, can show its board where it sits against the SEC's peer data and why it moved. How the program's people sign each step is in who classifies and who signs; what the rule requires month by month is in the mutual fund liquidity rule in 2026.
Questions people ask
Are mutual funds illiquid?
Not as a group: in March 2026 about 0.6% of mutual fund investments by gross value were classified illiquid, and at least 90% of every asset class was highly liquid. But 162 mutual funds reported 5% or more of net assets as illiquid, and those funds held hundreds of billions of dollars, so the risk sits in particular funds rather than in the industry.
What is an illiquid investment for a mutual fund?
Under Rule 22e-4, an investment the fund reasonably expects it could not sell in today's market within seven calendar days without significantly moving its value; when the sale would settle does not matter for this bucket. A fund may not buy one if that would take illiquid investments above 15% of its net assets.
Where can I download the SEC's fund liquidity statistics?
The SEC's Division of Investment Management Analytics Office publishes Registered Fund Statistics from N-PORT and N-CEN data as a PDF report with a downloadable Excel file of the history, from March 2019 for large fund groups and March 2020 for the rest. Liquidity classifications are in section 8 of the report.
Do ETFs hold illiquid investments?
Very little. In March 2026 the staff's tables show $2bn of illiquid holdings in US equity ETFs, $3bn in taxable bond ETFs and $9bn in global equity ETFs, with many binned figures masked. The tables generally exclude In-Kind ETFs, which do not classify their holdings.
Is liquidity risk in mutual funds rising?
On the SEC staff's numbers, yes in illiquid holdings: $131bn to $179bn across mutual funds from April 2025 to March 2026, and 114 to 162 funds at 5% or more illiquid. The largest rise was in US equity funds, an asset class most programs have treated as low risk.