The GIPS internal dispersion calculation takes the annual returns of the portfolios that were in a composite for the whole year and measures how far apart they are. The 2020 GIPS Standards require a measure of internal dispersion for each year in a composite report, unless five or fewer portfolios were in the composite for the full year, and they leave the choice of measure to the firm: high/low, range, or a standard deviation, equal-weighted or asset-weighted, disclosed in the report. The arithmetic is simple; the hard part is the input. Using a portfolio that joined in April, or counting a switched portfolio twice, gives a wrong figure from correct returns, and that figure then sits in every report that shows the year. Botminds' GIPS Compliance Reporting recomputes internal dispersion and the three-year standard deviation for every composite and year from the underlying returns, and turns any difference from the published figure into a question for the GIPS officer.
The worked example uses six hypothetical portfolios; our arithmetic is shown in full. Screens come from the solution's sample data, the fictional Quillfield Capital.
One composite, six full-year portfolios: the inputs to every dispersion measure
| Portfolio | Value on 1 January | Weight | 2025 return | Gap to equal-weighted mean | Gap to asset-weighted mean |
|---|---|---|---|---|---|
| A | $250m | 38.5% | 12.4% | +0.58 | +0.32 |
| B | $180m | 27.7% | 10.9% | −0.92 | −1.18 |
| C | $95m | 14.6% | 14.8% | +2.98 | +2.72 |
| D | $60m | 9.2% | 9.2% | −2.62 | −2.88 |
| E | $40m | 6.2% | 16.1% | +4.28 | +4.02 |
| F | $25m | 3.8% | 7.5% | −4.32 | −4.58 |
| All six | $650m | 100% | Means: 11.82% equal-weighted, 12.08% asset-weighted | Squares sum to 53.91 | Weighted squares sum to 4.07 |
What is GIPS internal dispersion?
Internal dispersion is a measure of how consistently a firm managed the portfolios in one composite over a year. The glossary of the 2020 standards defines it as "a measure of the spread of the annual returns of individual portfolios within a composite. Measures may include, but are not limited to, high/low, range, and standard deviation (asset weighted or equal weighted) of portfolio returns" (GIPS Standards for Firms, 2020).
It answers a prospect's practical question: if I hand you a portfolio for this strategy, how close to the composite's return is mine likely to be? A composite return of 12% with dispersion of half a point says the strategy is run tightly to a model. The same return with dispersion of four points says portfolios differ widely, through client restrictions, timing or the manager's latitude, and a single client's experience may be far from the headline. That is why provision 4.A.1(i) puts it in the table for every year, beside the return it qualifies.
It is a cross-section, not a time series. Internal dispersion compares different portfolios over the same year. It says nothing about how volatile the composite was month to month, which is the job of the three-year standard deviation, discussed below.
When is internal dispersion required, and when can a report show n/a?
It is required for each annual period unless five or fewer portfolios were in the composite for the full year. In the standard's words: "If the composite contains five or fewer portfolios for the full year, a measure of internal dispersion is not required" (4.A.1i). When the firm leaves it out for that reason, it "must disclose that the internal dispersion measure is not applicable or use similar language" (4.C.40). The threshold therefore sits at six full-year portfolios, which is why the example here has exactly six.
The full-year count is separate from the number of portfolios the table shows. The portfolio count in column (f) is taken at year end, and it may be omitted when there are five or fewer at that date (4.A.1f). A composite can end the year with eight portfolios and still have only five that were there all year: it shows eight in one column and n/a in the next, and both are right.
Some firms show dispersion even below six. The standards do not forbid it, but a standard deviation of four numbers says little, and many firms follow the cut-off in CFA Institute's sample policy, under which "If there are fewer than 6 portfolios included in the composite for the full year, no internal dispersion measure is shown" (CFA Institute, policies and procedures manual guide, 2023).
Which portfolios go into the calculation?
Only portfolios that were members of the composite for the entire calendar year. CFA Institute's guide spells out the steps: firms "must identify the portfolios in the composite that have been included for the full annual period and calculate the annual return for each of those portfolios", and use those returns to calculate dispersion. Three kinds of portfolio fall out even though they contributed to the composite's monthly returns:
A portfolio that joined during the year, even on 1 February. One that terminated during the year, even in December. And one removed for any month under a significant cash flow policy or a minimum asset level, because a single month out makes it a part-year member. The last case surprises firms with a low cash flow threshold: every removal also thins the dispersion population, and enough of them can push a composite under six. How the significant cash flow level is set has that trade-off in numbers.
Each portfolio's annual return must be its own time-weighted return for the year, geometrically linked from monthly returns, not a figure from a client statement that may use another method or a different fee basis.
The worked example: six portfolios, four measures
The table at the top gives six portfolios and their 2025 returns. Here is each measure the glossary names, worked from those numbers.
High/low simply reports the best and worst portfolio: 16.1% and 7.5%. Range is the difference, 8.6 percentage points. Both are easy to read and to re-perform, and both are set entirely by the two extreme portfolios, so one unusual account dominates them.
Equal-weighted standard deviation treats each portfolio as one observation. The mean of the six returns is 11.82%. Square each portfolio's gap to that mean, add the six squares (53.91), divide by six, and take the square root: 3.00%. This is the population form, which is what Excel's STDEVP function returns and what CFA Institute's sample policy names. Dividing by five instead of six, the sample form, gives 3.28%.
Asset-weighted standard deviation weights each portfolio by its beginning-of-year value. The asset-weighted mean is 12.08%. Multiply each squared gap to that mean by the portfolio's weight, add them (4.07), and take the square root: 2.02%. The two largest portfolios, A and B, sit close to the mean and carry two-thirds of the weight, so the asset-weighted figure is a third lower than the equal-weighted one.
Six portfolios, one year: the spread every dispersion measure is trying to describe
One set of returns, four correct answers
3.00%
Equal-weighted standard deviation (population)
3.28% in the sample form
2.02%
Asset-weighted standard deviation
Weighted by beginning-of-year value
16.1/7.5
High/low, in percent
Set by the two smallest portfolios
8.6pts
Range
High minus low
Equal-weighted or asset-weighted dispersion: which should you use?
The standards do not prefer either; the firm chooses, discloses its choice, and applies it consistently. CFA Institute's guide says it directly: "The GIPS standards do not require or recommend a specific measure of a composite’s internal dispersion." Provision 4.C.10 requires only that "the firm must disclose which measure of internal dispersion is presented."
The choice changes what the number means. Equal weighting describes the typical client's experience: every account, large or small, counts once, so a prospect with a mid-sized mandate sees how spread out accounts like theirs were. Asset weighting describes where the money was: it matches the way the composite return itself is calculated (2.A.36), so the dispersion figure and the return figure describe the same population. When small accounts behave differently from large ones, as in the example, the two measures diverge, and a firm should know which story it is telling.
A firm may change its measure, but the change shows. The sample report printed in the 2020 standards discloses that its firm switched in 2014: "internal dispersion is calculated using the equal-weighted standard deviation of annual gross returns of those portfolios that were included in the composite for the entire year. Prior to 2014, internal dispersion was calculated using asset-weighted standard deviation." A reader can then see that the column is two series, not one.
Internal dispersion vs the three-year standard deviation
They measure different things and sit side by side in the same table. Internal dispersion compares portfolios within one year; the three-year annualized ex post standard deviation measures how volatile the composite and its benchmark were over the 36 months to each year end (4.A.1j).
Two numbers in the same row of a GIPS composite report
Internal dispersion: How far apart the portfolios' returns were within one year.
Three-year standard deviation: How much the composite's monthly return varied over three years, and the same for the benchmark.
Internal dispersion: One annual return per full-year portfolio.
Three-year standard deviation: 36 monthly composite returns, and 36 monthly benchmark returns.
Internal dispersion: Six or more portfolios in the composite for the full year (4.A.1i).
Three-year standard deviation: Monthly composite returns exist; if 36 are not yet available the report says so (4.A.1j, 4.C.36).
Internal dispersion: The firm's choice of high/low, range or a standard deviation, disclosed (4.C.10).
Three-year standard deviation: An annualized standard deviation, calculated the same way for composite and benchmark.
Internal dispersion: The firm's policy; the standards' own sample uses gross returns.
Three-year standard deviation: The firm must disclose whether gross or net returns were used (4.C.44); gross is recommended for risk measures (2.B.7).
The three-year figure is usually calculated as the standard deviation of the 36 monthly returns, multiplied by the square root of 12 to annualize it; CFA Institute's sample policy uses STDEVP and then "The result is multiplied by the square root of 12." A composite whose monthly returns have a standard deviation of 1.20% therefore shows 4.16% in the table. The same formula must be used for the composite and the benchmark, so the two numbers can be compared.
The two figures fail differently. Internal dispersion goes wrong when membership is wrong. The three-year standard deviation goes wrong when a monthly return is restated, including the benchmark's: in the solution's sample data, the index vendor restated two monthly returns and a high-yield composite's 2025 benchmark figure moved from 4.91% to 4.88%.
Three ways a correct calculation gives a wrong dispersion figure
Every error below starts with correct portfolio returns and ends with a wrong number in the report.
Errors that survive a formula check, and how to catch them
- A part-year portfolio left in
Add to the example a seventh portfolio that joined on 1 April and earned 3.1% for nine months: the equal-weighted figure rises from 3.00% to 4.12%. Test each portfolio's membership months, not just its return.
- A switched portfolio counted in two composites
Its history stays with the old composite (3.A.10); in CFA Institute's sample policy it leaves under the terminated-portfolio rule and joins under the new-portfolio rule, so in the year of a mid-year move it is a full-year member of neither. Reconcile each year's list to the membership history.
- An outlier that is really a data error
Verifiers must review portfolios whose returns "significantly deviate" from the rest and confirm there are no input or calculation errors (verification procedure 8). Check outliers before you publish them.
- A change of measure nobody disclosed
If the firm moves from asset- to equal-weighted, the report must still say which measure is shown (4.C.10). Keep the measure and its effective date in the written policy.
The first error is the common one, and it is quiet. In the solution's sample data, a published 2024 internal dispersion of 0.38% included two portfolios that joined the composite on 1 April 2024; with only the 43 full-year portfolios, the recomputed figure is 0.44%. The returns were right, the formula was right, and the number in every report showing 2024 was wrong. Whether such a change must be disclosed and sent to prospects is a question for the firm's error correction policy, and what one error costs once it has been distributed shows how different policies answer it.
How GIPS Compliance Reporting recomputes dispersion every quarter
In the solution, the Statistics agent recomputes composite returns, internal dispersion from full-year portfolios only (not shown under six) and the three-year standard deviation from 36 monthly returns for composite and benchmark, for every composite and every year in its report, and compares each with the published figure. At the sample firm that is 80 composites over ten years, 2,400 figures, of which three differed.
Statistics recomputed in GIPS Compliance Reporting: three differences in 2,400 figures
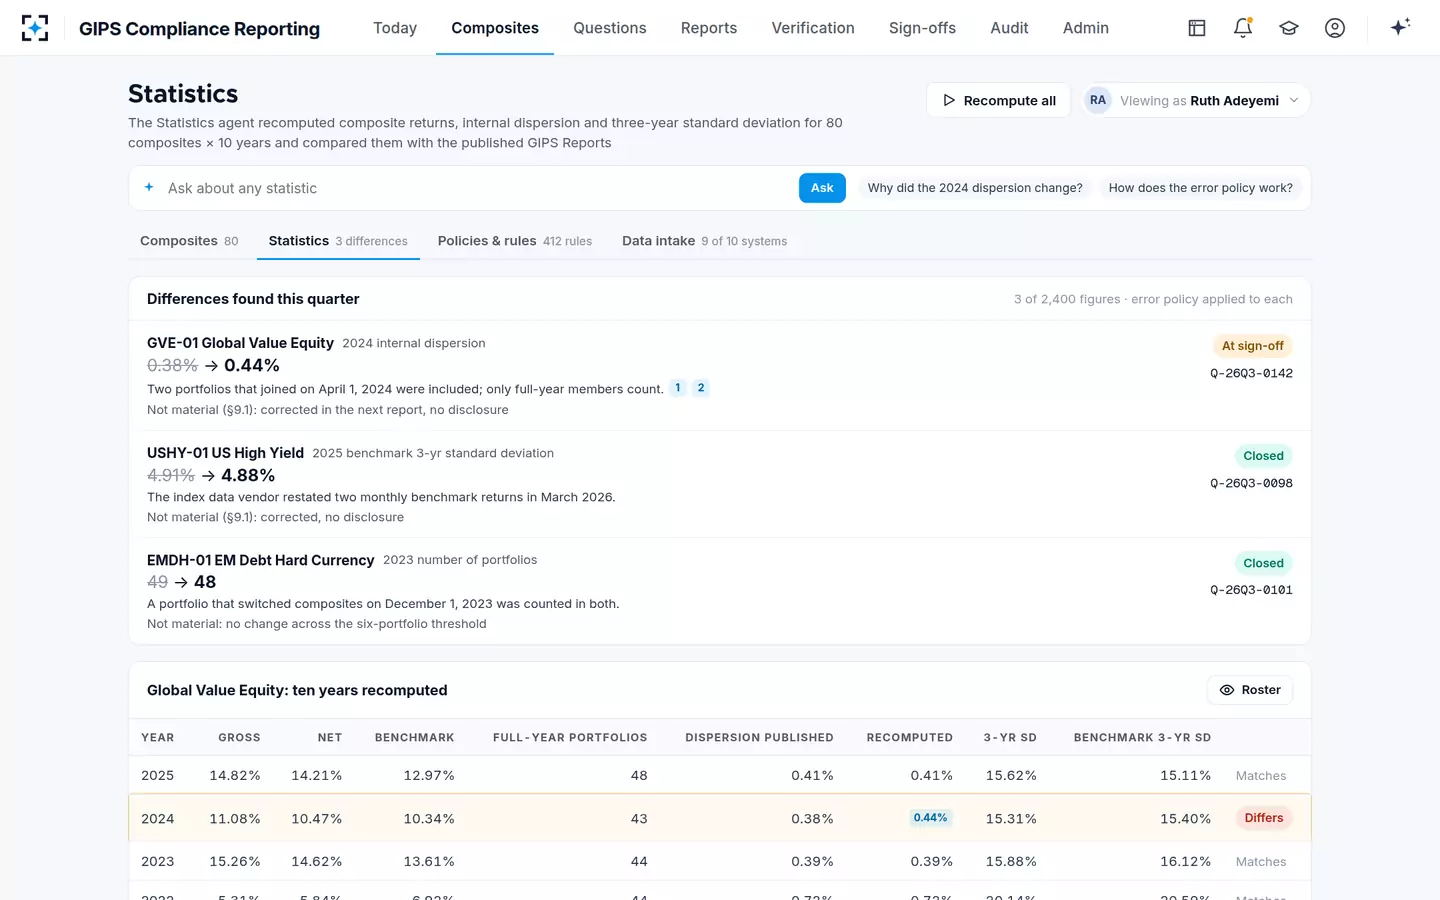
The agent never overwrites a published figure. Each difference becomes a question with the firm's error policy applied, and the GIPS Compliance Officer signs the correction; the report that carries it is redrafted and held until she does. The officer's morning view puts that item beside the membership decisions waiting for her.
The GIPS officer's morning in GIPS Compliance Reporting: the dispersion correction waits for her
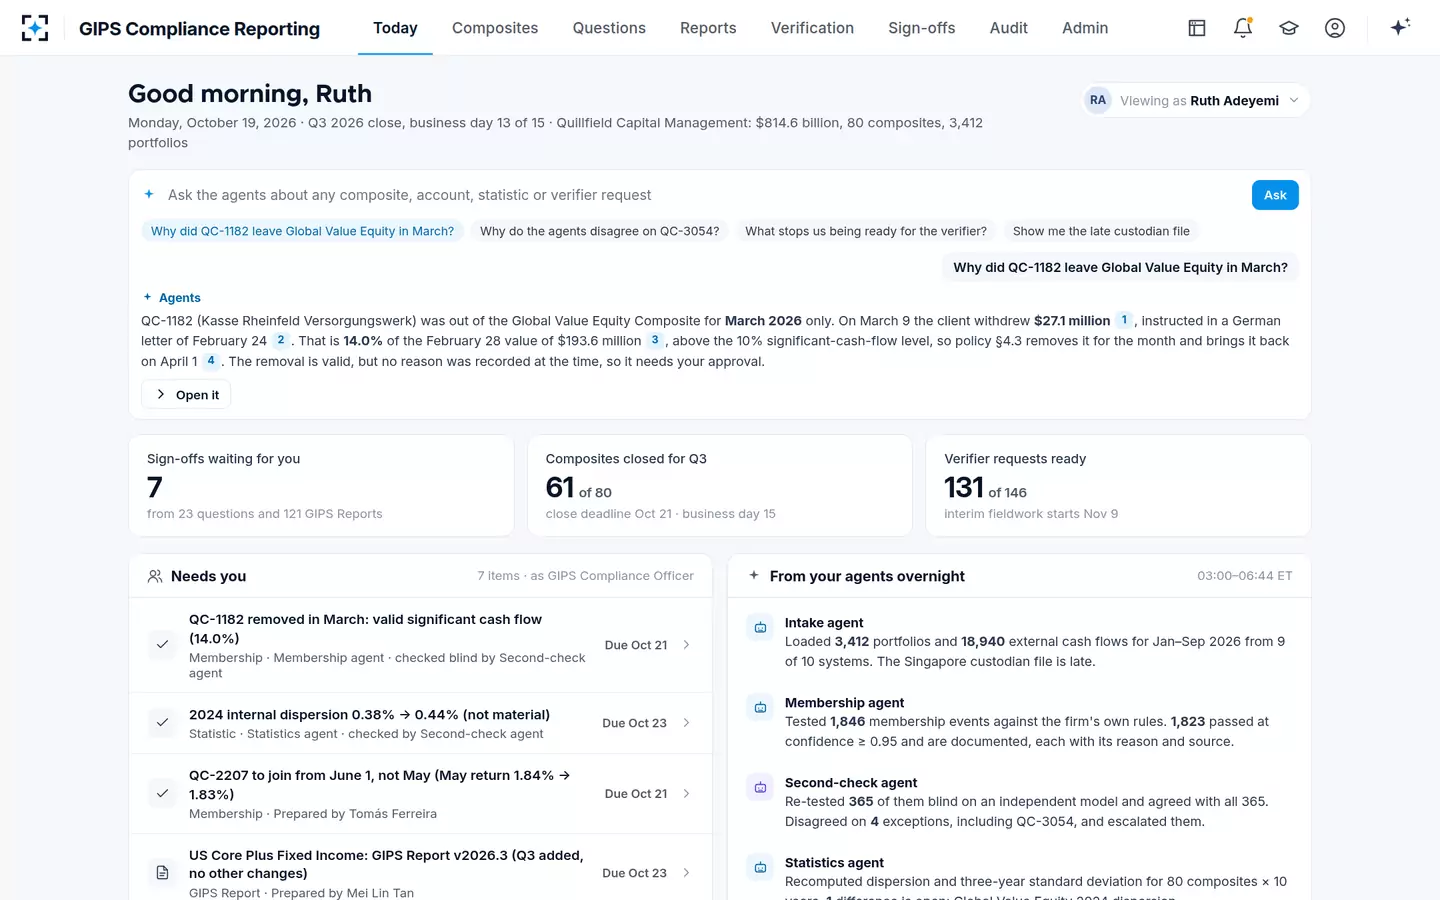
The same recomputation is what the composite report's table rests on; the annotated composite report shows where each statistic sits and which provision requires it. The full workflow is on the GIPS Compliance Reporting page.
Questions people ask
What is GIPS composite dispersion?
It is another name for internal dispersion: the spread of the annual returns of the portfolios in a composite over one year. The report must show a measure for each year when six or more portfolios were in the composite for the full year, and say which measure it is (4.A.1i, 4.C.10).
What if a composite has exactly five full-year portfolios?
Internal dispersion is then not required, and if the firm leaves it out the report must say the measure is not applicable (4.C.40). The year-end portfolio count is a separate test, so the table may still show more than five portfolios in that year.
Is internal dispersion calculated on gross or net returns?
The standards leave it to the firm's policy. Their sample report uses gross returns of full-year portfolios, and gross returns avoid differences in fee schedules widening the spread; whichever the firm uses, it should apply it consistently and describe it with the measure.
Does internal dispersion use annual or monthly returns?
Annual: one return per portfolio for the full calendar or fiscal year, linked from that portfolio's monthly returns. Monthly returns feed the three-year standard deviation, which is a different statistic.
What is a good internal dispersion figure?
There is no benchmark figure; it depends on the strategy. A model-driven large-cap strategy may show well under one point, while a strategy that tailors portfolios to client restrictions may show several. A sudden rise from one year to the next is worth more attention than the level.
How is the three-year standard deviation annualized?
Usually by multiplying the standard deviation of 36 monthly returns by the square root of 12, the method in CFA Institute's sample policy. A monthly standard deviation of 1.20% becomes 4.16% annualized, and the benchmark must be calculated the same way.