Consensus estimates are the average, usually the mean or median, of the forecasts that sell-side analysts covering a company have contributed to a data provider for a given figure and period: earnings per share for the quarter, revenue for the year. They are the market's shorthand for what is expected, and a company "beats" or "misses" against them. But consensus is not a fact about the company; it is a statistic about other people's opinions, and it inherits their flaws. Some estimates are weeks old and pre-date the company's last guidance; some are on a different basis from the company's adjusted figure; the feed itself may lag on a busy morning. A buy-side team that writes "beat consensus" should be able to say which consensus, made of which estimates, at what time. Botminds' Equity Research Automation labels every comparison with the consensus snapshot it used, alongside the team's own house estimate, so the portfolio manager knows whose number the beat is measured against.
The worked example below is illustrative arithmetic; the screens and the Marlowe Brands figures are fictional sample data from the solution. Research and SEC figures are linked where they appear.
One published consensus, three kinds of estimate inside it
Twelve estimates behind a $1.27 consensus
- 6 updated after guidance was cut: $1.25 · 50%
- 4 stale, before the cut: $1.40 · 33.3%
- 2 on a GAAP basis: $1.05 · 16.7%
What are consensus estimates?
Consensus estimates are a summary of analysts' published forecasts for a company, compiled by a data provider and updated as analysts revise. The usual measures are earnings per share and revenue for the coming quarter and fiscal years, and increasingly the line items and company-specific metrics a model carries: segment sales, gross margin, a subscriber count. Data providers compile them from the estimates contributing sell-side analysts submit; no regulator publishes a consensus.
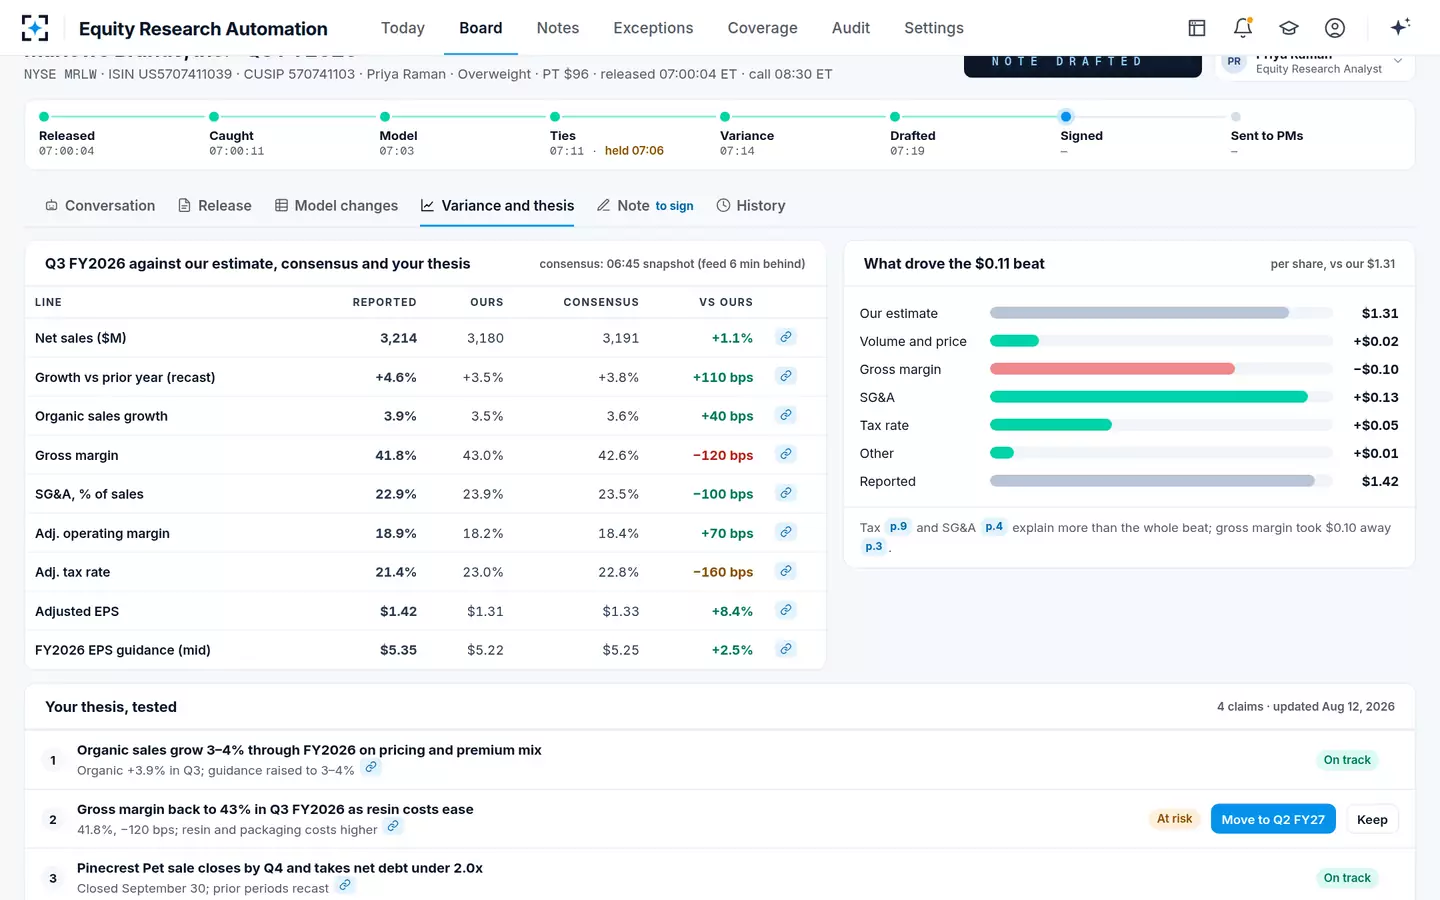
For a buy-side analyst, consensus is one of two expectations a result is measured against. The other is the house estimate, the firm's own forecast, which is what its portfolios are positioned on. A result can beat one and miss the other. On the sample morning, Marlowe Brands reported adjusted EPS of $1.42 against a house estimate of $1.31 and a consensus of $1.33; on gross margin, it reported 41.8% against the house 43.0% and a consensus of 42.6%.
How are consensus estimates calculated?
Consensus is usually the mean or the median of the current estimates in a provider's database, sometimes after excluding estimates the provider considers outdated or out of line. Each choice changes the number. A mean is pulled by a single outlier; a median is not. An estimate entered a month ago counts the same as one entered yesterday unless the provider ages it out. And an estimate's basis, the company's adjusted figure or GAAP, depends on what the contributing analyst forecasts.
Research on which summary works best is old but clear. O'Brien compared the mean, the median and the most recent forecast as proxies for expected earnings and found the most current forecast at least as accurate as the mean or median, evidence that when a forecast was made matters more to its accuracy than which analyst made it (Journal of Accounting and Economics 10(1), 1988). The practical rule for a research team follows: look at the dates inside the consensus, not only its level.
Are consensus estimates accurate?
On average they are closer to the result than simple statistical forecasts; O'Brien found analysts more accurate than time-series models. But they are biased in a known direction near the announcement. Richardson, Teoh and Wysocki studied the allegation of an "earnings-guidance game" in which "analysts first issue optimistic earnings forecasts and then 'walk down' their estimates to a level that firms can beat at the official earnings announcement", and found the walk-down "most pronounced when firms or insiders are net sellers of stock after an earnings announcement" (Contemporary Accounting Research 21(4), 2004).
Matsumoto found the same game from the company's side: firms with more transient institutional owners and more value-relevant earnings "are more likely to meet or exceed expectations", and both managing earnings upward and guiding forecasts down "play a role in avoiding negative earnings surprises" (The Accounting Review 77(3), 2002). A consensus that has been walked down is accurate in one sense, it lands near the result, and misleading in another: the beat it produces was arranged.
Why do analysts revise estimates?
Analysts revise when new information changes their view: the company's own results and guidance, a peer's results, macro data, a management meeting, or a change in their own model. Revisions cluster around earnings, because the release and call carry the most new information. They also respond to incentives. In a survey of 365 sell-side analysts, Brown, Call, Clement and Sharp report that "issuing earnings forecasts and stock recommendations that are well below the consensus often leads to an increase in analysts' credibility with their investing clients" (Journal of Accounting Research 53(1), 2015).
The same survey found that analysts rank private communication with management above their own primary research and recent 10-K and 10-Q reports as an input to their forecasts. That is legitimate when the conversation carries no material nonpublic information, and it is why consensus can move in a block after a company's investor relations team speaks to the analysts who cover it.
What happens when a company guides analysts down?
If the company guides the market down in public, consensus moves and nobody has done anything wrong. If it guides selected analysts down in private with material nonpublic information, it breaks Regulation FD, which requires an issuer that intentionally discloses such information to securities market professionals, investment advisers among them, to make it public "simultaneously" (17 CFR 243.100(a)). The largest penalty the SEC has obtained under the rule came in a case about exactly that.
According to the SEC's complaint, AT&T learned in March 2016 that a fall in smartphone sales would cause revenue to fall short of analysts' estimates, and "to avoid falling short of consensus revenue expectations for the third consecutive quarter", its investor relations executives made private calls to analysts. The complaint alleges that the information "caused analysts to substantially reduce their revenue forecasts, allowing AT&T ultimately to beat the overall consensus revenue estimate when AT&T reported its results to the public on April 26, 2016". AT&T agreed in December 2022 to pay a $6.25 million penalty (SEC press release 2022-215, December 5, 2022). The guide to Regulation FD covers the rule in full.
For a buy-side reader the lesson is about the denominator. A beat against a consensus that was moved by selective disclosure, or walked down by guidance, says less about the quarter than the headline suggests. The house estimate, and the record of when it was last changed and why, is the steadier comparison.
What is a whisper number?
A whisper number is an unofficial forecast of earnings that circulates among investors, separate from the published consensus and often higher. Research found it can be the better guide to what the market actually expects. Bagnoli, Beneish and Watts compared whisper forecasts with published analyst forecasts and found that "whispers are, on average, more accurate than First Call forecasts and are better proxies for market expectations of earnings than are First Call forecasts" (working paper, 1998; published in the Journal of Accounting and Economics 28(1), 1999).
The finding explains a familiar puzzle: a company that beats the published consensus and falls on the day may simply have missed the number the market was really holding. It also explains why the link between surprise and return is loose; Kinney, Burgstahler and Martin found that even perfect advance knowledge of a surprise gave at most a 0.622 probability of a trading gain for an individual firm (Journal of Accounting Research 40(5), 2002). A whisper is not a number a research note can cite, but it is a reason not to over-read a beat.
House estimate, consensus and whisper: three expectations, three uses
Published consensus: The mean or median of contributing sell-side analysts' current forecasts, compiled by a data provider.
House estimate: The firm's own forecast, set by the covering analyst and kept in the analyst's model.
Published consensus: Whatever each contributor forecasts, usually the company's adjusted figure; can mix bases.
House estimate: One basis, chosen by the analyst and stated in the model.
Published consensus: As fresh as its oldest included estimate; the feed can lag on busy mornings.
House estimate: As of the analyst's last approved change, with the date and reason on record.
Published consensus: Walk-down to beatable levels near the announcement; herding; guided by management.
House estimate: The analyst's own; visible and attributable.
Published consensus: Context: how the market will read the result. Name the time of the snapshot.
House estimate: The decision: what the result means for the firm's positions and thesis.
Stale and mixed-basis: two ways consensus misleads
Consensus misleads in two ordinary ways, neither of them anyone's fault. It goes stale when some contributors have not updated after the company's latest guidance or a major event, so the average mixes a current view with an old one. It mixes bases when some contributors forecast the company's adjusted figure and others forecast something else, so the average describes no figure the company will report.
The worked example at the top of this page shows how much that matters at the margin. Twelve estimates average $1.27; the six current, like-for-like ones average $1.25. A result of $1.26 is a miss against the published number and a beat against the current one. The gap between the two expectations is two cents, and it is the difference between the headline a portfolio manager reads and the one the evidence supports. The non-GAAP rules are part of the fix: under Regulation G, a company that publishes an adjusted figure must present the most directly comparable GAAP measure and a reconciliation (17 CFR 244.100), so the basis of the actual can always be checked. The basis of the consensus has to be checked with its provider. Earnings surprise: how one wrong number turns a miss into a beat covers the actual's side of the same formula.
Equity Research Automation's variance screen: every line against the house estimate and a named consensus snapshot
Record which consensus you used
The fix is a habit more than a technology: every note that compares a result with consensus records which consensus, from which source, at what time, on which basis. Then a portfolio manager reading the note, or an auditor reading it a year later, can see exactly what "beat" meant.
What to record when a note compares a result with consensus
- Source and time of the snapshot
Which provider, and the time the figure was taken. On a busy morning the feed can lag; say so.
- Mean or median, and how many estimates
A consensus of three estimates is not a consensus of twenty.
- The oldest estimate included
If some pre-date the company's latest guidance, say how many, or compare with the current ones as well.
- The basis
Adjusted or GAAP, and whether it matches the company's reported figure, checked against the Regulation G reconciliation.
- The house estimate beside it
With the date of its last change and the reason, so the reader sees both expectations.
- Any line-item consensus used
Revenue, margin and segment consensus are thinner than EPS consensus; note the count.
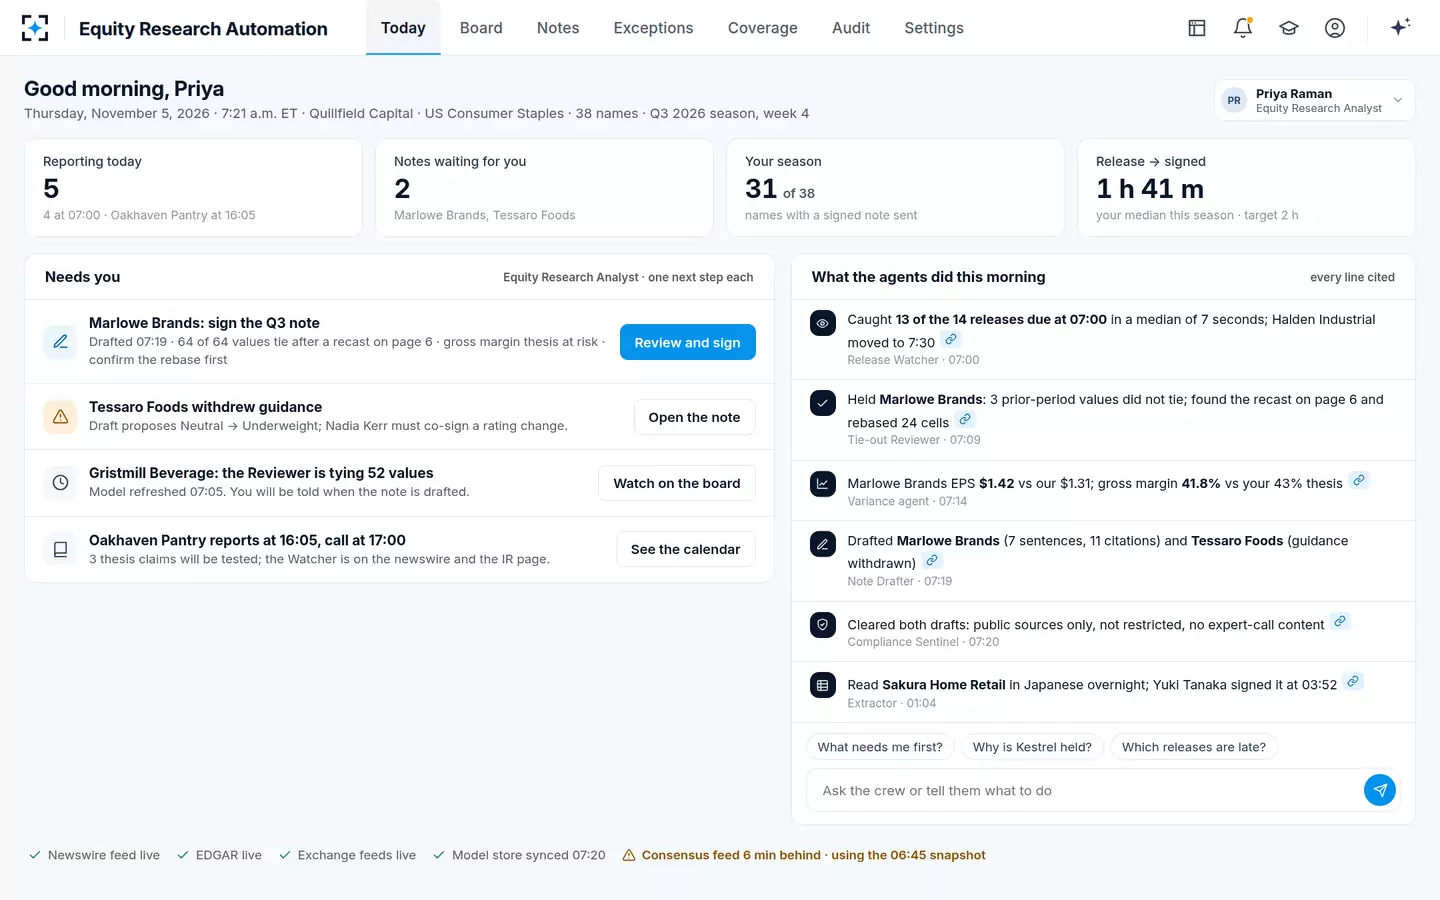
In the solution, the Variance agent compares actuals and guidance with the house estimate, consensus and each thesis claim, and every comparison carries its source. When the consensus feed ran six minutes behind on the sample morning, the analyst's screen showed a system strip, "Consensus feed 6 min behind · using the 06:45 snapshot", and the variance screen labelled every consensus figure with the same snapshot. The note Priya Raman signed at 7:26 compared the result with both numbers.
The analyst's morning in Equity Research Automation, with the consensus feed's lag on screen
Where to find consensus estimates
Consensus estimates come from commercial financial data providers, which compile contributing analysts' forecasts and license the results; many market news services display a headline EPS and revenue consensus. Some companies also post a consensus they have compiled from the analysts who cover them. No regulator publishes one, and providers differ in which analysts they include, how they age estimates and which basis they use, so two "consensus" figures for the same quarter can differ.
For a buy-side team, the useful consensus is the one its data licence provides at line-item level, recorded with its time stamp in the note. In the solution, consensus by line item comes from the firm's own market data and consensus feed; the agents read it, compare against it and label it, but do not compile it. To see the comparison run on your own names and feeds, start from Equity Research Automation.
Questions people ask
What does consensus estimate mean?
The average of the forecasts that analysts covering a company have published for a figure, such as next quarter's earnings per share. It stands for what the market expects, and a result above it is called a beat, below it a miss.
Is consensus the mean or the median?
Either, depending on the provider and the field; some show both. The median resists a single outlying estimate. O'Brien's 1988 study found the most recent individual forecast at least as accurate as either, which is why the dates of the estimates matter.
What is the difference between consensus and guidance?
Guidance is the company's own forecast, published by management; consensus is the average of analysts' forecasts. Analysts usually move their estimates toward guidance, which is why research on the "walk-down" finds consensus drifting to beatable levels before an announcement.
Why did a stock fall when it beat consensus?
The published consensus may not have been the expectation that mattered. Investors may have held a higher whisper number, the guidance may have disappointed, or the beat may have come from tax or a one-off rather than operations. Research finds the link between surprise and return loose even with perfect knowledge of the surprise.
How many analysts make up a consensus?
As many as cover the company and contribute to the provider, which can be one or two for a small company and dozens for a large one. A consensus of very few estimates is fragile; a note should say how many were included.
Should a buy-side note compare with consensus or the house estimate?
Both, labelled. Consensus shows how the market will read the result; the house estimate shows what it means for the firm's own positions. In the solution, every comparison shows both, with the consensus snapshot's time.