An earnings surprise is the difference between what a company reports and what was expected, usually earnings per share against the consensus of analysts' estimates, and often stated as a percentage of the expected figure: report $1.42 against an expected $1.33 and the surprise is $0.09, or 6.8%. The formula is trivial. The hard part is that both numbers have to be the right ones. The actual can be GAAP or adjusted, on the old basis or on a recast one, in thousands or in millions; the expectation can be the house estimate, a consensus snapshot from an hour ago, or a consensus on a different definition. Get one of them wrong and a miss reads as a beat. Botminds' Equity Research Automation is built so that the actual is tied to the page it came from, and any recast found, before a variance is computed or a note says beat.
The worked example on this page is fictional sample data from the solution: Marlowe Brands' third-quarter results at the sample firm Quillfield Capital. Research and rule figures are linked where they appear.
The life of one actual in Equity Research Automation, from the release page to 'beat'
Agent
Release WatcherCatches the release 7 seconds after it posts and confirms it reports full results, not a pre-announcement; matches the 8-K, Item 2.02.
Agent
ExtractorWrites net sales of $3,214M from page 1 into the analyst's model, with its page and a 99.8% confidence.
Never: touch a forecast cell
Agent
Tie-out ReviewerRe-reads with a second model; prior-year sales in the model ($3,188M) do not match the release ($3,073M). Finds page 6: a business sold and prior periods recast.
Never: fix a value by guessing; the note is held
A person decides
Covering analystOpens page 6 and confirms the rebase of 24 history cells. Growth is now +4.6%, not +0.8%.
Agent
Variance agentComputes each surprise on the confirmed figures: against the house estimate, against the 06:45 consensus snapshot, and what drove it.
Never: change an estimate
A person decides
Covering analyst, then the checkerDecides what the surprise means for the estimate and thesis, signs; a second person releases.
What is an earnings surprise?
An earnings surprise is the gap between a company's reported earnings and the market's expectation of them, measured at the moment of the announcement. A positive surprise is a beat; a negative one is a miss. The expectation is usually the consensus of sell-side analysts' forecasts, though a buy-side team also measures surprise against its own house estimate, which is the number its portfolio managers have been positioned on.
The idea extends beyond EPS. Teams track revenue surprise, margin surprise and surprise on the company's own key metrics, and a portfolio manager may weigh those more than the headline. A beat on EPS that came from a lower tax rate, with a miss on gross margin, is a different result from a beat on volume and price, and a good note says which it was.
How is earnings surprise calculated?
Earnings surprise is calculated as the actual figure minus the expected figure; as a percentage, that difference divided by the absolute value of the expected figure. Researchers often scale it differently, by share price or by the spread of analysts' forecasts, so that a $0.05 surprise on a $1 stock and on a $100 stock are not treated alike. For a research note, the simple percentage against a named expectation is usually what a portfolio manager wants, provided both numbers are stated.
One release, four surprises: the same adjusted EPS of $1.42 against different expectations
| Measured against | Expected | Surprise | What it tells the reader |
|---|---|---|---|
| House estimate | $1.31 | +$0.11, +8.4% | How far the result is from what the firm's portfolios are positioned on. |
| Consensus, 06:45 snapshot | $1.33 | +$0.09, +6.8% | How far it is from the market's average expectation, at a stated time. |
| House estimate, excluding the lower tax rate | $1.31 | +$0.06, about +4.6% (on about $1.37) | How much of the beat came from operations rather than tax. |
| Consensus, excluding the lower tax rate | $1.33 | +$0.04, about +3.0% | The same question against the market's number. |
The table makes the first lesson concrete: there is no single surprise, only surprises against named numbers. A headline that says a company "beat by 7%" has chosen one row. A buy-side note should say which row it is reporting, and the variance screen in the solution labels the consensus as "the 06:45 snapshot" because on the sample morning the consensus feed ran six minutes behind.
One release, three ways the actual goes wrong
Most false surprises come from the actual, not the expectation, and three errors account for the ones that matter: the wrong basis, the wrong history and the wrong unit. Each is visible in the release itself, on a page an analyst on a crowded morning may not reach.
The wrong basis. The release leads with an adjusted figure; the consensus may be on the adjusted basis or not; the 10-Q will carry GAAP. Comparing an adjusted actual with a GAAP-based expectation, or the reverse, manufactures a surprise. The wrong history. When a company sells a business, it recasts prior periods to show the business as discontinued; growth computed against last year's old figure is growth against a company that no longer exists. The wrong unit. A segment table in thousands read as millions, or a per-share figure on basic rather than diluted shares, produces a surprise of any size you like.
One recast, two growth rates: the Marlowe Brands example
0.8%
net sales growth against last year's figure as it stood in the analyst's model
4.6%
growth against the recast prior year on page 6 of the release
24cells
of history across 8 quarters rebased to the recast table, each cited
3of 64
values that failed to tie at first, holding the note until explained
On the old base, Marlowe's growth would have read +0.8%, against a house estimate of +3.5% and a consensus of +3.8%: a clear miss. On the recast base it is +4.6%: a beat of about a percentage point. Nothing about the quarter changed between those two readings. Only the denominator did.
What is the difference between GAAP and non-GAAP earnings?
GAAP earnings follow the accounting standards in the financial statements; non-GAAP earnings are figures a company defines itself, usually excluding items it calls non-recurring or non-cash. SEC rules allow non-GAAP measures with conditions. Under Regulation G, a company that publishes one must also present "the most directly comparable financial measure calculated and presented in accordance with Generally Accepted Accounting Principles (GAAP)" and a reconciliation between the two (17 CFR 244.100(a), eCFR current to Oct. 23, 2026). In filings, the GAAP measure must appear "with equal or greater prominence" (17 CFR 229.10(e)(1)(i)(A)), and Form 8-K applies that requirement to earnings releases furnished under Item 2.02 (Form 8-K, Item 2.02, Instruction 2).
For surprise, the question is which number the expectation was built on. Bradshaw and Sloan documented that "there is a very strong bias toward the reporting of a Street earnings number that exceeds the GAAP earnings number", and that "the market response to the Street earnings number has displaced GAAP earnings as a primary determinant of stock prices" (Journal of Accounting Research 40(1), 2002). They also found that management "has taken a proactive role in defining and emphasizing the Street number". The adjusted number is the one the market trades, which is exactly why its definition has to match the expectation's.
Restatement or recast: why last year's number moves
Last year's number moves for two different reasons, and only one of them is an error. A restatement corrects a mistake. The SEC's then Acting Chief Accountant described the two kinds in March 2022: a correction of an error material to past statements is "sometimes referred to colloquially as a reissuance restatement or a 'Big R' restatement"; a correction made in the current period's comparatives is "sometimes referred to colloquially as a revision restatement or a 'little r' restatement" (SEC, Paul Munter, statement of March 9, 2022).
'Little r' revision restatements as a share of all restatements
A little r restatement does not come with an 8-K or a headline; the corrected prior-period figure simply appears in the comparative column. An analyst who compares this quarter with last year's figure as it stood in the model, rather than as it now stands in the release, is measuring against a number the company has corrected. The SEC's statement notes that little r restatements rose to nearly 76% of the total by 2020.
A recast is different: nothing was wrong. The SEC staff's Financial Reporting Manual lists the events that require "retrospective revision" of prior financial statements when they are reissued, and "such events include reporting a discontinued operation, a change in reportable segments, or a change in accounting principle for which retrospective application is either required or elected" (SEC Division of Corporation Finance, Financial Reporting Manual, Topic 13). The Marlowe case is the first kind. Either way, the comparison must use the figure as the company now presents it.
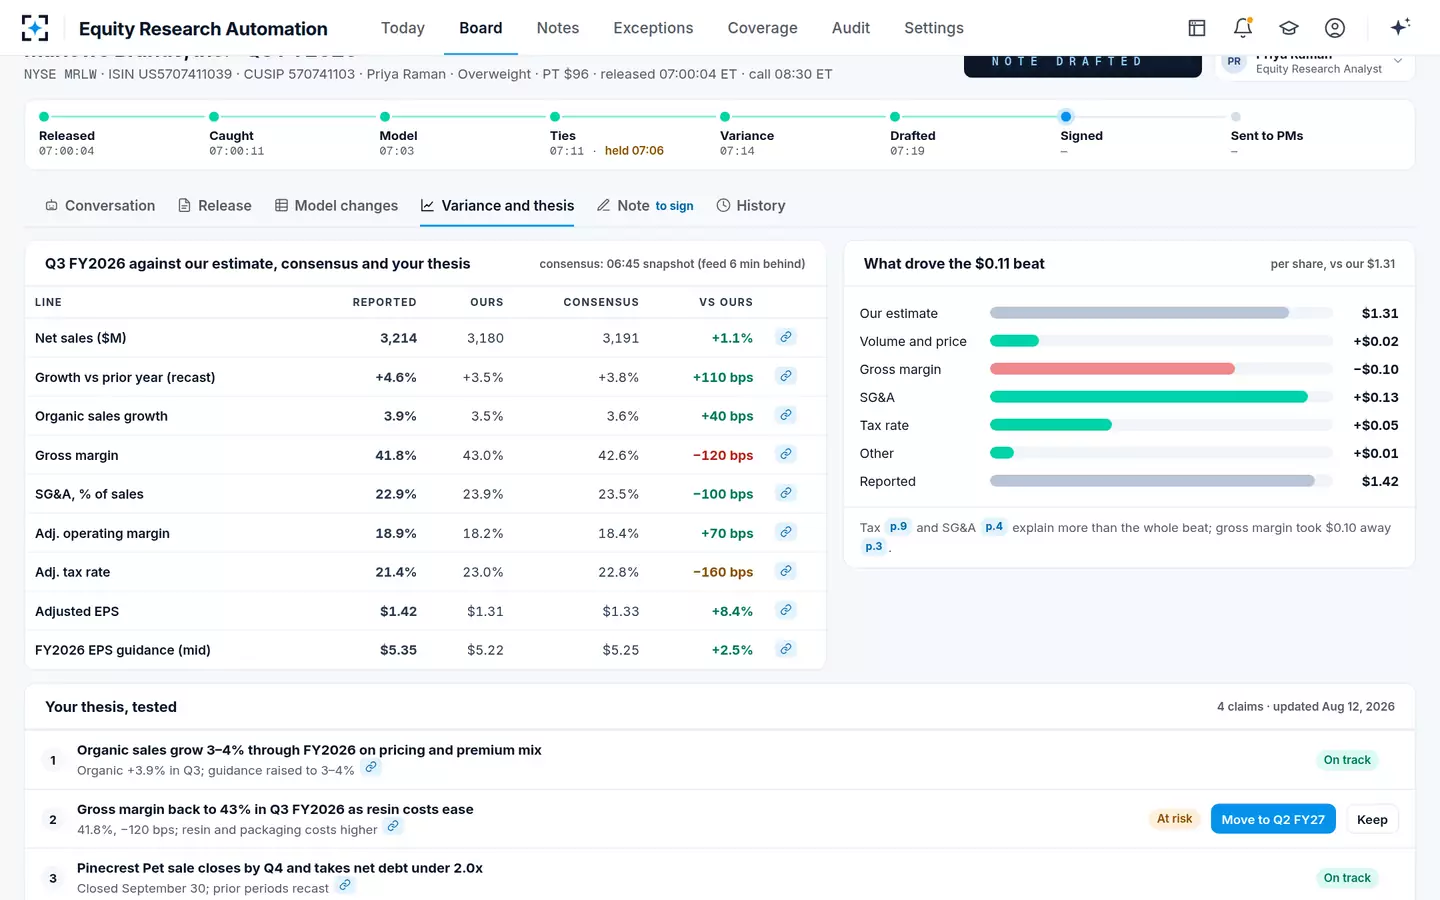
The variance screen in Equity Research Automation: each line against estimate, consensus and thesis
Why do stocks fall after beating earnings?
Because the price reacts to the whole release, not to the EPS line, and because the expectation that mattered may not have been the published consensus. A beat built on a lower tax rate, with a margin miss underneath, can disappoint. So can a beat accompanied by weaker guidance, or a beat smaller than investors privately expected.
The research shows how loose the link between a surprise and the return is. Kinney, Burgstahler and Martin studied surprise portfolios built from First Call data for 1992 to 1997 and found that "for an individual firm, the maximum probability of a gain from trading on prior knowledge of any surprise magnitude is .622", owing to "the S-shaped surprise/return relation and the large variance of returns for a given magnitude of surprise" (Journal of Accounting Research 40(5), 2002). In the working-paper version, returns had the opposite sign to the surprise for about 45% of the observations in each portfolio (SSRN working paper, 1999). Even perfect knowledge of the surprise, in other words, is a weak guide to the day's move.
Timing affects it too. Hirshleifer, Lim and Teoh found weaker immediate reactions and more drift when many companies announce on the same day, and DellaVigna and Pollet found the same pattern for Fridays (Journal of Finance, 2009; Journal of Finance, 2009). A surprise on a crowded Thursday may still be working its way into the price the following week.
What is a beat and raise?
A beat and raise is a quarter in which a company reports results above expectations and raises its guidance for the period ahead. Marlowe Brands' sample quarter is one: adjusted EPS above both the house estimate and consensus, and full-year guidance raised to $5.30 to $5.40 a share. On that guidance, the draft note proposed raising the fiscal 2026 estimate from $5.22 to $5.34.
Even a beat and raise needs the same discipline. The raise is a new expectation, on the company's own definitions; the analyst should check that the guided measure is defined as before, that the raise is not simply the beat carried forward plus nothing, and that the thesis claims still hold. In the sample, one of the four claims, gross margin back to 43% as resin costs ease, was at risk despite the beat, and the analyst moved it to the second quarter of fiscal 2027.
Tie the actual before anyone says beat
A surprise should be computed only on an actual that has been tied to its page, on the same basis, history and unit as the expectation. That is a checklist a team can run by hand or have agents run on every name.
Before calling a beat or a miss
- Same basis
Adjusted against adjusted, GAAP against GAAP. Read the reconciliation the release must carry under Regulation G.
- Same history
Look for recast or revised prior periods in the release before computing growth; rebase the model, with the page cited.
- Same unit and share count
Thousands or millions; basic or diluted shares; the release's own rounding.
- A named expectation
House estimate, or consensus with its time stamp. Say which in the note.
- The source of the beat
Bridge it: volume, price, margin, costs, tax, share count. A tax-driven beat is not an operating beat.
- Totals that add up
Re-add segments to the total. A gap that last quarter's "other" line closed may not close this quarter.
- A hold when anything fails
An untied figure should stop the note, not travel in it with a caveat.
The last item is the one that changes behaviour. On the sample morning another company's segments added to $1,212 million while its total said $1,216 million, and last quarter a $3 million 'other' line had closed the gap; this quarter there was none. The agents could not tell which figure was right, so the note was held, and the portfolio manager's digest showed the name as held, "no note until the analyst decides". A note can wait for the 10-Q. A wrong surprise cannot be recalled once a portfolio manager has acted on it. Consensus estimates: whose number a beat is measured against covers the other half of the formula.
To see every figure tied before the variance, start from Equity Research Automation.
Questions people ask
What is the earnings surprise formula?
Surprise equals actual minus expected; as a percentage, divide by the absolute value of the expected figure. In the sample, adjusted EPS of $1.42 against a consensus of $1.33 is a $0.09 surprise, or 6.8%. Researchers often scale by share price or by the dispersion of forecasts instead.
What is a negative earnings surprise?
A reported figure below the expectation, a miss. The same checks apply in reverse: a miss computed against an unrecast prior year, or a GAAP actual against an adjusted expectation, can be an artefact of the comparison rather than of the quarter.
What is post-earnings announcement drift?
The tendency of a stock's price to keep moving in the direction of an earnings surprise for some time after the announcement, as if the market under-reacted. Research links it to limited attention: Hirshleifer, Lim and Teoh found more drift when many companies report on the same day.
Do analysts compare against GAAP or adjusted EPS?
Usually the company's adjusted figure, because that is what consensus tracks; Bradshaw and Sloan found that the market's response to the Street figure had displaced GAAP earnings as a primary driver of prices. Regulation G requires the GAAP figure and a reconciliation alongside it, so both can be checked.
What is a little r restatement?
A correction of an error that was not material to past statements but is corrected in the current period's comparative figures, without reissuing the old statements. The SEC's then Acting Chief Accountant noted in 2022 that these had risen to nearly 76% of restatements by 2020, which is why prior-period figures should be re-read each quarter.
Is a recast the same as a restatement?
No. A restatement corrects an error; a recast re-presents correct prior figures on a new basis, for example after a business is sold and shown as discontinued, or after segments change. Both change the comparison base, and both should be cited when a model's history is rebased.