Deposit attrition modeling is the estimation of how much of a deposit balance will leave over a period, and, when it is used for pricing, how that loss changes with the rate offered: the chance a maturing certificate or a balance stays at each rate the institution might pay. Every deposit pricing recommendation leans on such an estimate, stated or not. That makes it a model in the supervisory sense, to be tested against what depositors actually did, at the horizon it predicts; it also makes it a place where protected characteristics can enter pricing unnoticed, and where false precision does damage. Botminds' Deposit Pricing puts the estimate beside every counteroffer with its confidence band, its model version and its back-test, excludes protected characteristics and close proxies from its inputs, and recommends nothing when the band is too wide.
Where this page uses the solution's figures, they are sample data on a fictional institution, Norrell Federal Credit Union, a $6.8 billion credit union. The back-test grid below is illustrative and is not the sample.
A retention back-test laid out by cohort: only cohorts whose horizon has run can be scored
Q4 2024
Predicted78%
Band72–84%
Stayed 12 months80%
VerdictInside the band
Q1 2025
Predicted77%
Band71–83%
Stayed 12 months74%
VerdictInside the band
Q2 2025
Predicted80%
Band74–86%
Stayed 12 months71%
VerdictBelow the band: investigate
Q3 2025
Predicted79%
Band73–85%
Stayed 12 months82%
VerdictInside the band
Q4 2025
Predicted81%
Band75–87%
Stayed 12 months—
VerdictTwelve months not yet run: interim checks only
2026 cohorts
Predicted—
Band—
Stayed 12 months—
VerdictInterim checks only: kept at maturity, after 30 and 90 days
What is deposit attrition modeling?
Deposit attrition modeling estimates the share of deposits that will leave, by product, cohort and horizon. Its mirror image is retention: the share that stays. For certificates the natural unit is the maturity: of the money coming due this month, how much renews, and how much of that is still there a year later. For pricing, the question becomes conditional: how much stays at the board rate, at a counteroffer, at the depositor's full ask.
Three functions use the same estimate. Pricing uses it to decide whether an exception buys enough retention to pay for itself. Liquidity forecasting uses it to project cash flows, and the FDIC's examination manual says so directly:
Forecasts for maturing time deposits, particularly those obtained through special rate promotions, can be enhanced if the analysis considers the probable retention rate of maturing deposits.
FDIC, RMS Manual of Examination Policies, Section 6.1, Liquidity and Funds Management (10/2025)
Interest rate risk measurement uses a cousin of it, the decay rate on balances without a maturity. Keeping the three on one estimate, or at least on reconciled ones, is a governance choice worth making early, because an institution that assumes one retention rate when it prices and another when it forecasts liquidity is contradicting itself in front of the same examiner.
What is the difference between deposit attrition and decay?
Attrition measures money leaving at a decision point, such as a certificate's maturity or a rate offer, and is estimated by cohort; decay measures how balances without a maturity run off over time and is an assumption in interest rate risk models. The two overlap in data and differ in use, and mixing them up produces estimates that answer the wrong question.
Deposit attrition and deposit decay: two estimates, two jobs
| Attrition (or retention) at a price | Decay of non-maturity balances | |
|---|---|---|
| What it estimates | The chance a balance stays at a decision point, at each rate offered | How fast balances without a maturity run off, month by month |
| Typical products | Certificates at maturity; balances when a rate is renegotiated | Savings, money market, checking |
| Horizon | The term of the price being offered, often twelve months | Years, for economic value of equity and income simulations |
| Main user | The pricing desk and the rate committee; liquidity forecasts | ALM and interest rate risk |
| Key input | The offered rate against the depositor’s alternative | Rate sensitivity (beta) and runoff by vintage |
| Tested by | Predicted against actual for each cohort, once its horizon has run | Deposit studies and back-testing of model assumptions |
A certificate also carries an option the decay concept does not: the depositor can break it. The OCC describes it plainly: "Early withdrawal rights are like 'put' options on deposits. When rates increase, the market value of customers' deposits declines, and customers have the right to 'put' the deposits back to the bank" (OCC, Comptroller's Handbook, Interest Rate Risk, 2020). An attrition model for certificates therefore has two parts, the renewal decision at maturity and early withdrawal during the term, and the second depends on the penalty and on how far market rates move. Deposit decay rate: what a stale assumption costs covers the non-maturity side.
How do you predict deposit attrition at a quoted rate?
Predict deposit attrition at a quoted rate by modelling the stay-or-leave outcome on the things that drive it at the moment of decision: how the offered rate compares with the depositor's alternative, how long the relationship has lasted, what else the depositor holds, the balance and term, and how the depositor behaved at earlier maturities. The result is a curve, the chance of staying at each candidate rate, not a single number.
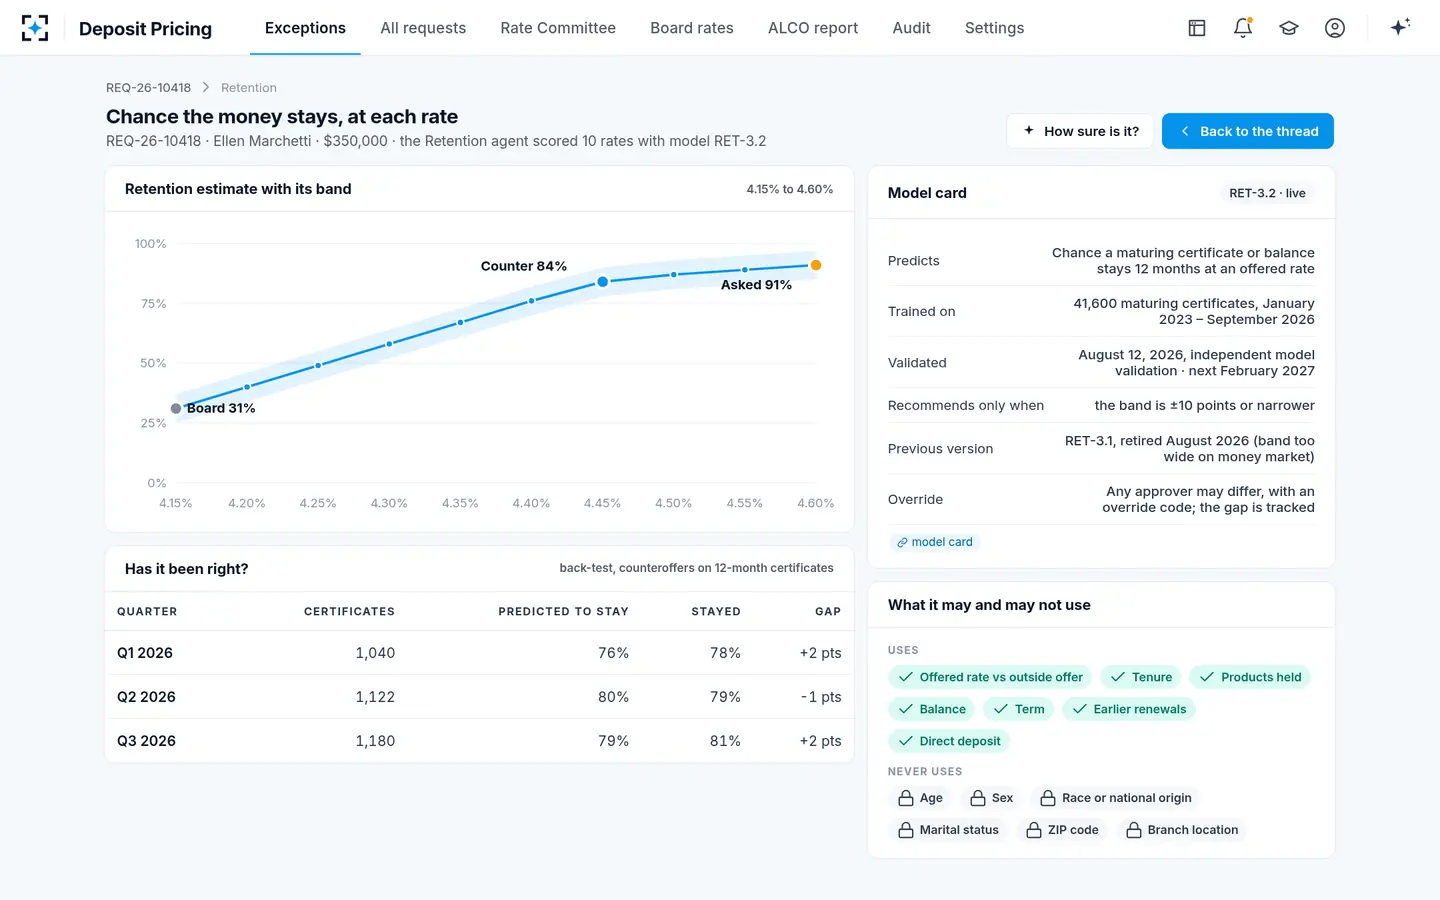
The sample's model, RET-3.2, is built that way. It uses the offered rate against the outside offer, tenure, products held, balance, term, earlier renewals and direct deposit, was trained on 41,600 maturing certificates from January 2023 to September 2026, and was validated independently in August 2026. On the sample request its curve rises from 31% at the 4.15% board rate to 84% at a 4.45% counteroffer and 91% at the 4.60% ask. The flattening near the ask is the shape that matters for pricing: the last 15 basis points buy 7 points of retention, where the first 30 bought 53.
Research points to drivers a model should be built to see. Using 12 million accounts at 154 US credit unions, Argyle, Iverson, Kotter, Nadauld and Palmer find that "10% of depositors" control "70% of total deposits" and that, "Unlike low-balance households, high-balance retail depositors are not sensitive to interest rate shocks" (NBER working paper 34742, 2026, not yet peer reviewed). Lu and Wu, measuring depositor attention, report that "banks with more inattentive depositors have lower deposit rates, weaker pass-through, and less spread-sensitive outflows" (NBER working paper 34783, 2026, not yet peer reviewed). Balance and attention are not straight lines: a model that treats every dollar alike will misprice the depositors who hold most of them.
Retention at each rate, with its band, its model card and the inputs it may not use
Is a deposit retention model a model under SR 26-2?
Yes, in substance. The interagency model risk guidance issued with SR 26-2 in April 2026 defines a model as a complex quantitative method that applies statistical, economic or financial theory to turn input data into quantitative estimates, and excludes simple arithmetic and deterministic rule-based processes (Revised Guidance on Model Risk Management, April 17, 2026). A statistical estimate of the chance a balance stays at each rate fits that definition. The guidance's footnote places generative and agentic AI outside its scope while applying its principles to traditional statistical models and to AI that is neither generative nor agentic.
Three qualifications matter. The letter says it is most relevant to banking organizations with more than $30 billion in assets; the OCC's version says the guidance sets no enforceable standards and that not following it will not bring supervisory criticism (OCC Bulletin 2026-13); and the guidance asks for rigor in proportion to a model's materiality, judged by its exposure and purpose. A retention model that sets the price of thousands of exceptions a month is not immaterial. What SR 26-2 changed and ALM model validation under SR 26-2 set out the rest. The practical reading for a pricing desk is short: the retention model gets validation and outcomes analysis; the agents around it, out of the guidance's scope, get the institution's own controls, which in the sample means they cannot approve, cannot change the authority matrix and cannot recommend on a wide band.
What inputs should a retention model exclude?
A retention model used for pricing should exclude protected characteristics and close proxies for them, data not available when the price is set, and anything that is the outcome in disguise. The first list is the one most often argued about, because some of those variables predict retention well, and that is exactly the problem: a model rewarded for accuracy will offer less to whoever is least likely to leave.
Inputs a pricing retention model should not use, and why
- Age
It may predict staying in some books, and it is a protected characteristic in credit law; pricing on it would pay older depositors less if they tend to stay.
- Sex, race, national origin, marital status
Protected characteristics; no pricing policy should depend on them, whether or not a statute covers deposits.
- ZIP code and branch location
Close proxies for the above and for local competition; they let geography decide price without anyone choosing it.
- Credit score, income, employer
Not needed to price a deposit, and a privacy risk on every view that shows them.
- Anything known only after the decision
Whether the depositor accepted, later balances, later contacts: the outcome leaking into the predictor.
- Investigation or restriction details
A restricted account shows only that it is restricted, never why, on any pricing view.
The exclusions have a cost in accuracy, and an institution should measure it rather than assume it away: fit the model with and without the excluded variables on the same data, and report the difference. A small loss is the price of a pricing policy the institution can explain. A large one is a sign the remaining inputs are weak, not a reason to readmit the excluded ones. What agents may propose, and what none may sets the same limits for the agents that use the estimate.
How do you back-test a retention estimate?
Back-test a retention estimate by comparing, for each cohort whose horizon has fully run, the share the model predicted would stay with the share that did, and by checking whether the actual share falls inside the model's own band. The guidance calls this outcomes analysis, comparing model outputs with real-world outcomes, and treats back-testing as one form of it; persistent misses outside the institution's tolerance call for adjustment, recalibration or redevelopment.
The horizon is where back-tests most often go wrong. A model that predicts the chance a renewed twelve-month certificate stays twelve months cannot be scored on certificates renewed three months ago. The grid at the top of this page scores only cohorts whose twelve months have run, and treats later cohorts with interim checks: the share that accepted at maturity, and the share still there after 30 and 90 days. Interim checks are early warnings, not a back-test; publishing them as one overstates what is known.
One quarter's pricing decisions, from estimate to full score
- Decisions pricedQ4 2025
- Interim checks: maturity, 30 and 90 daysQ1 2026
- Waiting for twelve months to runto Q3 2026
- Full score and validation reviewQ4 2026
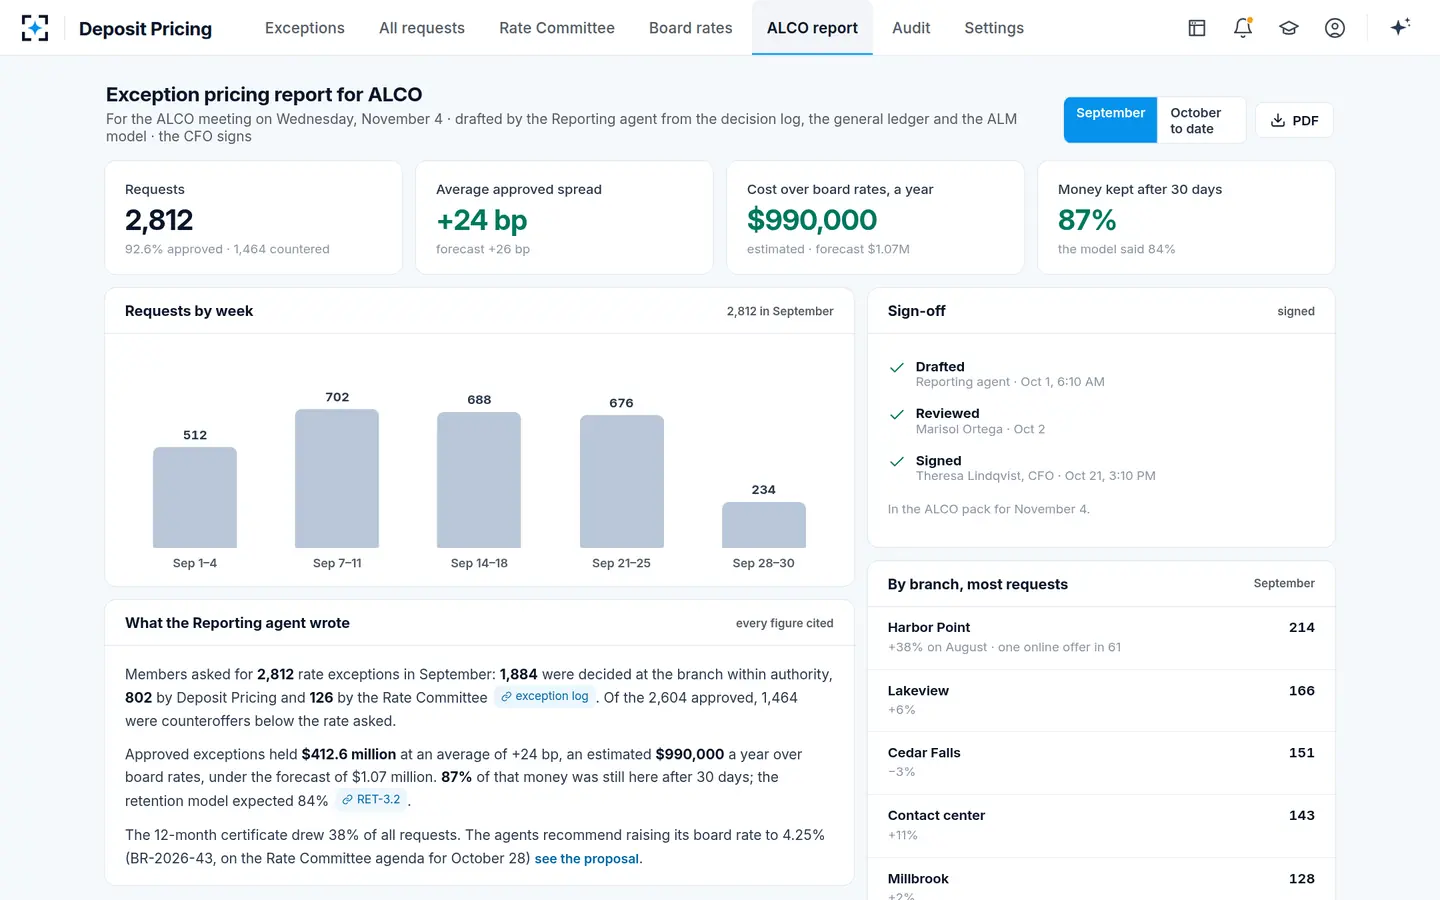
Two further cuts make a back-test useful. Calibration by band: of the decisions where the model said 80 to 90%, did 80 to 90% stay? And performance by rate offered: a model can be right on average and wrong exactly where pricing decisions are made, near the ask. The sample's September report to ALCO shows an interim check of this kind, 87% of approved-exception money still there after 30 days against 84% expected; the full test of the same decisions comes a year later.
The monthly ALCO report: cost of exceptions and money kept against what was expected
What is a confidence band for retention, and when to refuse
A confidence band for retention is the range within which the model expects the true share staying to fall, given the data behind the estimate. A narrow band means many similar past decisions; a wide one means few, or decisions unlike this one. The band is not decoration. It is what tells an approver whether 84% means 84% or "somewhere between 60% and 100%".
A pricing system should refuse to recommend when the band is too wide, and say so, rather than price on a guess. The sample rule is ±10 points: on the sample request the band at the counteroffer was 78% to 90%, ±6, so the agents recommended; on a wider band they show the numbers and recommend nothing. The rule has already retired one model. RET-3.1 was withdrawn in August 2026 because its band was too wide on money market accounts. A model that cannot say how sure it is gets retired; a model that can, and is not sure, stays silent.
How digital banking changes deposit attrition
Digital banking makes deposits quicker to leave when rates move, which means attrition estimated on yesterday's depositors can understate tomorrow's. Koont, Santos and Zingales model the effect, writing that "The model predicts that digitalization increases the sensitivity of deposit levels and rates to changes in the Fed funds rate", and test it on US bank data (NBER working paper 32601, 2024, not yet peer reviewed); the decay rate guide sets out their empirical finding. The sample's competing offer came from an online bank, as did 61 of one branch's 214 September requests.
For an attrition model the lesson is about its training window and its tests, not about adding a "digital" variable. A model trained on January 2023 to September 2026, as the sample's is, has seen one rate cycle and one generation of apps; when rates or channels shift, its back-test is the first place the shift should show, and the band is the first thing that should widen. A desk that watches both will reprice on evidence rather than on the last cycle's memory. The marginal cost of funds for one CD exception shows how the estimate enters the price; to see it beside a live counteroffer, start from Deposit Pricing.
Questions people ask
What is deposit attrition, in plain words?
Deposit attrition is money leaving: accounts closed, balances withdrawn or certificates not renewed. Attrition modeling estimates how much will leave, and for pricing, how much less will leave at a higher rate. The sample model puts the chance a $350,000 certificate stays at 31% at the board rate and 84% at a counteroffer 30 basis points higher.
How often should a retention model be back-tested?
As often as cohorts complete their horizon, with interim checks in between. A twelve-month model can be fully scored each quarter on the cohort decided a year earlier, and checked monthly on newer cohorts at maturity and after 30 and 90 days; the sample reports a 30-day check to ALCO every month.
Should a credit union build its own attrition model?
It needs one, built or bought, if it prices exceptions on the chance money stays. Whatever its origin, it should be validated by someone independent of its development and back-tested on the credit union's own maturities. The sample model was trained on 41,600 maturing certificates from January 2023 to September 2026 and validated independently in August 2026.
Can an attrition model use the competing offer?
Yes, and it should: the gap between the offered rate and the depositor's alternative is the most direct driver of the decision. It should use the offer as verified, term for term, and treat an unverified offer as weaker evidence rather than as the true alternative.
What should happen when a back-test fails?
Investigate the cohort, then recalibrate, adjust or redevelop the model as the institution's policy says, and narrow its use in the meantime. A model whose band is widened by the failure will stop recommending on its own under a rule like the sample's ±10 points, leaving approvers to price on the other evidence.