A deposit decay rate is the share of a non-maturity deposit balance, such as savings, money market or checking, that is expected to leave the institution over a year. Because these deposits have no contractual maturity, an economic value model needs the decay rate to decide how long they stay and therefore how much they are worth as cheap, stable funding. A slower assumed decay makes deposits look longer-lived and more valuable, which raises EVE (or NEV at a credit union) and the headroom against every limit. When depositors move faster than the assumption, the model overstates value until someone back-tests the rate. Botminds' Interest Rate Risk (IRRBB) Management back-tests every decay assumption each quarter and re-runs NEV and NII with what depositors actually did.
The worked numbers below come from a fictional sample credit union in the solution, Norrell Federal Credit Union, and its regular share accounts. Peer figures come from the OCC's fall 2026 interest rate risk statistics; research is linked where it is used.
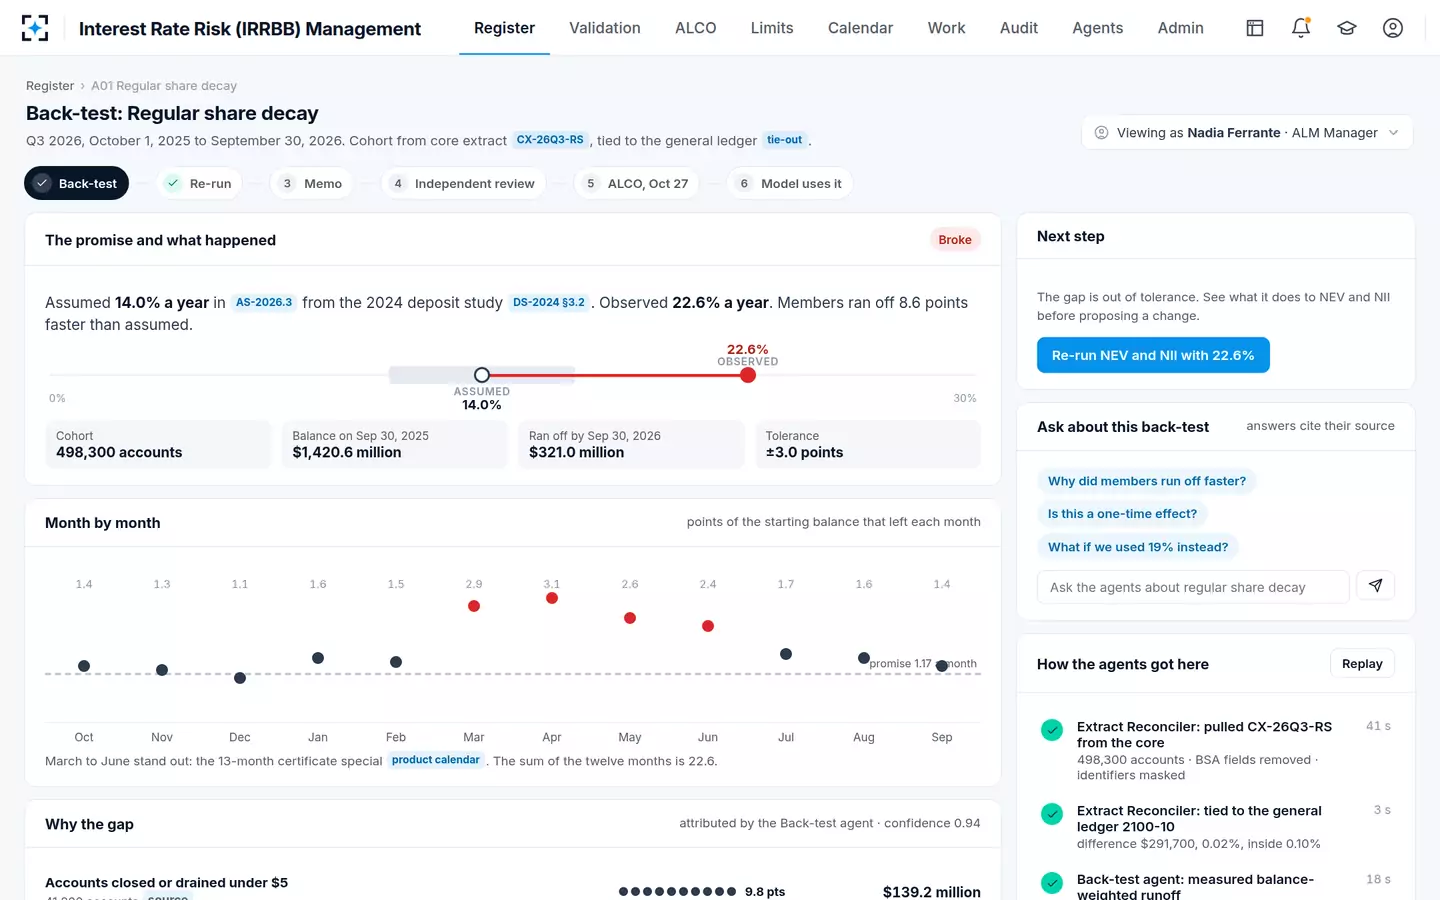
One decay assumption, one year of what members did
14.0%
regular share decay the sample model assumed, from a 2024 deposit study built on 2019 to 2023 data
22.6%
what members actually did in the year to September 30, 2026: $321.0 million of $1,420.6 million
0.9pts
of NEV ratio at +300 bp the old assumption overstated: 9.1% reported, 8.2% with the observed rate
5.00yrs
median average life OCC-supervised banks assume for savings deposits, fall 2026
What is a deposit decay rate?
A deposit decay rate is the runoff assumption for deposits without a maturity date: the percentage of today's balance expected to be gone after a given period, usually a year. The OCC defines it in one line: "Decay rates represent the level of deposit runoff over a given time period" (OCC Comptroller's Handbook, Interest Rate Risk). The FDIC explains why the model needs it: non-maturity deposits "lack contractual maturity dates", so an EVE model "must use management's assumptions regarding the maturity of the accounts. The most common of these assumptions is the decay rate assumption" (FDIC RMS Manual 7.1).
The OCC also says how much rides on it: non-maturity deposit assumptions "are one of the most vital assumptions in an IRR model because NMDs usually represent a large portion of the bank's funding base and depositors' behavior can vary considerably." Decay and its companion, the deposit beta, can decide which way the whole model leans. The FDIC warns that models treating deposit rates as insensitive can show a bank "as asset sensitive or neutral, when past performance shows it to be liability sensitive" (FDIC RMS Manual 7.1, variance analysis).
NCUA's guidance for credit unions shows the mechanism. A credit union may carry non-maturity shares at book value, or attribute a premium to them because they are low-cost and rate-insensitive; the second approach "generally results in nonmaturity shares priced/valued in a way that will produce an increased net economic value. Therefore, the underlying assumptions of the shares require scrutiny" (12 CFR Part 741, Appendix A). The decay rate is the main assumption behind that premium.
How do you calculate a deposit decay rate?
To calculate a deposit decay rate, take the accounts open at the start of a period, measure their balance then, measure what the same accounts hold at the end, and divide the difference by the starting balance. New accounts opened during the period are left out, because the question is how fast existing money leaves, not whether the bank attracted new money. The calculation below is the sample credit union's regular share decay for the year to September 30, 2026.
Deposit decay rate calculation on one cohort, step by step
| Step | Calculation | Result |
|---|---|---|
| 1. Fix the cohort | Regular share accounts open on September 30, 2025 with $5 or more | 498,300 accounts |
| 2. Starting balance, tied to the general ledger | Sum of the cohort's balances; general ledger difference $291,700 | $1,420.6 million |
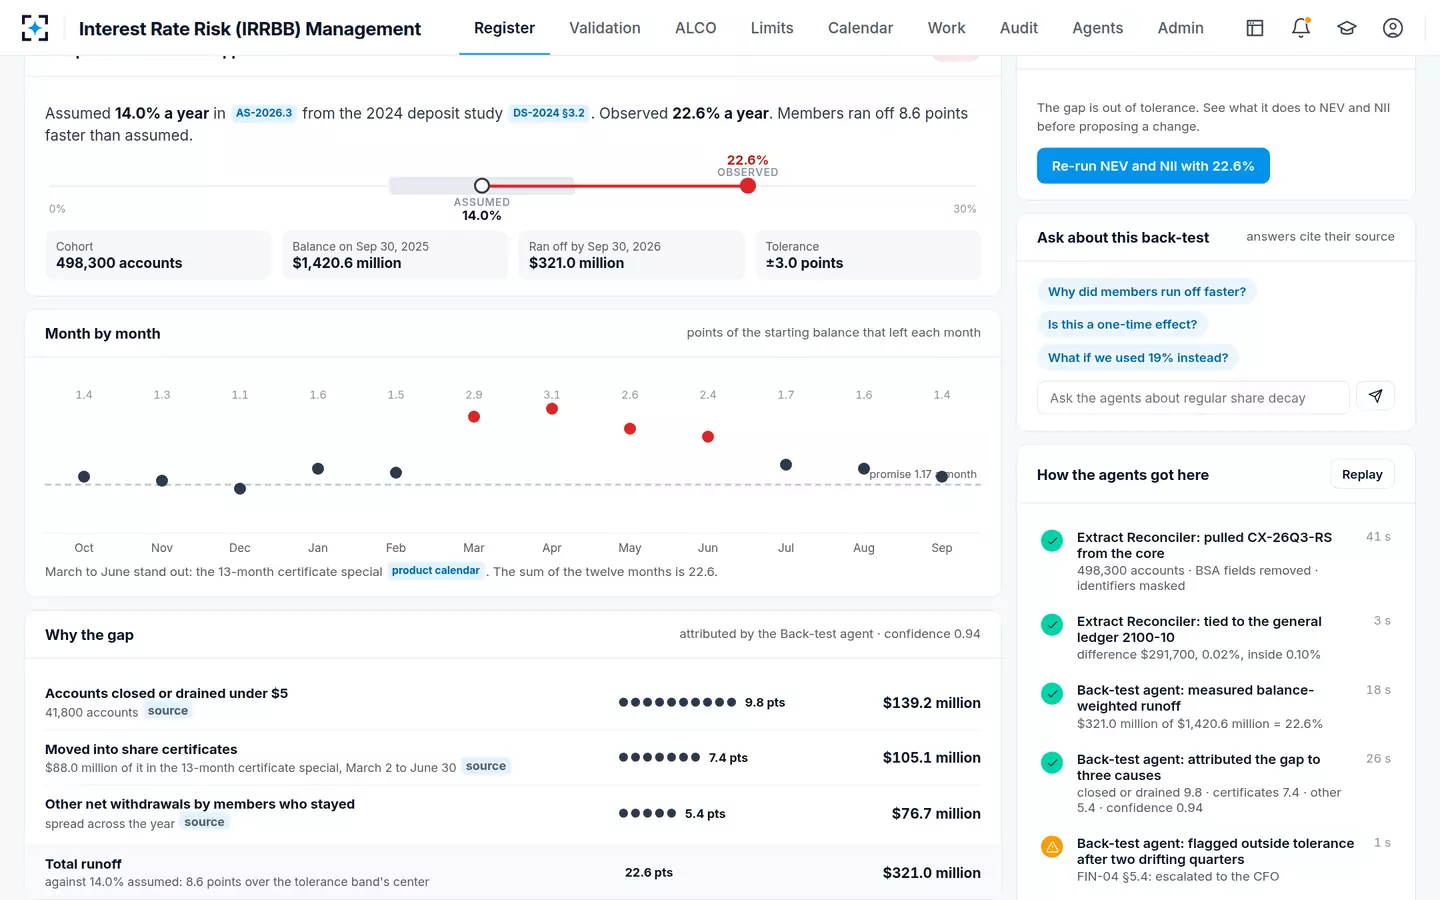
| 3. Accounts closed or drained under $5 | 33,950 closed ($121.8 million) + 7,850 drained ($17.4 million) | $139.2 million |
| 4. Money moved into share certificates | Transfers from the cohort to certificates; $88.0 million in a 13-month special | $105.1 million |
| 5. Other net withdrawals by members who stayed | Net balance decline in surviving accounts | $76.7 million |
| 6. Total runoff | $139.2 + $105.1 + $76.7 million | $321.0 million |
| 7. Balance-weighted decay rate | $321.0 ÷ $1,420.6 million | 22.6% |
| 8. For comparison: by accounts | 41,800 closed or drained ÷ 498,300 | 8.4% |
Step 8 is the trap. Counted by accounts, the same year shows 8.4% decay; counted by dollars, 22.6%. The two answer different questions, and the OCC asks for both: management "should consider changes in dollar volumes as well as changes in the number of accounts when determining decay rates." What matters is that the back-test uses the same basis as the assumption it tests. A balance-weighted assumption checked against an account count will look comfortably conservative when it is badly broken.
Two more choices change the answer. The period: twelve monthly runoffs of 1.4, 1.3, 1.1, 1.6, 1.5, 2.9, 3.1, 2.6, 2.4, 1.7, 1.6 and 1.4 points sum to the sample's 22.6, but any three-month window gives a different annualised rate. And the drivers: the four high months were those of a certificate special, so a back-test that reports only the total hides whether the cause will recur. In the sample, runoff without those months would still have been 17.4%, 3.4 points over the assumption.
The back-test of a deposit decay rate: the promise, the cohort and the months
Decay rate and average life: the same promise in years
Many models and peer reports state the deposit assumption as an average life rather than a decay rate. They are two views of one promise. If a fixed share of the remaining balance runs off each year, the weighted-average life of the balance is roughly the reciprocal of the decay rate: 20% decay is about a five-year life; 14.0% is about 7.1 years; 22.6% is about 4.4 years. Truncation, where the model cuts off the tail of the cash flows, shortens the life further.
That arithmetic makes the sample's error concrete. The 2024 study told the model that a dollar of regular shares stays about seven years; members behaved as if it stays about four and a half. For valuation, two and a half fewer years of cheap funding is a large difference, and it moves in the direction that matters most for a credit union funding long mortgages: the liability side gets shorter while the asset side does not.
What decay rates do other banks use?
The only public benchmark is the OCC's semiannual Interest Rate Risk Statistics Report, which in fall 2026 drew on 791 OCC-supervised banks. It reports average lives rather than decay rates. The medians were 3.83 years for money market deposit accounts, 4.87 years for NOW and interest checking, and 5.00 years for both savings and non-interest-bearing deposits (OCC, Interest Rate Risk Statistics Report, Fall 2026, Table 1d).
Median average lives OCC banks assume, with the decay rate they imply
The spread around those medians is wide, and it widens with size. Money market average lives run from 2.58 years at the 25th percentile to 5.00 years at the 75th across all banks; the median is 2.81 years for banks under $100 million and 4.53 years for banks over $10 billion. A peer median is a reasonableness check, not an answer. The 2012 interagency FAQ says institutions "should use assumptions that reflect the institution's profile and activities and generally avoid reliance on industry estimates or default vendor assumptions" (Interagency IRR FAQ, 2012). How to read the rest of the OCC dataset is covered in the OCC interest rate risk statistics report.
The Basel Committee's standardised framework gives a different kind of benchmark: caps rather than averages. For internationally active banks using it, no more than 90% of retail transactional deposits may be treated as core, with an average maturity of at most five years; for retail non-transactional deposits the caps are 70% and 4.5 years; for wholesale deposits, 50% and four years (BCBS, Interest rate risk in the banking book, 2016, Table 2). A community bank is not bound by those caps, but an assumption well beyond them needs unusually strong support.
What happens if the decay assumption is wrong?
If the assumed decay rate is slower than reality, the model overvalues the deposit base, overstates EVE or NEV, and understates how far value falls when rates rise; every limit on economic value then shows more headroom than the balance sheet has. If it is faster than reality, the error runs the other way and the institution may hedge or shed risk it does not have. The first error is the dangerous one, because it makes a breach disappear on paper.
The sample credit union's re-run puts a number on it. With the old 14.0% assumption, the NEV ratio at +300 bp was 9.1%. Re-run with the observed 22.6%, it was 8.2%. A second open change, the certificate dividend beta moving from 55% to 71%, takes it to 7.6%. The policy floor is 7.0%, and NCUA's NEV Supervisory Test moves from Low to Moderate below 7%.
Interest Rate Risk (IRRBB) Management: what the stale decay rate was hiding at +300 bp
| Run | NEV ratio at +300 bp | Headroom to the 7.0% floor | NEV sensitivity (limit 40%) | NII year one (limit −15%) |
|---|---|---|---|---|
| Live set, decay 14.0% as assumed | 9.1% | 2.1 points | 27.8% | −6.4% |
| Decay at the observed 22.6% | 8.2% | 1.2 points | 33.3% | −8.1% |
| Plus certificate dividend beta at 71% | 7.6% | 0.6 points, under the 1.0-point warning line | 37.7% | −10.2% |
| NCUA NEV Supervisory Test lines | Low above 7%; High below 4% | Low below 40%; High above 65% |
The NII column is the reason a stale decay rate survives so long. Year-one NII moves from −6.4% to −8.1%, comfortably inside its limit; a team that watches mostly earnings sees nothing alarming. The damage is on the value side, which is why EVE and NII need separate limits.
The cost in limits: headroom that was never there
The clearest way to price a stale decay rate is in headroom. On the live run the sample credit union reported 2.1 points between its +300 bp NEV ratio and its floor. With what members actually did, the headroom was 1.2 points: 43% of the reported cushion was the assumption, not the balance sheet. With both open changes, 0.6 points remained, and 71% of the reported cushion was gone. NEV sensitivity headroom fell from 12.2 points to 6.7, then to 2.3.
That is the cost that matters to a board. Decisions taken on reported headroom, such as adding fixed-rate mortgages, extending the investment portfolio or removing a hedge, are taken against a cushion that is partly fictional. The Federal Reserve's review of Silicon Valley Bank describes the extreme case: in April 2022 the bank lengthened its deposit duration assumption in response to limit breaches, which "gave the appearance of reduced IRR; however, no risk had been taken off the balance sheet." The review's judgement on the assumptions was blunt: they "were unsubstantiated given recent deposit growth, lack of historical data, rapid increases in rates that shorten deposit duration, and the uniqueness of SVBFG's client base" (Federal Reserve, SVB review, April 2023).
The sample's decay assumption against what members did
Assumed, 2024 deposit study: 14.0% a year, balance-weighted
Observed, year to September 30, 2026: 22.6% a year, balance-weighted
Assumed, 2024 deposit study: About 7.1 years
Observed, year to September 30, 2026: About 4.4 years
Assumed, 2024 deposit study: Account history from 2019 to 2023
Observed, year to September 30, 2026: October 2025 to September 2026, with certificate rates well above the regular share dividend
Assumed, 2024 deposit study: A flat 1.17 points a month
Observed, year to September 30, 2026: 1.1 to 1.7 most months; 2.4 to 3.1 during a certificate special
Assumed, 2024 deposit study: 9.1%, 2.1 points above the floor
Observed, year to September 30, 2026: 8.2%, 1.2 points above the floor
How is a decay rate different from a deposit beta?
A decay rate says how much of the balance leaves; a deposit beta says how much of a market rate change the institution passes on to the depositors who stay. Both describe the deposit franchise, and both raise economic value when they are low: slow decay means the cheap funding lasts, and a low beta means it stays cheap. The OCC lists them together as the key non-maturity deposit assumptions, "deposit price sensitivity assumptions (e.g., betas) and runoff assumptions (e.g., decay rates)."
They also interact. An institution that raises its deposit rate to keep balances accepts a higher beta to get a lower decay rate; one that holds its rate accepts faster decay. The sample shows both breaking in the same year: regular share decay at 22.6% against 14.0%, and certificate dividend beta at 71% against 55%. Back-testing them separately, but re-running them together, is the only way to see the combined effect. How to calculate a beta is worked in the guide to back-testing every assumption.
How often should decay rates be updated?
Decay assumptions should be reviewed at least once a year and more often when rates or competition move fast. The OCC says management "should evaluate key assumptions for reasonableness at least annually and more frequently during rapidly changing market conditions or when other material changes occur." The FDIC asks that the process for developing material assumptions be assessed "at least annually for critical assumptions", and warns that "NMD decay rate are often imprecise, yet significant factors in IRR analysis."
Reviewing is not the same as changing. A quarterly back-test that shows the rate within tolerance supports a documented re-affirmation; one that shows it outside tolerance starts the change route, through an independent check and ALCO, before the model uses a new value. The 2010 advisory adds a specific warning for deposits: "rate-sensitive and higher-cost deposits, such as brokered and Internet deposits, would reflect higher decay rates than other types of deposits" (Interagency Advisory, 2010). A deposit mix that shifts toward such money should move the assumption, whatever the calendar says.
Why the gap: each cause with its amount and its source
Why decay assumptions break now
Decay assumptions built in years of low rates tend to understate runoff when rates rise, and research on deposits explains why. Drechsler, Savov and Schnabl show that when the Fed funds rate rises, "banks widen the spreads they charge on deposits, and deposits flow out of the banking system" (NBER working paper 22152; Quarterly Journal of Economics, 2017). In later work they argue that the deposit franchise itself is what hedges banks' interest rate risk, because deposit rates are low and insensitive to market rates (NBER working paper 24582; Journal of Finance, 2021). Both results depend on depositors staying put.
Newer evidence suggests they stay put less than they did. In a 2024 NBER working paper not yet peer reviewed, Koont, Santos and Zingales find that "when interest rates rise, deposit outflows, or 'walks', and deposit rate pass-through are significantly larger at banks with mobile apps and brokerage services" (NBER working paper 32601). The 2012 FAQ anticipated the stress version: "customers' flight to quality (insured deposits) during times of stress might influence NMD decay rates." An assumption fitted to past years describes past depositors, in a market with different rates and different ways to move money; it holds only for as long as a back-test says it does.
Before you trust a deposit decay rate
- Measure it on a fixed cohort
Accounts open at the start, new money excluded, balances tied to the general ledger.
- Use the same basis as the model
Balance-weighted if the model is; report the account count beside it, not instead of it.
- Split the runoff into causes
Closures, moves into certificates, and drawdowns by members who stay recur for different reasons.
- Look at the months, not just the year
A promotion or a stress month can explain most of a gap, or hide one.
- Compare with peers, then ignore the comparison
The OCC medians and the Basel caps test reasonableness; your own data sets the rate.
- Re-run NEV and NII with the observed rate
Alone and with every other open change, against every limit.
- Change it only through review and approval
A new rate reaches the model after an independent check and ALCO, not before.
Questions people ask
What is a typical decay rate for savings deposits?
The OCC reports average lives rather than decay rates. In its fall 2026 statistics, the median savings average life across 791 banks was 5.00 years, which implies roughly 20% runoff a year; the middle half of banks assumed between 4.00 and 7.01 years. Your own data should set the rate; peer figures test whether it is reasonable.
How does the decay rate affect EVE?
A slower decay rate means deposits are modelled as longer-lived, low-cost funding, which raises their value to the institution and therefore raises EVE or NEV. In the sample, moving regular share decay from 14.0% to the observed 22.6% lowered the NEV ratio at +300 bp from 9.1% to 8.2%.
What are non-maturity deposit decay rates?
They are runoff assumptions for deposits with no fixed term: checking, savings, money market and, at credit unions, regular shares and share drafts. Each type usually gets its own rate because behaviour differs; the OCC's median average life is 3.83 years for money market accounts and 5.00 years for savings.
Should decay be measured by accounts or balances?
Use the basis your model uses, which is usually balances, and look at both. In the sample the same year shows 8.4% decay by accounts and 22.6% by balances, because many closed accounts were small and much of the money left from accounts that stayed open. The OCC asks management to consider both dollar volumes and account numbers.
What is a deposit decay rate study?
It is a historical analysis of how deposit balances and accounts ran off, usually part of a broader core deposit study that also estimates betas and average lives. It sets the assumption; a quarterly back-test then checks whether depositors still behave that way. When a new study is worth commissioning is the subject of the core deposit study guide.