The OCC's Interest Rate Risk Statistics Report is a semiannual publication of the interest rate risk data examiners collect from OCC-supervised midsize and community banks: the projected change in 12-month net interest income and in economic value of equity under parallel shocks from −400 to +400 basis points, the policy limits boards have set for those measures, and the repricing rates and average lives banks assume for non-maturity deposits. The fall 2026 edition covers 791 banks. Read correctly, as a description of what peers do rather than a standard, it is the closest thing to a public benchmark for the numbers an examiner will compare yours with. Botminds' Interest Rate Risk (IRRBB) Management reads each run of your own model against your board's limits; this report tells you where those limits and assumptions sit among peers.
All figures below are from the fall 2026 report unless a sentence says otherwise. Where the page uses the solution's fictional sample credit union, Norrell Federal Credit Union, it says so.
The fall 2026 report in four numbers
791
OCC-supervised midsize and community banks in the data
−8%
median change in economic value of equity under a +300 bp parallel shock
−30%
median board limit for the change in EVE at +300 bp
36%
median share of a +100 bp market move banks assume reaches money market deposit rates
What is the OCC interest rate risk statistics report?
It is a compilation of bank-reported interest rate risk data gathered during OCC examinations, broken into statistics by bank population and published twice a year. The OCC describes its purpose as establishing "the range of exposures and risk limits across midsize and community banks", based on "a review of bank-reported IRR data, including exposures, risk limits, and non-maturity deposit (NMD) assumptions" (OCC, Interest Rate Risk Statistics Report, Fall 2026).
The fall 2026 edition was transmitted by OCC Bulletin 2026-53 on October 23, 2026, which rescinded the bulletin carrying the spring 2026 report and noted that the publication now adds −300 and −400 basis point scenarios for both earnings and economic value, with their limits (OCC Bulletin 2026-53). The report gives each statistic for all banks, for six asset-size groups from under $100 million to over $10 billion, and for three charter types: national banks, stock federal savings associations and mutual federal savings associations.
The statistics are for informational purposes only and do not represent OCC-suggested limits or exposures.
OCC, Interest Rate Risk Statistics Report, Fall 2026, 'About This Report'
That sentence is the rule for reading everything that follows. A bank whose EVE limit is looser than the median has not broken anything; it has a limit its board should be able to explain. A bank whose deposit beta is lower than the 25th percentile has not made an error; it has an assumption that will draw a question. The report shows where the questions will come from.
How many banks are in the OCC IRR statistics, and how old is the data?
The fall 2026 report is based on 791 banks, with data as of dates from September 30, 2024 to June 30, 2026. The OCC explains why the range is so wide: examiners collect the data "at least once each supervisory cycle", cycles run 12 to 18 months, and "the most recent data available for some banks may be up to 24 months old." Seventy-seven percent of observations are dated between June 30, 2025 and June 30, 2026.
Three more details shape what the numbers mean. The population is OCC-supervised national banks and federal savings associations "that generally have less than $50 billion in total assets"; large banks' data are collected but left out because they are hard to aggregate anonymously. For each statistic, "the highest and lowest 1 percent of values for that group were removed" before the quartiles were computed, so the "largest loss" column is the worst bank after that trim. And credit unions are not in it: NCUA supervises them and uses its own NEV Supervisory Test, covered in how far a +300 bp result is from NCUA's High line.
What is the median EVE change at +300 bp?
The median bank's economic value of equity falls 8% under an instantaneous +300 basis point parallel shock, and a quarter of banks show a fall of 18% or more. At the other end, the 75th percentile shows a 1% gain, and the largest trimmed loss is 70%. Earnings move the other way for most banks: the median 12-month NII change at +300 bp is a 2% gain, with a quarter of banks losing 5% or more.
At +300 bp, most banks lose economic value; the median limit sits far below the median loss
Earnings and economic value at each shock: the middle half of 791 banks
| Shock | 12-month NII: 25th / median / 75th | EVE: 25th / median / 75th | Median limits: NII / EVE |
|---|---|---|---|
| −300 bp | −11% / −5% / +1% | −14% / −4% / +7% | −20% / −30% |
| −100 bp | −3% / −1% / +1% | −3% / 0% / +4% | −10% / −10% |
| +100 bp | −1% / +1% / +3% | −6% / −2% / +1% | −10% / −10% |
| +200 bp | −3% / +1% / +6% | −12% / −4% / +1% | −15% / −20% |
| +300 bp | −5% / +2% / +8% | −18% / −8% / +1% | −20% / −30% |
| +400 bp | −8% / +2% / +11% | −24% / −11% / +1% | −25% / −40% |
The pattern in the table is the typical shape of a community bank balance sheet: modestly asset-sensitive in earnings over twelve months, and exposed in value to rising rates because long fixed-rate assets lose more value than deposits gain. That is why the two measures need separate limits, which EVE vs NII works through with the OCC's own example.
What are typical interest rate risk policy limits?
For the median bank in the fall 2026 report, the board allows a 20% fall in 12-month NII and a 30% fall in EVE at ±300 bp, and a 25% fall in NII and 40% in EVE at +400 bp. Limits scale with the shock in round numbers: 10% for both measures at ±100 bp, 15% and 20% at ±200 bp. The 75th percentile, the tighter quarter of banks, sets −15% for NII and −25% for EVE at +300 bp.
The OCC's handbook says what makes a limit work: it should be reasonable, meaning a level the bank could plausibly reach but does not exceed as a matter of routine, and high or often-breached limits need strong support (OCC Comptroller's Handbook, Interest Rate Risk). Its own illustration compares three banks over six years. Bank A's earnings exposure ran between 1.8% and 2.9% against a 15% limit; the OCC calls its limits "too lax", and says management should be able to show "why the limits are consistent with the board's risk appetite given that actual IRR exposure is consistently significantly less than set limits."
Limits far from exposure: what the gap says
Set side by side, the medians show a wide gap between what banks measure and what their boards allow. At +300 bp, the median EVE change of −8% uses about a quarter of the median −30% limit; the 25th percentile change of −18% uses about 60% of it. For NII the gap is wider still: the median bank gains at +300 bp, against a median limit of −20%. Because the OCC computes each column separately, these are comparisons of distributions, not of individual banks, but the direction is clear.
A limit that a bank comes nowhere near does not constrain decisions, and the 2010 advisory warns against exactly that: a well-managed institution sets limits high enough that crossing one is not routine, and low enough that they can be crossed at all (ALCO limits against 791 banks quotes the sentence). The useful test for your own policy is the OCC's bank A question: over the last several years, how close did each measure come to its limit, and could the board explain the distance?
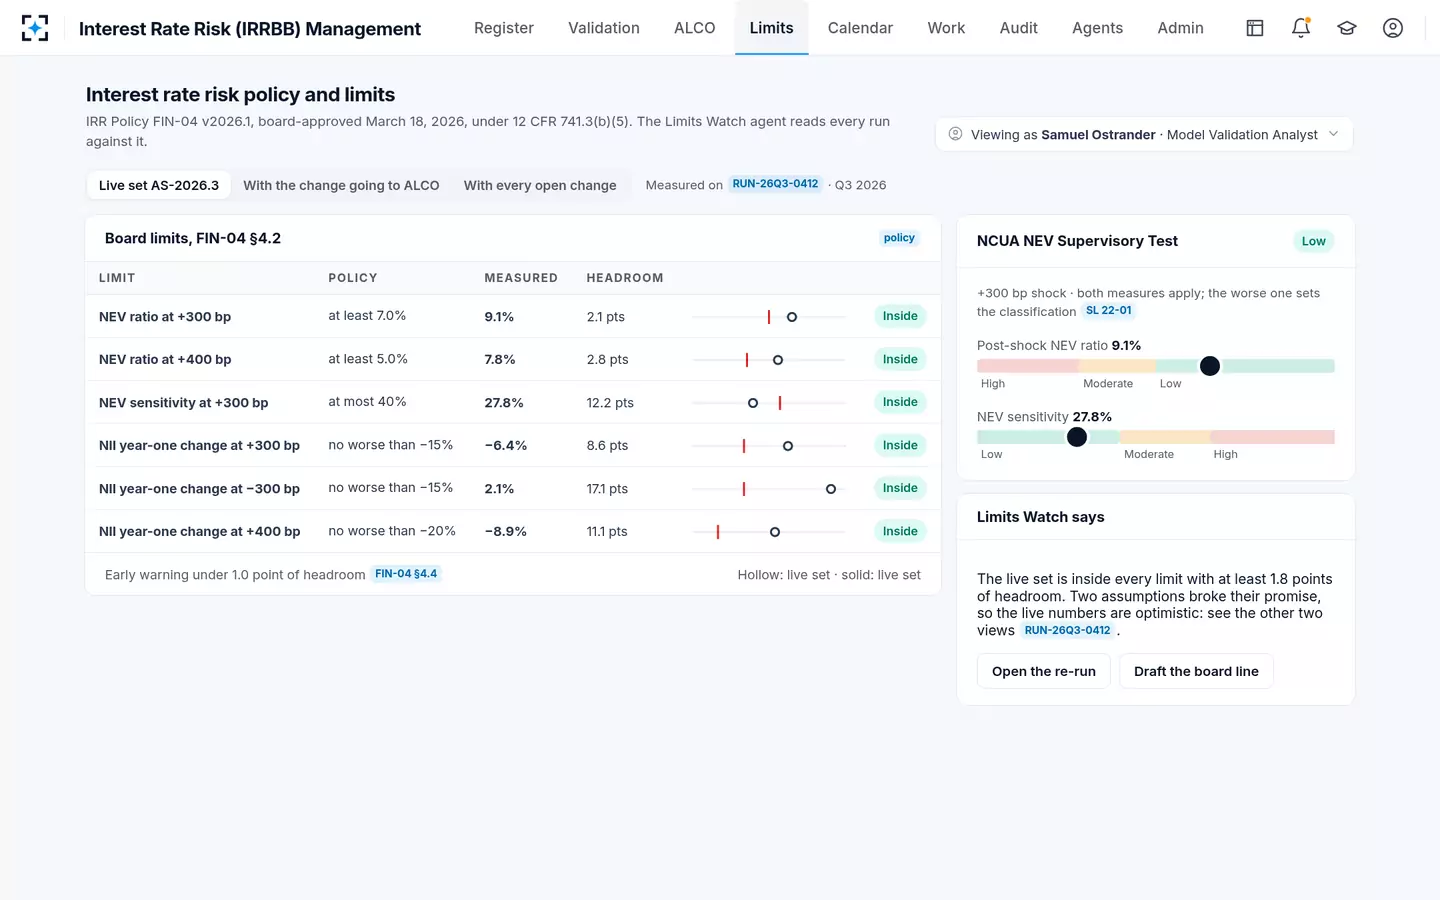
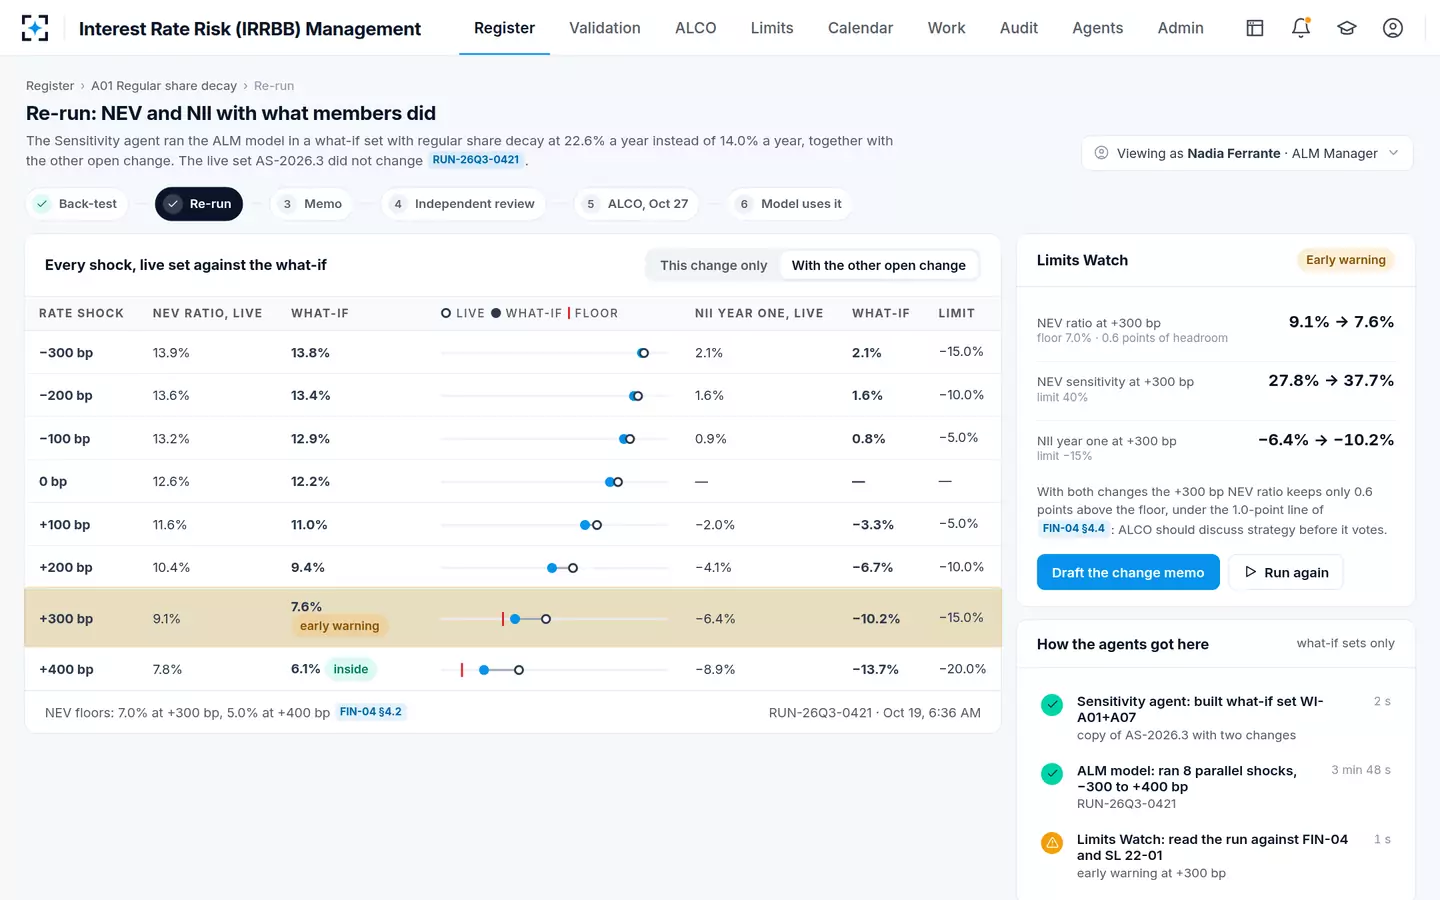
There is a second reason a limit can look comfortable: the assumptions behind the measure. In the solution's fictional sample credit union, the live run showed 2.1 points of headroom on its NEV ratio floor at +300 bp; re-run with the deposit decay members actually showed, the headroom was 1.2 points. A limit is only as distant as the assumptions say it is, which is why a stale deposit decay rate is a limits problem as much as a modelling one.
Interest Rate Risk (IRRBB) Management: each board limit against the latest run
What deposit betas do banks assume?
For a +100 bp rise in market rates, the median OCC-supervised bank assumes 36% reaches money market deposit rates, 20% reaches NOW and interest checking, and 15% reaches savings. Those repricing rates are deposit betas: the OCC's glossary describes them as estimates of how a deposit's rate changes relative to the change in market rates. The spread is wide: for money market accounts the middle half of banks assume between 25% and 54%.
Size matters more than any other cut in the data. The median money market beta for a +100 bp move is 35% for banks under $500 million, 42% for $500 million to $1 billion, 50% for $1 billion to $10 billion and 63% for banks over $10 billion. Larger banks assume their depositors are more rate-sensitive. Research at the Federal Reserve Bank of New York found a related pattern in the last tightening cycle: deposit betas at "super-regional" holding companies of $50 billion to $250 billion ran consistently higher than at smaller banks, while the very largest banks' betas rose more slowly (Liberty Street Economics, March 2024).
Bigger banks assume more of a rate rise reaches money market depositors
What are typical non-maturity deposit average lives?
The median average life banks assume is 3.83 years for money market accounts, 4.87 years for NOW and interest checking, and 5.00 years for savings and non-interest-bearing deposits. In the OCC's glossary, average lives stand for the level of deposit runoff over time. An average life of five years corresponds roughly to a 20% annual decay rate; the conversion, and what an outdated rate costs, are worked through in the deposit decay rate guide.
Non-maturity deposit assumptions, all 791 banks
| Deposit type | Beta, −100 bp (median) | Beta, +100 bp (25th / median / 75th) | Average life, years (25th / median / 75th) |
|---|---|---|---|
| Money market deposit account | 35% | 25% / 36% / 54% | 2.58 / 3.83 / 5.00 |
| NOW and interest checking | 18% | 14% / 20% / 31% | 3.54 / 4.87 / 7.10 |
| Savings | 15% | 10% / 15% / 25% | 4.00 / 5.00 / 7.01 |
| Non-interest-bearing | Not applicable | Not applicable | 3.97 / 5.00 / 6.80 |
Size and charter change the picture
Medians for all banks hide differences that matter for peer comparison. By charter, mutual federal savings associations stand apart: their median EVE change at +300 bp is −22%, with a quarter at −37% or worse, against −6% for national banks. Their median NII change at +300 bp is −5%, where national banks gain 2%. That is the profile of institutions that hold long fixed-rate mortgages funded by deposits.
By size, the median EVE change at +300 bp is fairly stable, between −4% and −10% across the six groups, but the tails differ: the largest trimmed EVE loss at +300 bp is 136% for banks under $100 million and 25% for banks over $10 billion. Small banks also assume shorter money market lives, 2.81 years at the median under $100 million against 4.53 years over $10 billion. A bank that compares itself with "all banks" rather than its own size group or charter will misread where it sits.
Can I compare my bank to the OCC statistics?
Yes, with care. Use the size group or charter table closest to your institution, compare each measure separately, and treat a position outside the middle half as a question to answer rather than a finding. Remember that your model's assumptions drive your position: two banks with the same balance sheet can sit at different percentiles because one assumes a 15% savings beta and the other 25%.
Setting your numbers beside the report
What the report gives: Median −8%; middle half −18% to +1%
What to check in your own numbers: Your position in your size group, and how it moved since the last edition
What the report gives: Median +2%; middle half −5% to +8%
What to check in your own numbers: Whether your earnings and value results point the same way, and why
What the report gives: Median −20% NII, −30% EVE
What to check in your own numbers: How close your exposure has come to each limit over several years
What the report gives: Median 36%; 50% for $1–10 billion banks
What to check in your own numbers: Your assumed beta against what you actually paid in the last rising cycle
What the report gives: Median 5.00 years; middle half 4.00 to 7.01
What to check in your own numbers: Your assumed life against a back-test of last year's runoff
The comparison that matters most is the one the report cannot make for you: your assumptions against your own depositors. The 2012 interagency FAQ tells institutions to build assumptions from their own profile and to treat industry figures only as an interim starting point (Interagency IRR FAQ, 2012). The OCC's medians are such a starting point. In Interest Rate Risk (IRRBB) Management, each assumption is back-tested against what customers did, so the comparison with peers comes after the comparison with the evidence.
Two open changes together, read against the limits before ALCO votes
Questions people ask
How often does the OCC publish IRR statistics?
Twice a year. The fall 2026 report was transmitted by OCC Bulletin 2026-53 on October 23, 2026, replacing the spring 2026 edition. Each edition uses the most recent examination data for each bank, so some observations are up to 24 months old.
Are the OCC's median limits a regulatory standard?
No. The report says its statistics are for informational purposes only and do not represent OCC-suggested limits or exposures. Limits should reflect the board's risk appetite and the bank's earnings and capital, and the OCC expects management to be able to support them.
Does the OCC report include credit unions or large banks?
No. It covers OCC-supervised national banks and federal savings associations that generally have less than $50 billion in assets. Large banks' data are collected but excluded because they are hard to aggregate anonymously, and credit unions are supervised by NCUA.
Why do banks show NII rising and EVE falling at +300 bp?
Many community banks reprice assets faster than deposits over the first year, so short-term earnings benefit from higher rates, while long fixed-rate loans and securities lose more present value than the deposits funding them. In the fall 2026 data, the median bank gains 2% in NII and loses 8% in EVE at +300 bp.
What is a repricing rate in the OCC report?
It is the report's term for a deposit beta: the estimated change in a deposit's rate as a share of the change in market rates. A money market repricing rate of 36% for a +100 bp shock means the bank assumes its money market rate rises 0.36 percentage points.