EVE vs NII is the difference between two ways of measuring interest rate risk. Net interest income (NII) sensitivity asks how much the next twelve months' interest income less interest expense would change if rates moved; economic value of equity (EVE) asks how much the present value of all the bank's assets minus all its liabilities would change. NII sees the near-term earnings effect of repricing; EVE sees every future cash flow, including the long fixed-rate loans and the deposits whose value depends on how long they stay. In the same rate shock the two can move in opposite directions, which is why regulators expect limits on both. Credit unions call the value measure net economic value (NEV). Botminds' Interest Rate Risk (IRRBB) Management re-runs both at every shock and reads each against its own board limit.
Peer figures on this page come from the OCC's fall 2026 Interest Rate Risk Statistics Report. The product example uses a fictional sample credit union in the solution.
EVE and NII answer different questions about the same balance sheet
NII sensitivity (earnings at risk): How would next year's net interest income change?
EVE sensitivity (economic value): How would the present value of assets minus liabilities change?
NII sensitivity (earnings at risk): Usually 12 months; regulators encourage two years or more
EVE sensitivity (economic value): All future cash flows, discounted to today
NII sensitivity (earnings at risk): What reprices in the next year, and how fast deposit rates follow
EVE sensitivity (economic value): Long fixed-rate assets, embedded options and how long deposits are assumed to stay
NII sensitivity (earnings at risk): Often static, sometimes with planned growth
EVE sensitivity (economic value): Usually the current balance sheet only, no new business
NII sensitivity (earnings at risk): A 20% fall in 12-month NII
EVE sensitivity (economic value): A 30% fall in EVE
NII sensitivity (earnings at risk): Basel disclosure of the change in NII
EVE sensitivity (economic value): Basel outlier test: change in EVE against 15% of Tier 1; NCUA NEV Supervisory Test
NII sensitivity (earnings at risk): Risk that lands after the horizon
EVE sensitivity (economic value): The timing of earnings, and new business
What is the difference between EVE and NII?
The difference is horizon and scope. NII sensitivity is an earnings measure over a short horizon, usually twelve months; EVE is a value measure over the whole life of the balance sheet. The OCC's glossary puts it in two lines: earnings-at-risk models "measure short-term IRR and typically focus on the risk to earnings over the next one or two years", while EVE models "focus on a long-term time horizon by capturing future cash flows expected from existing assets, liabilities, and off-balance-sheet items" (OCC, Interest Rate Risk Statistics Report, Fall 2026, glossary).
The regulators treat the two as complements, not alternatives. The 2010 advisory says "well-managed institutions will consider earnings and economic perspectives when assessing the scope of their IRR exposure", and adds that a fall in economic value "can signal future earnings and capital problems" (Interagency Advisory on Interest Rate Risk Management, 2010). The 2012 FAQ is direct: institutions "should use a combination of both earnings-focused and economic value of capital-focused measures to capture the full spectrum of IRR" (Interagency IRR FAQ, 2012).
What is EVE in banking?
EVE, economic value of equity, is the present value of a bank's assets minus the present value of its liabilities and off-balance-sheet positions, recalculated under each rate scenario. It is the balance sheet marked to the current rate environment rather than held at book value. The OCC notes that economic value models are "generally more effective in considering embedded options and identifying risk arising from long-term repricing or maturity gaps" than earnings models (OCC Comptroller's Handbook, Interest Rate Risk).
The names differ by regulator. The advisory's footnote explains: the FDIC, Federal Reserve and OCC "commonly refer to such methodologies as Economic Value of Equity (EVE) models. The NCUA uses the term Net Economic Value (NEV) in its regulations and guidance." Older OTS material used net portfolio value (NPV). Because values for many instruments are estimates, the OCC adds that many models report "the relative change or sensitivity of EVE or NPV rather than the absolute change in value (e.g., a 5 percent decline in EVE)."
How is economic value of equity calculated?
Economic value of equity is calculated by projecting the cash flows of every asset, liability and off-balance-sheet position, discounting them at current rates to get present values, and subtracting liabilities from assets; the shock result repeats the calculation with rates moved and cash flows re-projected. The OCC's handbook works a simple example in its Appendix A, and it shows in one table why the two measures disagree.
A bank holds a four-year, 8% fixed-rate note of $1.2 million, funded by a one-year, 6% certificate of deposit of $1 million, with $200,000 of equity. If rates stay put it earns $36,000 a year. If rates rise 200 basis points at once, nothing happens to year-one income, because the CD rate is locked for a year. From year two the CD reprices to 8% and income falls $20,000 a year. Economic value falls at once: the note's present value drops more than the CD's, and the equity's value falls by $57,600.
The OCC's worked example: a +200 bp shock seen through earnings and through value
| Measure | Rates unchanged | Rates +200 bp | Change |
|---|---|---|---|
| Net income, year 1 | $36,000 | $36,000 | None |
| Net income, years 2 to 4, each year | $36,000 | $16,000 | −$20,000 a year |
| Net income, four years in total | $144,000 | $84,000 | −$60,000 |
| Present value of the note | $1,200,000 | $1,123,900 | −$76,100 |
| Present value of the CD | $1,000,000 | $981,500 | −$18,500 |
| Economic value of equity | $200,000 | $142,400 | −$57,600, or −28.8% |
A twelve-month NII measure reports no risk at all in this example; EVE reports a loss of more than a quarter of the equity's value. The OCC's conclusion is the reason both measures exist: "if the bank evaluates its earnings exposure over only a short time horizon, it may incorrectly assume that it has little or no exposure", and the change in EVE "can be a leading indicator of the expected decline in future earnings and capital."
What is NII sensitivity?
NII sensitivity is the projected percentage change in net interest income over a set horizon, usually the next twelve months, under a rate scenario compared with a base case. It answers the earnings question directly, and it is the measure most closely tied to the budget: the OCC likens the calculation to a budget or forecasting model, run on projected rates and balances.
Its weakness is the horizon. The 2012 FAQ warns that options embedded in assets and liabilities can shift cash flows after the first year, and that "to capture this potential 'cliff effect,' exposures should be projected over at least a two-year period." The FDIC adds that longer simulations of five to seven years "can be a helpful supplement to EVE measures, but they are not a replacement for EVE measurements" (FDIC RMS Manual 7.1). A twelve-month NII limit alone is the policy the OCC example above would pass with no exposure.
Why can EVE fall while NII rises?
EVE can fall while NII rises when a bank's assets and liabilities reprice faster than its deposits over the next year but its longer-dated assets lose more present value than its liabilities gain. Floating-rate loans and short securities lift income quickly when rates rise, while deposit rates lag; at the same time, long fixed-rate mortgages and bonds lose value, and if deposits are assumed to run off sooner, they offset less of that loss.
That is the typical community bank profile in the OCC's data. In the fall 2026 report, the median bank's 12-month NII rises 2% at +300 bp and its EVE falls 8%. The disagreement grows with the shock: at +100 bp, NII +1% against EVE −2%; at +400 bp, NII +2% against EVE −11% (OCC, Interest Rate Risk Statistics Report, Fall 2026, Tables 1a and 1b).
In the same shock, the median bank's earnings rise while its value falls
The trade-off is structural, and the OCC spells it out: "When management focuses on preserving short-term earnings, economic value generally becomes more vulnerable, and vice versa." A bank that hedges its NII completely leaves its value exposed; one that immunises its value accepts earnings that swing with rates. The board's limits on the two measures are how it chooses where to sit between them. How your own limits compare with the OCC's medians is set out in the OCC interest rate risk statistics report.
Which is better, EVE or NII?
Neither; each is incomplete without the other, and every supervisor expects both. The OCC says it plainly: "Banks should have limits for both EAR and EVE/NPV." Its handbook's appendix opens with the principle that "the earnings and economic perspectives are complementary, and both are necessary to capture IRR comprehensively."
The cost of choosing one is documented. The Federal Reserve's review of Silicon Valley Bank found that "SVBFG management was focused on a short-term view of IRR through the NII metric and ignored potential longer-term negative impacts to earnings highlighted by the EVE metric." The board's risk appetite statement "only included the NII metric and not the EVE metric", and even that metric was run "only as a down 100 bps 12-month ramp instead of a range of plausible shocks" (Federal Reserve, SVB review, April 2023). The EVE limit breaches went to the board's risk committee, but the review found no evidence the full board knew they had been breached for years.
What is the Basel IRRBB outlier test?
The Basel outlier test compares the largest fall in a bank's EVE under six prescribed rate shock scenarios with 15% of its Tier 1 capital; a bank above that line is an "outlier" that supervisors must review. The six scenarios are a parallel shock up, a parallel shock down, a steepener, a flattener, a short-rate shock up and a short-rate shock down, sized by currency.
The supervisor should implement at least one outlier/materiality test that compares the bank's maximum ∆EVE, under the six prescribed interest rate shock scenarios set out in Annex 2, with 15% of its Tier 1 capital, computed in line with the disclosure requirements in Principle 8.
BCBS, Interest rate risk in the banking book, April 2016, Principle 12
In the United States the test reaches only the largest banks. The OCC's booklet asks examiners, for banks with $700 billion or more in total assets or $75 billion or more in cross-jurisdictional activity, to highlight any EVE reduction exceeding 15% of Tier 1 capital, "as these would be considered outlier banks." For a community bank the test is still a useful yardstick, because it measures EVE against capital rather than against EVE itself: a 10% fall in EVE means more when equity is thin.
What does NCUA use instead of EVE?
NCUA uses net economic value (NEV), the same idea under a different name: in Appendix A to Part 741 it measures the effect of rates on the market value of net worth, with NEV providing "a comprehensive measurement of IRR" because it captures all future cash flows (12 CFR Part 741, Appendix A). For supervision, NCUA reads NEV through its NEV Supervisory Test, which classifies a credit union by its post-shock NEV ratio and NEV sensitivity; Low means a ratio above 7% with sensitivity below 40%. The thresholds, and how to measure the distance to each, are in the NCUA NEV supervisory test guide.
NCUA's appendix also lists income simulation as a standard method, focused on "short-term time horizons (e.g. one to three years)", and gives illustrative limits for both: an NII change under 20% over twelve months, and a post-shock NEV change under 25% or a post-shock NEV of 6% or more. A credit union policy with limits on only one of the two has the same gap a bank's would.
Reading EVE and NII on one page
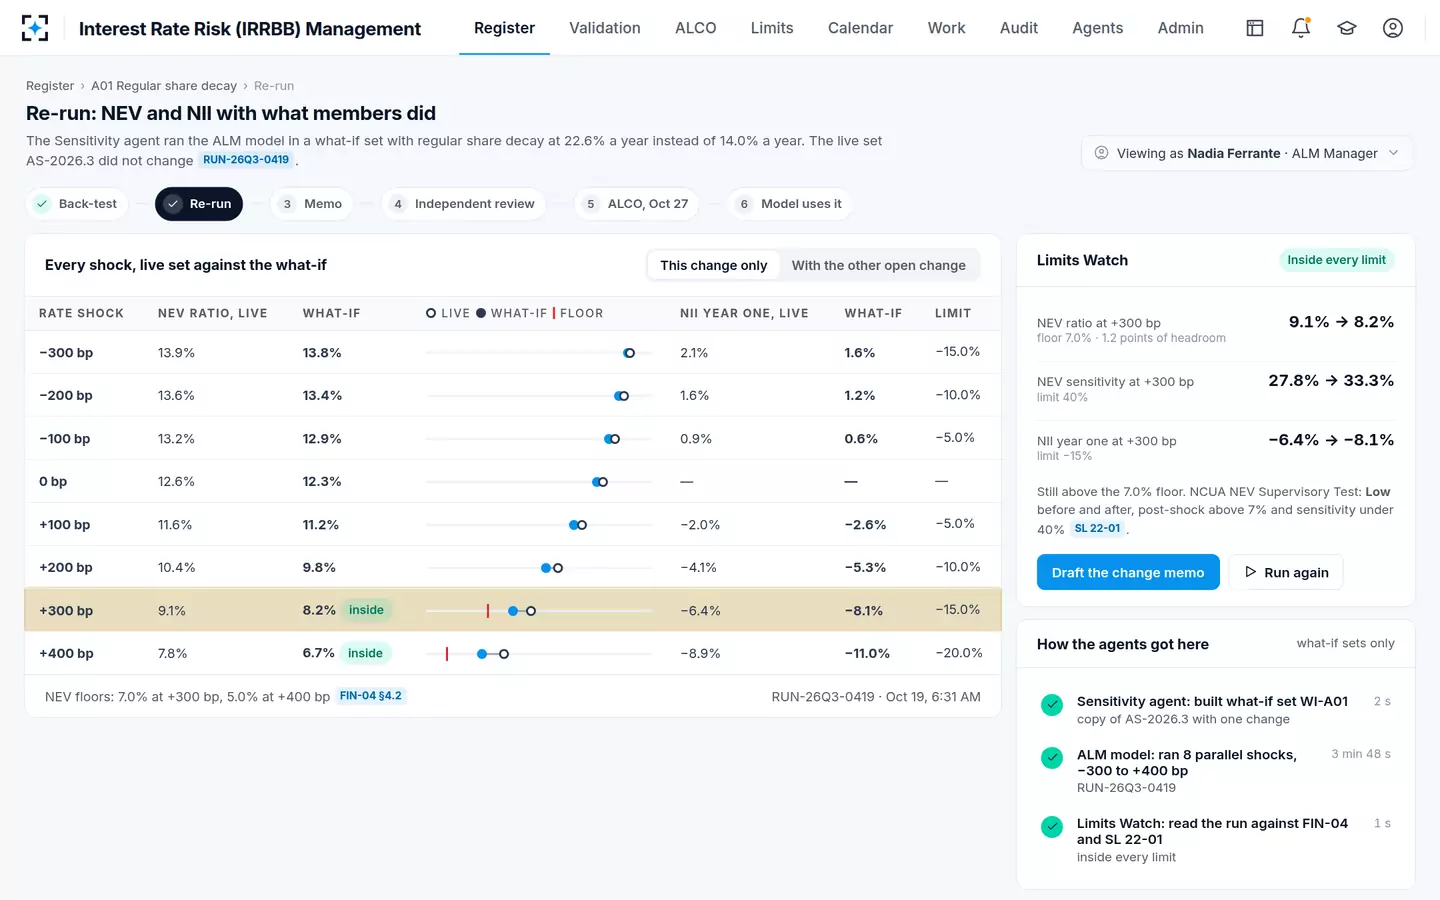
The practical discipline is to see both measures for every shock, against their own limits, on the same page, and to see how a changed assumption moves each. In Interest Rate Risk (IRRBB) Management the Sensitivity agent asks the ALM model to re-run every shock in a what-if set, and Limits Watch reads both results against the board's limits. In the fictional sample, raising regular share decay from the assumed 14.0% to the observed 22.6% lowers the NEV ratio at +300 bp from 9.1% to 8.2% and moves year-one NII from −6.4% to −8.1%; at −300 bp, NII stays positive.
Interest Rate Risk (IRRBB) Management: EVE-style and NII results at every shock, side by side
Before you sign off a quarter's EVE and NII results
- Both measures, every shock
Rising and falling, at least ±300 and ±400 bp, plus non-parallel scenarios if your profile needs them.
- Each against its own limit
With headroom stated, not just inside or outside.
- NII beyond twelve months
A second year, to catch the cliff effect the 2012 FAQ warns about.
- The assumptions behind each
Deposit decay and beta move EVE most; prepayment and repricing speed move NII.
- A re-run with any broken assumption
A back-tested value that differs from the model's changes both measures.
- The direction of disagreement explained
If NII rises while EVE falls, the memo to ALCO should say why.
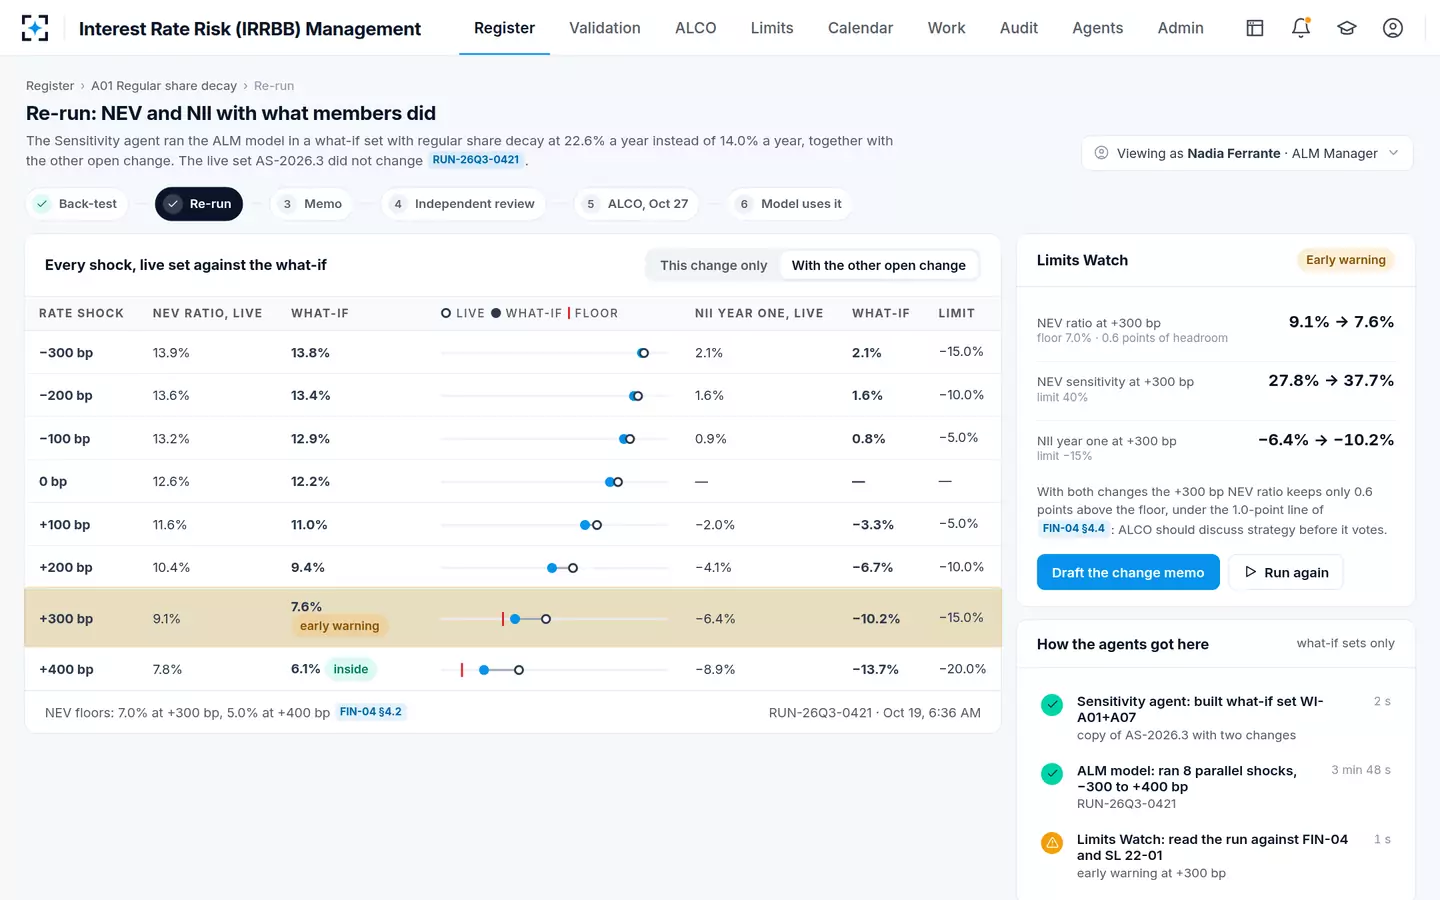
Two open changes together move both measures before ALCO votes
Questions people ask
What is EVE sensitivity?
EVE sensitivity is the percentage change in economic value of equity under a rate shock compared with the base case. In the OCC's fall 2026 statistics, the median bank's EVE sensitivity at +300 bp is −8% and the median board limit is −30%.
Is NII the same as net interest margin?
No. NII is the dollar amount of interest income minus interest expense; net interest margin is NII divided by average earning assets. NII sensitivity is usually expressed as the percentage change in projected NII under a shock, which moves in the same direction as the margin for a stable balance sheet.
Why do regulators want limits on both EVE and NII?
Because each misses risk the other sees. The OCC's own example shows a +200 bp shock with no effect on year-one income and a 28.8% fall in economic value. The OCC says banks should have limits for both, and the 2012 interagency FAQ asks for a combination of earnings and economic value measures.
What is the economic value of equity formula?
EVE equals the present value of assets minus the present value of liabilities, plus or minus the value of off-balance-sheet positions, each found by discounting projected cash flows at current market rates. EVE sensitivity is the change in that value under a shocked rate path, divided by the base EVE.
Which deposit assumptions affect EVE most?
The decay rate and the deposit beta of non-maturity deposits. A slower assumed decay or a lower beta makes deposits worth more as cheap long-term funding and raises EVE. The OCC calls non-maturity deposit assumptions one of the most vital in an interest rate risk model.