In interest rate risk, backtesting (or back-testing) is the comparison of what an interest rate risk model forecast or assumed with what actually happened, followed by an explanation of the differences. It comes in two forms. Output back-testing compares the model's projected net interest income or margin with the actual result. Assumption back-testing compares each behavioural assumption, such as a deposit decay rate, a deposit beta or a prepayment speed, with what customers did. Regulators expect both: the FDIC calls back-testing "an integral part of the control process for IRR management". Botminds' Interest Rate Risk (IRRBB) Management treats each of a credit union's 28 key assumptions as a promise and back-tests every one each quarter against what members actually did.
The examples come from the solution's fictional sample credit union, Norrell Federal Credit Union. Tolerances shown are the sample's settings, not regulatory figures.
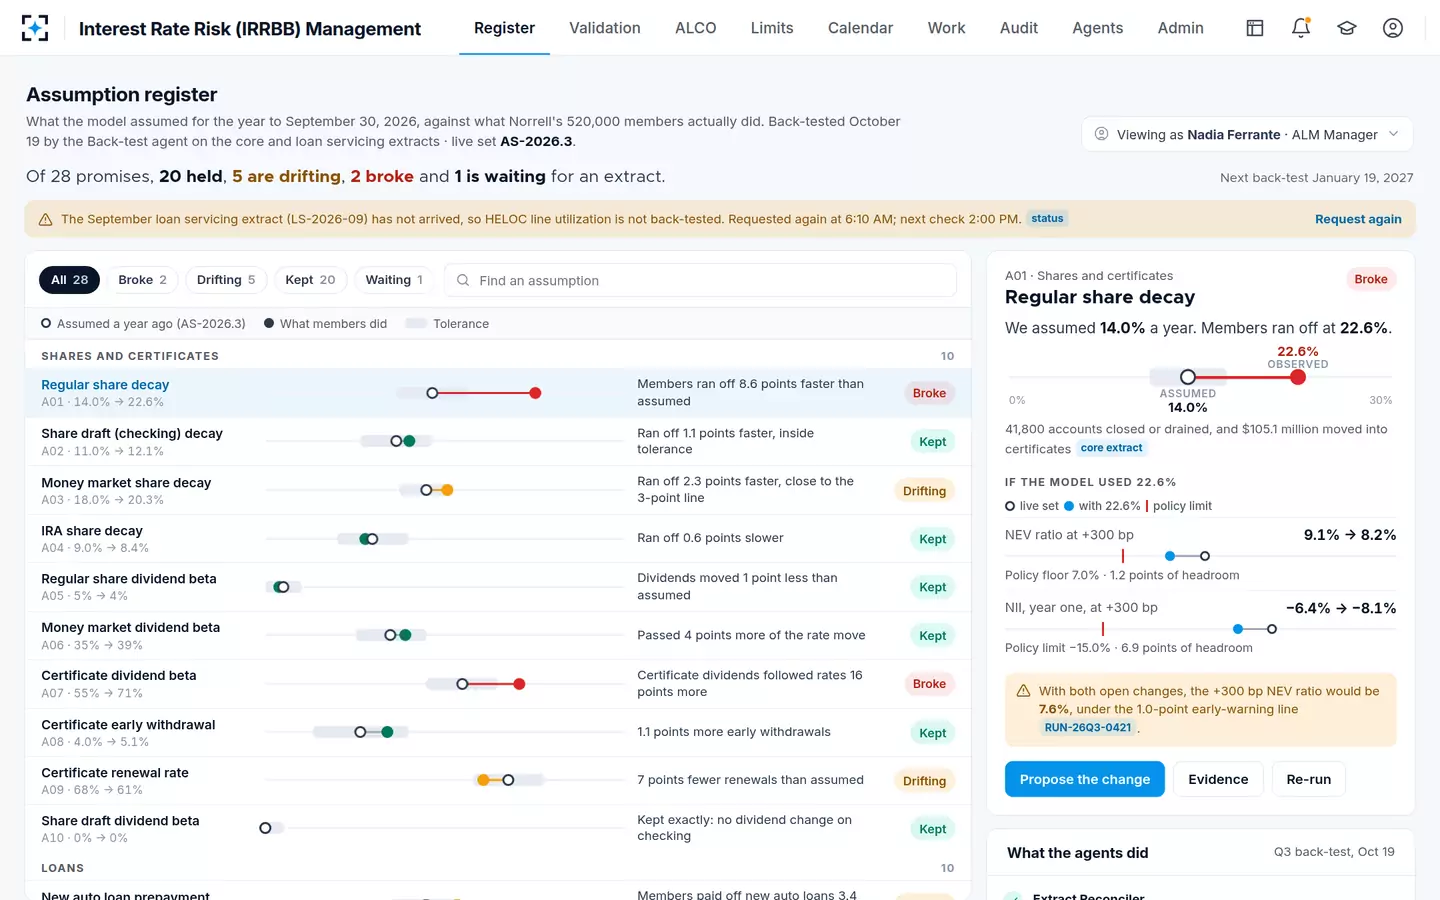
One quarter's back-test of 28 promises
20
assumptions held within tolerance in the sample's third-quarter back-test
5
drifting: inside tolerance but past two-thirds of it
2
broke: regular share decay and the certificate dividend beta
1
waiting: HELOC utilization, because a loan servicing extract had not arrived
What is back-testing in interest rate risk?
Back-testing in interest rate risk is checking a model against reality afterwards: take what the model said would happen over a past period, set it beside what did happen, and find the reasons for every material difference. The FDIC, which calls it variance analysis, gives the fullest definition: it "involves identifying material differences between actual and forecasted income statement and balance sheet amounts and ascertaining the causes of the differences" (FDIC RMS Manual 7.1).
Variance analysis (also known as back-testing) can provide valuable insights into the accuracy and reasonableness of IRR models and is an integral part of the control process for IRR management.
FDIC, RMS Manual of Examination Policies, Section 7.1, Sensitivity to Market Risk
Every regulator's text asks for it. The OCC's examination questionnaire asks: "Is back-testing (model output is compared against subsequent financial results) performed?", and its validation standards say "back-testing is often conducted by comparing actual results with the model's projections" (OCC Comptroller's Handbook, Interest Rate Risk). The revised model risk guidance of April 2026 names back-testing as one form of outcomes analysis and expects adjustment or recalibration when a model's performance deviates beyond the bank's own thresholds (Revised Guidance on Model Risk Management, attachment to SR 26-2).
The cost of not doing it is documented. The Federal Reserve's review of Silicon Valley Bank found that the bank "did not conduct back-testing, had limited sensitivity testing, and did not have an adequate second line function to provide review and challenge to decisions and model assumptions" (Federal Reserve, SVB review, April 2023). Its supervisors' November 2022 finding read: "The simulation forecasts are directionally inconsistent with actual performance. Net interest income and the net interest margin both fell, while the model predicted increases." The rules for such matters requiring attention changed with the OCC and FDIC final rule effective November 2, 2026, discussed in the guide to the MRA rule.
Back-testing the forecast, and back-testing each assumption
Output back-testing asks whether the model's forecast was right; assumption back-testing asks whether each promise inside it held. The first is quicker and is what most institutions do. The 2012 interagency FAQ describes it: "Many institutions back-test model outcomes by determining the key drivers of differences between actual net-interest margin results and the modeled net-interest margin for a given period", isolating drivers "such as actual interest rates, prepayment speeds, other runoff, and new volumes" (Interagency IRR FAQ, 2012, question 10).
The second catches what the first misses. The FDIC explains why with a mortgage example: actual prepayments can run far faster than projected while new lending replaces the runoff, so the ending loan balance shows little variance even though the prepayment assumption was badly wrong. A forecast can be right for the wrong reasons, and the next shock will not offset the error the same way. The FDIC's conclusion is that the key assumptions themselves, including interest rate movements, driver rates, non-maturity deposits, prepayment speeds and account aggregations, need checking against actual behaviour on a regular basis.
The FAQ adds a method point that applies to both: "Isolating these key drivers in back-testing analysis is also important since testing too many variables at the same time produces unreliable and less meaningful results." One assumption at a time, on its own cohort, is slower to design and much easier to interpret.
Every assumption is a promise
An assumption is a promise the model makes on customers' behalf: that regular shares will run off at 14% a year, that a quarter of a rate rise will reach money market members, that auto loans will prepay at a given speed. Back-testing reads each promise against the year that followed, with a tolerance around it. The figure shows eight of the sample credit union's 28 promises, on one line each.
Interest Rate Risk (IRRBB) Management: eight of 28 promises, assumed against observed
Regular share decayA01 · 14.0% assumed, 22.6% observed
Broke
Share draft decayA02 · 11.0% assumed, 12.1% observed
Held
Money market share decayA03 · 18.0% assumed, 20.3% observed
Drifting
IRA share decayA04 · 9.0% assumed, 8.4% observed
Held
Regular share dividend betaA05 · 5% assumed, 4% observed
Held
Money market dividend betaA06 · 35% assumed, 39% observed
Held
Certificate dividend betaA07 · 55% assumed, 71% observed
Broke
Share draft dividend betaA10 · 0% assumed, 0% observed
Held
Read down the column and the pattern is plain. The promises about balances on share drafts and IRA shares held; the dividend betas on regular shares and money market shares held. The two that broke both concern certificates: members moved $105.1 million from regular shares into certificates, and certificate dividends followed market rates 16 points more than assumed. That is why the sample re-runs every broken assumption alone and together before anyone votes, and why the two broken assumptions together bring the NEV ratio at +300 bp within 0.6 points of the policy floor.
Where the 28 promises stood after the third-quarter back-test
The assumption register: what the model promised against what members did
How do you back-test a deposit decay rate?
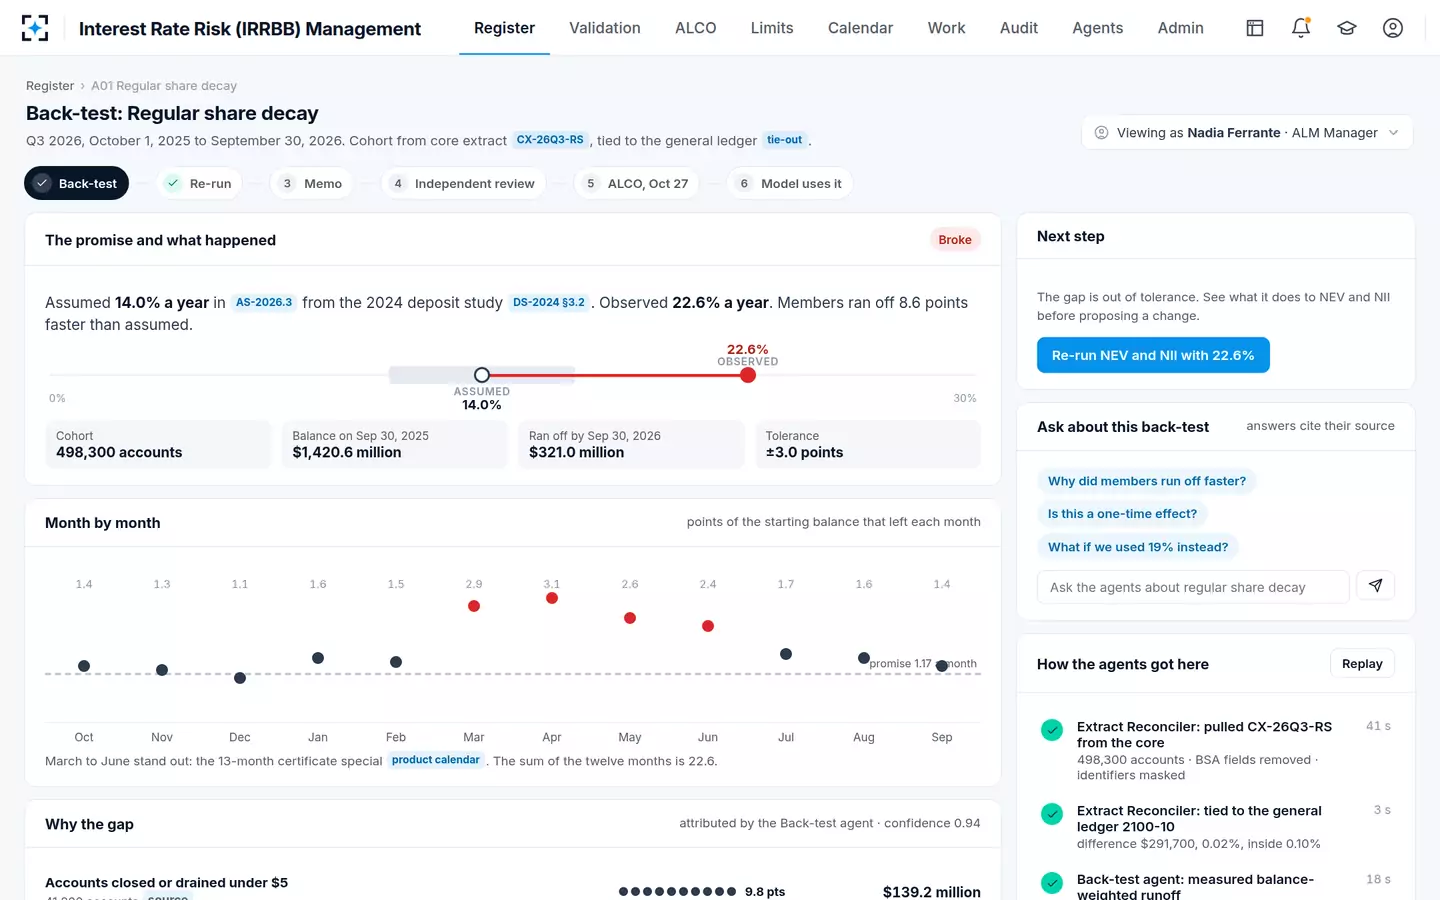
Back-test a deposit decay rate by fixing the accounts open at the start of the year, tying their balance to the general ledger, measuring how much of that balance had left a year later, and comparing the result with the assumed rate on the same basis, by balances or by accounts. In the sample, 498,300 regular share accounts held $1,420.6 million; $321.0 million ran off, 22.6% against 14.0% assumed, and the gap broke down into closures, moves into certificates and drawdowns by members who stayed.
Then test the result before believing it. A month-by-month view showed four high months during a certificate special; without them runoff was still 17.4%, so the promise was broken even on the generous reading. The calculation step by step, the choice between balances and accounts, and what the stale rate cost in NEV and limits are in the deposit decay rate guide.
One promise, twelve months, and the months that broke it
How do you calculate a deposit beta?
A deposit beta is the change in a deposit rate divided by the change in the market rate it follows, over the same period. The OCC's definition and example: "Betas are estimates of the change in an instrument's pricing versus the change in market rates. For example, if market rates increase 100 basis points and the rate on a bank's money market accounts increases 80 basis points, this would equal a beta of 80 percent." Researchers at the Federal Reserve Bank of New York describe the same measure as "the portion of a change in the fed funds rate that is passed on to the deposit rate" (Liberty Street Economics, April 2023).
Deposit beta formula, worked two ways
| Step | OCC example | Illustrative certificate back-test |
|---|---|---|
| 1. Change in the driver rate over the period | +100 basis points | +200 basis points |
| 2. Change in the deposit rate over the same period | +80 basis points | +142 basis points |
| 3. Beta = step 2 ÷ step 1 | 80 ÷ 100 = 80% | 142 ÷ 200 = 71% |
| 4. Compare with the assumed beta | Not applicable | 71% observed against 55% assumed: 16 points over, outside a ±10-point tolerance |
Two choices matter more than the arithmetic. The first is the driver rate: the federal funds rate, a Treasury yield or a competitor rate; the FDIC says beta assumptions "should be based on an analysis of the relationship between the product (e.g., MMDA) and the driver rate (e.g., federal funds rate)". The second is the period. A beta measured over one quarter can look nothing like one measured over a whole cycle, because deposit rates lag. The New York Fed researchers report that in the fourth quarter of 2022 "the average fed funds rate reached 3.7 percent and interest-bearing deposit rates reached 1.4 percent", and that the cumulative interest-bearing deposit beta reached almost 0.4 in one year rather than the three years it took in the previous cycle. A beta back-test should state its period and its driver, and use the ones the model uses.
What tolerance should a back-test use?
No regulator sets a tolerance; it is the institution's choice, and it should be set by how much a miss would move the limits, not by habit. The FDIC's guidance on sensitivity testing suggests the method: test each assumption one at a time, up and down, "e.g., a 10, 25, and 50 percent increase/decrease from the base-case assumption", and where a change "disproportionately impacts the model", implement "more robust assumption documentation, monitoring, and testing." An assumption that barely moves NEV can tolerate a wide band; one that moves it a point needs a narrow one.
The sample credit union uses ±3.0 points for deposit decay rates and ±10 points for dividend betas, with a "drifting" flag at two-thirds of the band, so a promise that is wearing thin is seen a quarter or two before it breaks. Its two broken assumptions had both drifted in the first and second quarters before breaking in the third. Tolerances are settings: changing one is itself a change request that a second administrator approves, because a band widened afterwards is the quiet way to make a broken promise look kept.
How often should assumptions be back-tested?
At least once a year by every regulator's minimum, and every quarter in practice if the institution wants to see a change in behaviour before it reaches the next examination. The FDIC says variance analysis "should be done periodically and no less frequently than annually"; the OCC accepts annual comparisons of actual and forecast performance as the minimum at small and less complex banks. The FAQ points to the reason for more: "Tracking these variances over time helps to determine when key assumptions may need to be recalibrated."
An annual back-test done before the examination finds a broken assumption up to a year late, and leaves the institution explaining a stale number rather than a managed one. A quarterly calendar, the sample's design target for all 28 assumptions, is what turned two drifting quarters into an escalation in the sample. The case for doing that on your own extracts rather than waiting for a new study is made in core deposit study or back-test.
What if a back-test fails?
A failed back-test should start a documented response on a clock: find the cause, measure the impact on every limit, and either change the assumption through independent review and committee approval or re-affirm it with reasons. The FDIC's expectation for the paperwork is specific: management "should document their analysis, highlighting any material variances, the primary cause of identified variances, and any proposed or implemented corrective actions." It also sorts the possible causes: "Variances resulting from errors can be broken down into three major components: input, modeling, or assumption errors."
The clocks that follow a back-test in the sample credit union's policy
| Back-test result | What must happen | By when |
|---|---|---|
| Held, inside tolerance | Included in the quarter's documented re-affirmation | Before the next ALCO |
| Drifting, past two-thirds of tolerance | Written comment from the ALM manager and the business line | Within 10 business days |
| Broke, outside tolerance | Change memo or documented re-affirmation, then independent review and ALCO | Within 15 business days and before the next ALCO |
| Drifted two quarters, then broke | Escalated to the CFO; supervisory committee notified | On the back-test date |
| Extract missing | Back-test of that assumption waits; extract requested again | Within 2 business days |
| A limit breached on a re-run | Reported to the CFO | The same day |
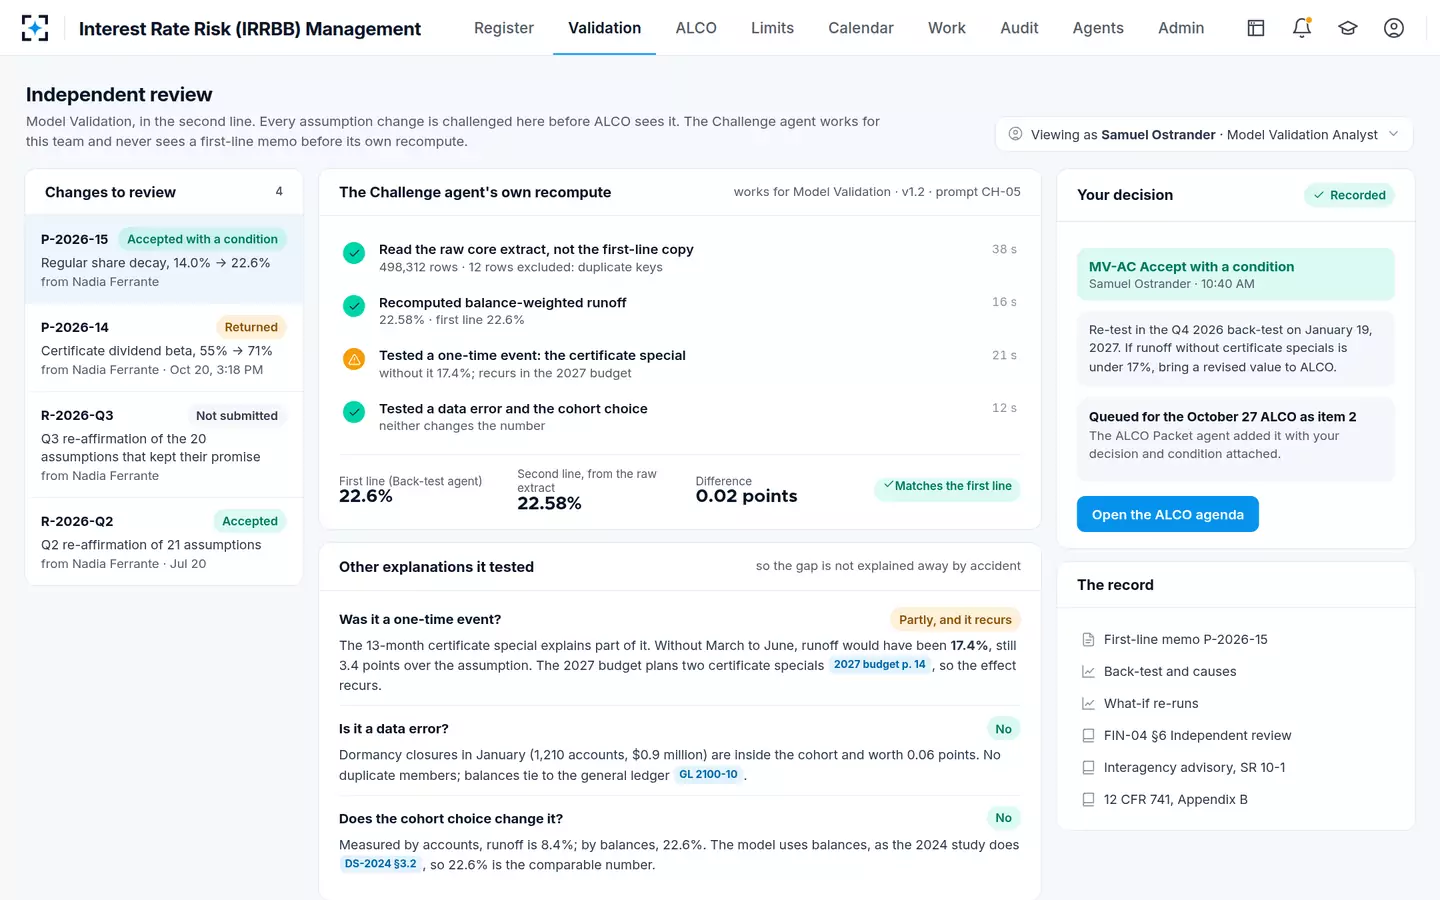
A failure is not automatically a change. Sometimes the right answer is that the year was unusual and the assumption should stand; the FDIC itself notes that "models are forward looking; therefore the usefulness of historical variance analysis may be limited." What is not acceptable is silence, or a change that nobody independent has checked. In the sample, the validator accepted the new decay rate with a condition: re-test it next quarter, and if runoff without certificate specials falls under 17%, bring a revised value to ALCO.
A broken promise, accepted as a change with a re-test condition
What is the difference between back-testing and validation?
Back-testing is one test; validation is the whole independent review of which it is a part. Validation also covers whether the inputs are complete and reconciled, whether the model's method suits the balance sheet, and whether the assumptions were set and approved properly. And back-testing is done by the first line, as part of running the model, while validation must be done by someone independent of it. The FDIC is explicit that the people performing the independent review should not be the ones reconciling inputs, developing assumptions or running the variance analysis.
The two meet in the validator's file. A validator reviews the first line's back-testing, checks that it was done, and, in the strongest practice, reproduces the key numbers independently. What that file should contain is set out in ALM model validation under SR 26-2.
Questions people ask
How do you back-test an ALM model?
Compare the model's projected net interest income or margin for a past period with the actual result and isolate the drivers of the difference, such as rates, prepayments, runoff and new volumes, as the 2012 interagency FAQ describes. Then back-test each key assumption against what customers did, because offsetting errors can make a forecast look right.
What is variance analysis in interest rate risk?
It is the FDIC's term for back-testing: identifying material differences between actual and forecasted income statement and balance sheet amounts and finding their causes. The FDIC expects it at least annually, documented with the variances, their primary causes and any corrective actions.
How do you back-test deposit betas?
Divide the change in each deposit product's rate by the change in its driver rate over the same period, and compare the result with the beta the model assumed for that product and that kind of rate move. State the period and the driver, because deposit rates lag market rates and a beta measured early in a cycle understates the eventual pass-through.
Can you back-test an EVE model?
Only partly, because the bank does not observe the market value of its whole balance sheet. The OCC notes that back-testing an economic value model "can be more difficult" and that observable market prices are used where they exist. Back-testing the assumptions that drive EVE, especially deposit decay and betas, is the practical substitute.
What does a back-test report to ALCO include?
For each key assumption: the assumed value and its source, the observed value and the period, whether it held, drifted or broke against its tolerance, the causes of any gap, and the effect of the observed value on every limit. Broken assumptions should come with a change memo or a documented re-affirmation and the independent reviewer's decision.