The NCUA NEV supervisory test is the quantitative measure NCUA examiners use to classify a federally insured credit union's interest rate risk. It compares net economic value (the present value of assets minus liabilities) with capital after a rate shock, using standardized values for non-maturity shares, and assigns Low, Moderate or High risk from two readings: the post-shock NEV ratio and post-shock NEV sensitivity. Under NCUA Supervisory Letter 22-01, Low means a ratio above 7% and sensitivity below 40%; High means a ratio below 4% or sensitivity above 65%. The useful number for a CFO is not the label but the distance to each line, because that distance is what one broken assumption can use up. Botminds' Interest Rate Risk (IRRBB) Management reads every run against the test's lines and the credit union's own policy limits.
The rules below are NCUA's, linked where they are used. The worked example is the solution's fictional sample, Norrell Federal Credit Union.
The lines that set a credit union's IRR classification
7%
post-shock NEV ratio above which, with sensitivity below 40%, the test reads Low
4%
post-shock NEV ratio below which the test reads High, whatever the sensitivity
65%
NEV sensitivity above which the test reads High, whatever the ratio
0
documents of resolution required by a High classification on its own, under SL 22-01
What is the NCUA NEV supervisory test?
The NEV Supervisory Test is NCUA's standard measure of a credit union's interest rate risk relative to capital, introduced in 2017 and revised in 2022. NCUA describes it as "a capital-at-risk measurement that uses standardized values for non-maturity shares to assess the level of IRR", and explains its role: it "measures IRR exposure relative to capital" and "establishes a uniform and transparent measure of market risk that allows exam staff to scale the IRR scope and review procedures to match the credit union's level of risk" (NCUA Supervisory Letter 22-01).
The test sits on top of a rule and its guidance. Under 12 CFR 741.3(b)(5), federally insured credit unions with more than $50 million in assets must have a written interest rate risk policy and an effective program, and Appendix A to Part 741 defines NEV as the measure that calculates "the present value of assets minus the present value of liabilities" (12 CFR Part 741). What the policy must contain, and who signs it, is set out in the interest rate risk policy guide.
What NEV ratio is high risk?
A post-shock NEV ratio below 4% is high risk, as is NEV sensitivity above 65%, under the classification NCUA adopted in September 2022. Before then there were four classes, and the lowest ratios were "Extreme"; SL 22-01 removed that class and widened High to absorb it.
NCUA NEV Supervisory Test risk classifications, before and after SL 22-01
| Classification | Post-shock NEV ratio, before | NEV sensitivity, before | Post-shock NEV ratio, now | NEV sensitivity, now |
|---|---|---|---|---|
| Low | Above 7% | Below 40% | Above 7% | Below 40% |
| Moderate | 4% up to 7% | 40% to 65% | 4% up to 7% | 40% to 65% |
| High | 2% up to 4% | 65% to 85% | Below 4% | Above 65% |
| Extreme | Below 2% | Above 85% | Eliminated | Eliminated |
The worse of the two readings decides. NCUA says "both thresholds apply, so either measure triggers the risk classification", and its Financial Performance Report guide describes the same rule for the estimated tool: a final risk level "using the worst of the two measurements" (NCUA, Financial Performance Report Ratio and Formula Guide, 2023). A credit union with a healthy 9% ratio can still read Moderate if its sensitivity is 45%.
What is NEV sensitivity?
NEV sensitivity is the test's measure of how much net economic value falls under the shock, expressed in percent; the post-shock NEV ratio is the level that remains. NCUA notes that "the NEV Test uses two measurements to determine the risk classification; both use a post-shock scenario which starts with the base value or current value of assets, liabilities and off-balance sheet items." One reading is about the cushion left; the other is about how fast the cushion shrinks.
In the sample credit union's run, sensitivity is calculated as the fall in the NEV ratio from the base case, as a share of the base: with regular share decay at the observed rate, the ratio falls from 12.3% at no shock to 8.2% at +300 bp, a sensitivity of 33.3%. Check your own ALM report's definition before comparing it with the test; a model that measures the change in NEV dollars rather than the ratio will give a somewhat different number.
On that definition the two lines interact in a way worth knowing. A credit union whose base NEV ratio is 12.2% reaches the 40% sensitivity line at a post-shock ratio of about 7.3%, close to the 7% ratio line, so the two lines bind almost together. A credit union with a base ratio below about 11.7% reaches the 7% ratio line before the 40% sensitivity line; one with a much higher base ratio hits the sensitivity line first. That arithmetic is ours, and it explains why a well-capitalised credit union can still read Moderate.
What shock does the NEV test use?
The test reads results after an instantaneous +300 basis point shock. NCUA's guide to the Financial Performance Report describes its Estimated NEV Tool, which SL 22-01 calls "an automated measurement of the NEV Test", as calculating "a credit union's Net Economic Value (NEV) for base case and +300 basis point scenarios each quarter based on Call Report data." The test is a single shock; a credit union's own policy usually sets limits for several.
Rising rates are the test's concern because of what credit unions hold. SL 22-01 opened with the observation that "the first half of 2022 experienced the sharpest increase in interest rates in decades" and that credit unions' concentrations in longer maturity assets "have significantly increased sensitivity to changes in interest rates." The 2010 interagency advisory, which NCUA co-issued, already asked institutions to look beyond ±200 bp, to shocks of 300 and 400 basis points in both directions (Interagency Advisory, 2010).
How is the NEV test different from my model?
The test uses NCUA's standardized values for non-maturity shares; your model uses your own assumptions for how fast shares run off and how much of a rate rise reaches members. Everything else may be the same, but that one difference can move the result by points, because non-maturity shares are usually a large part of a credit union's funding and their assumed value drives NEV. Appendix A makes the same point: a credit union that values its shares at a premium raises its NEV, so the assumptions behind that premium deserve close scrutiny.
The NEV Supervisory Test and your own NEV model measure different things
NCUA NEV Supervisory Test: A uniform supervisory classification that scales the examination
Your ALM model's NEV: Measuring your risk against the limits your board set
NCUA NEV Supervisory Test: Standardized values set by NCUA
Your ALM model's NEV: Your own decay rates and betas, from your study and back-tests
NCUA NEV Supervisory Test: A single +300 bp scenario
Your ALM model's NEV: Whatever your policy sets, typically ±100 to ±400 bp
NCUA NEV Supervisory Test: Low, Moderate or High, from the worse of two readings
Your ALM model's NEV: NEV ratio and sensitivity at each shock, with headroom to each limit
NCUA NEV Supervisory Test: The estimated tool from Call Report data can stand in
Your ALM model's NEV: Your NEV report, if you produce one, can be used instead
The two can disagree in either direction. A credit union whose own decay assumptions are slower than NCUA's standard values will see a better NEV in its model than in the test; one with faster assumptions will see the opposite. Both numbers rest on a share assumption, and only one of them is yours to defend. Whether yours still holds is a back-test question, worked through in what a stale deposit decay rate costs.
How far is your +300 bp result from High?
Measure the distance in the units of each line: points of NEV ratio above 7% and 4%, and points of sensitivity below 40% and 65%. Then re-measure after every assumption change that is open, alone and together. The sample credit union shows why the second step matters: each change looks safe by itself, and together they use most of the room.
Distance to the Moderate line at +300 bp, before and after two open changes
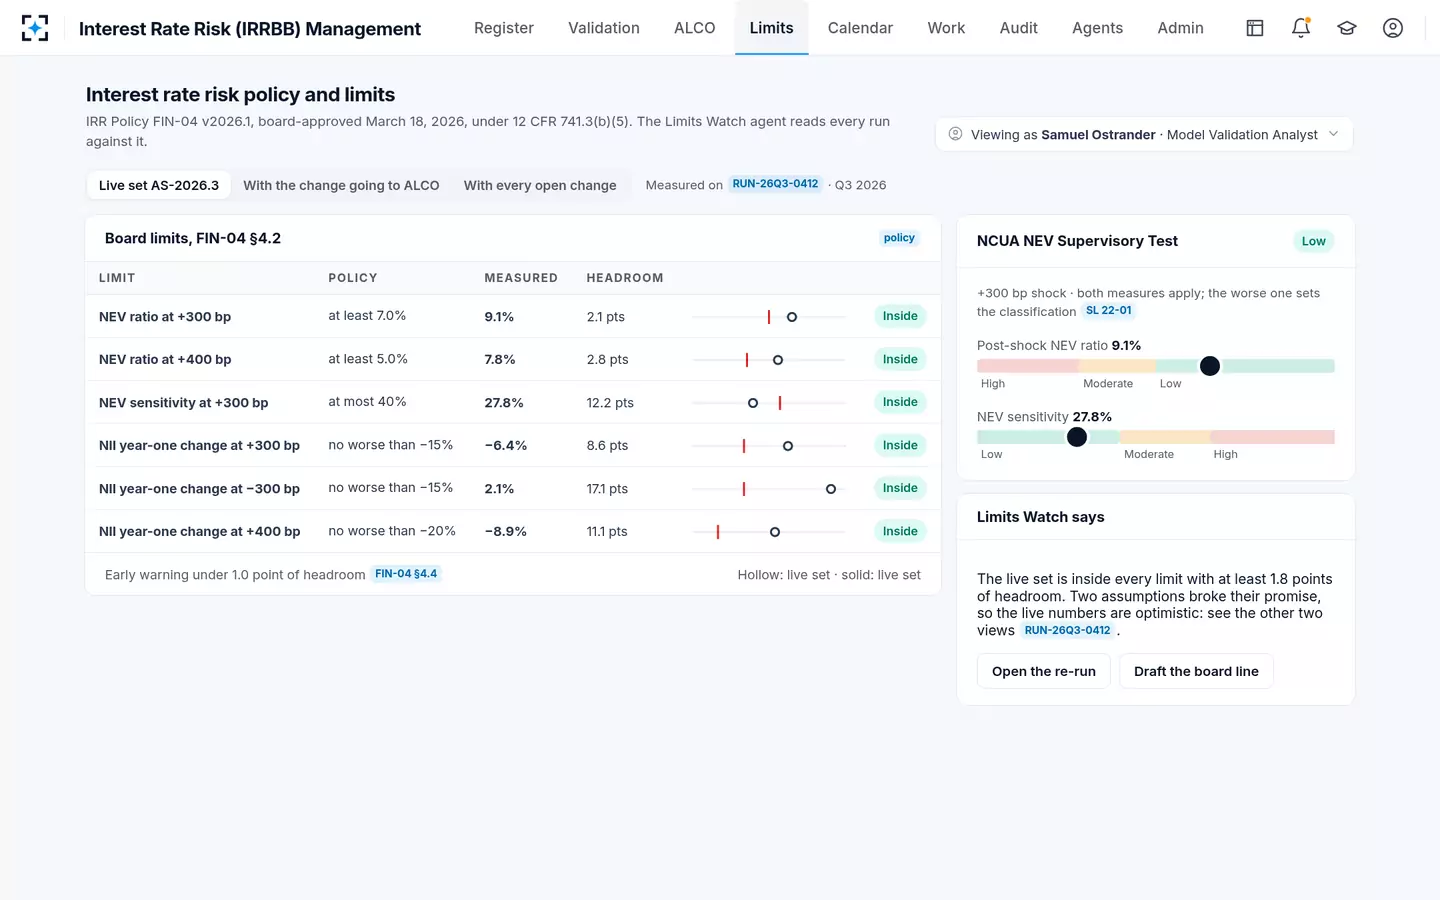
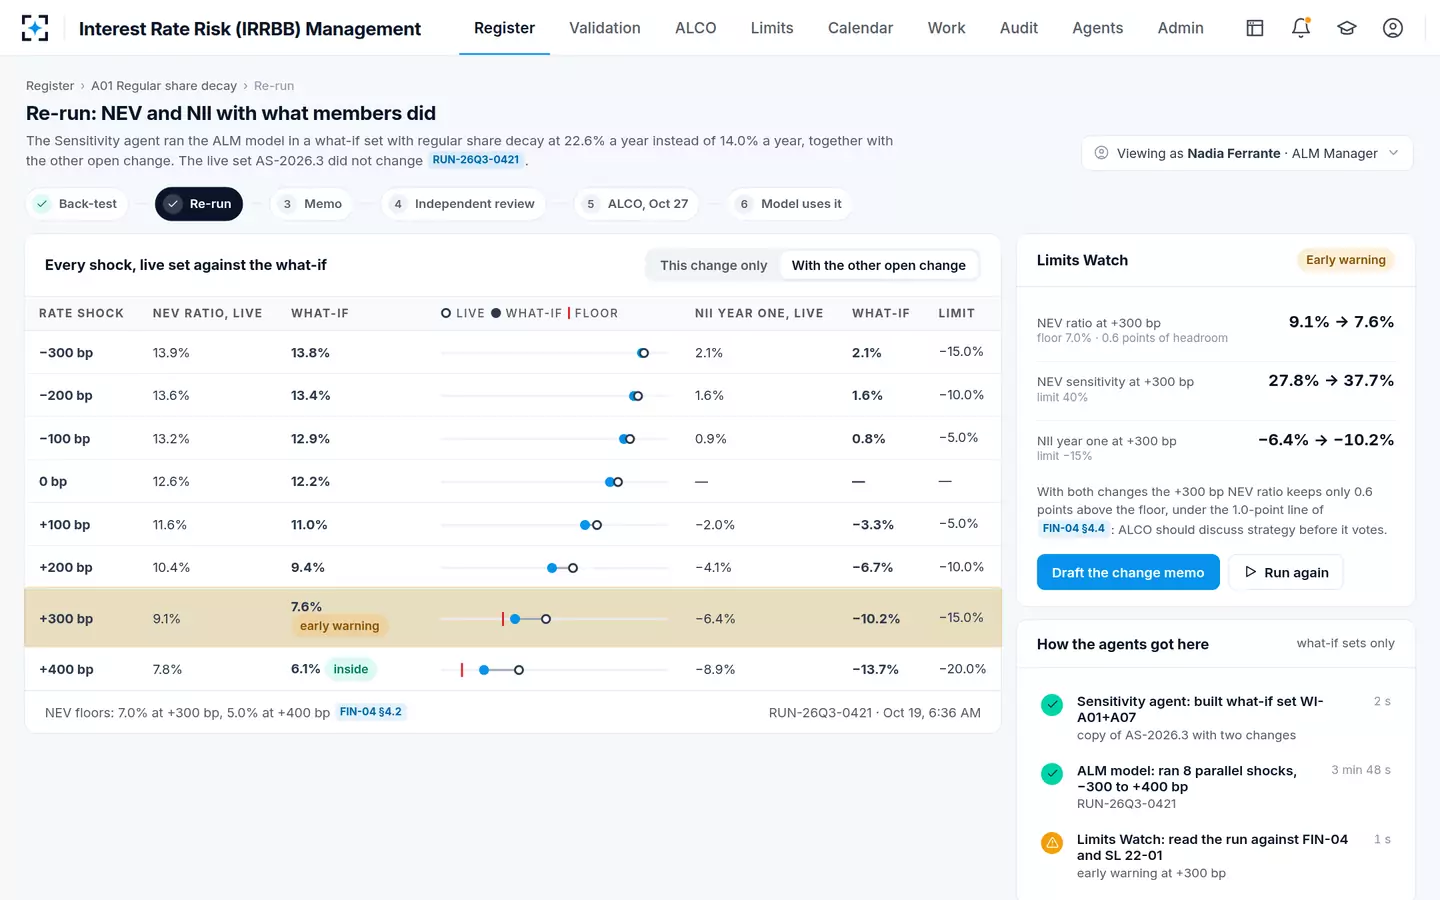
In every run the sample reads Low, and an examiner looking only at the label would see no change. The distance tells a different story. On the live assumption set, the NEV ratio had 2.1 points above the Moderate line; with what members actually did and the second open change, it has 0.6. The distance to High barely matters here, 3.6 points of ratio and 27.3 points of sensitivity even after both changes, but the distance to Moderate is what decides whether the next examination asks how the credit union is adapting.
The same runs, measured against every NCUA line
| Run at +300 bp | NEV ratio | Above 7% (Moderate) | Above 4% (High) | Sensitivity | Below 40% | Below 65% |
|---|---|---|---|---|---|---|
| Live set | 9.1% | 2.1 pts | 5.1 pts | 27.8% | 12.2 pts | 37.2 pts |
| Observed share decay | 8.2% | 1.2 pts | 4.2 pts | 33.3% | 6.7 pts | 31.7 pts |
| Both open changes | 7.6% | 0.6 pts | 3.6 pts | 37.7% | 2.3 pts | 27.3 pts |
Interest Rate Risk (IRRBB) Management: the board's limits and the NCUA NEV Supervisory Test in one view
Does a high NEV classification require a document of resolution?
No, not on its own. SL 22-01 states: "A DOR is not required for any NEV Test or ENT risk classification alone. Similarly, a credit union is not expected to have a plan of action just because their IRR classification is high." The need for a document of resolution and a written plan is decided "on a case-by-case basis."
The letter gives examples on both sides. A DOR should be considered when the level of IRR is an undue risk to the Share Insurance Fund and the credit union is not acting promptly; when it has high IRR and has not updated its approach to current market conditions; or when it has a material governance deficiency in identifying, measuring, monitoring and controlling the risk. A DOR may not be necessary when the move to High is "primarily from a rapid change in interest rates", or when the credit union "has already acted or has an adequate plan to adapt to the current interest rate environment."
Read together, the examples move the weight from the number to the governance around it. A High reading with a documented, approved response and assumptions that are back-tested every quarter is a different examination from a High reading with assumptions nobody has checked since the last deposit study.
How do examiners assign the IRR rating?
Examiners start from the test's classification and may move the rating on qualitative factors, documenting why. SL 22-01 says examiners "will assign the IRR rating based on the quantitative NEV Test or ENT but may improve the rating on other factors", that for High or Moderate classifications they "may adjust the IRR rating up or down", and that "it would be unusual for an examiner to improve the IRR rating when the NEV Test or ENT results in a high risk classification." Its own example of a reason to improve a borderline rating is "conservative assumptions in the IRR model combined with a low risk qualitative rating."
How far the review goes, by size and classification
| Credit union | Classification | Examination scope under SL 22-01 |
|---|---|---|
| Under $500 million | Any | The estimated NEV tool can be the resource; if the credit union produces an NEV report, staff may use the NEV Test instead; scope can expand at examiner discretion |
| $500 million to $10 billion | High | Review of the source of high IRR, risk management and controls, and potential impact on earnings and capital |
| Over $10 billion | Any | All review steps in the IRR Workbook, regardless of classification |
| Any | Any, with a rating change | Examiners document the quantitative and qualitative factors behind the change; the CAMELS "S" component may also change |
That is where the quality of a credit union's assumptions enters the rating. An examiner deciding whether a borderline result can be improved looks at whether the model's assumptions are conservative and supported. A register showing each assumption against what members actually did, with every change independently reviewed and approved before use, is the evidence that answers that question; how it is built is set out in the guide to back-testing every assumption.
What is the estimated NEV tool?
The estimated NEV tool (ENT) is NCUA's automated approximation of the NEV Test, generated each quarter from a credit union's Call Report. SL 22-01 says it "approximates an NEV measure by using a credit union's Call Report data, as well as sensitivity estimates developed by the NCUA", "requires no user input", and is provided "through the quarterly Financial Performance Report." It produces Low, Moderate or High for both readings, like the test.
Because it runs on Call Report data, the ENT inherits any reporting error. NCUA warns that "high risk classifications in the ENT sometimes result from inaccurate Call Report information", naming as a common example held-to-maturity investments reported without their fair value or with the wrong one. A credit union that sees an unexpected ENT classification should check Schedule B of its Call Report before it checks its balance sheet.
Before the examiner runs the NEV test
- Know your distance to each line
Points above 7% and 4% on the ratio; points below 40% and 65% on sensitivity.
- Re-measure with every open assumption change
Alone and together; two safe changes can use most of the room.
- Reconcile your model with the test
Explain how your share assumptions differ from NCUA's standardized values, and what that does to NEV.
- Back-test the share assumptions
Decay and dividend betas against what members did last year, with a tolerance.
- Check the Call Report inputs
Held-to-maturity fair values are a common source of a wrong ENT result.
- Have the response documented
If the reading is High or close to it, an approved plan or a documented reason it is not needed.
An early warning before the NEV ratio reaches the Moderate line
Questions people ask
What is a good NEV ratio for a credit union?
NCUA's test reads a post-shock NEV ratio above 7% as Low risk, provided sensitivity is below 40%. A "good" ratio is one that stays above your board's floor and NCUA's lines with room for an assumption to be wrong; the sample credit union's policy warns at under 1.0 point of headroom.
What is a net economic value credit union report?
It is the ALM report showing the present value of the credit union's assets minus its liabilities, the NEV ratio to the present value of assets, and how both change under rate shocks. NCUA's Appendix A to Part 741 describes NEV as a comprehensive measure of interest rate risk because it captures all future cash flows.
When did NCUA change the NEV test?
NCUA introduced the NEV Supervisory Test with Letter 16-CU-08, effective in 2017, and revised it with Supervisory Letter 22-01 in September 2022. The revision eliminated the Extreme class, redefined High as a ratio below 4% or sensitivity above 65%, and removed any presumed need for a DOR from the classification alone.
Does the NEV test apply to credit unions under $50 million?
The written-policy rule applies above $50 million in assets. Below it, NCUA's estimated NEV tool still runs on Call Report data: its Financial Performance Report guide shows the tool's post-shock ratio and sensitivity for credit unions under $100 million in assets.
How does NCUA rate sensitivity to market risk?
Since April 2022, NCUA's CAMELS system has a separate "S" component for sensitivity to market risk. SL 22-01 notes that an IRR review may result in a high IRR rating and may also warrant a change in the S rating.