ALCO limits are the board-approved ceilings on how much a bank's earnings and economic value may fall under specified interest rate shocks, usually set on 12-month net interest income (NII) and economic value of equity (EVE) at parallel shocks of ±100 to ±400 basis points, alongside liquidity and concentration limits. The interagency guidance asks for limits "neither so high that they are never breached nor so low that exceeding the limits is considered routine and not worthy of action", which is a calibration question, and the OCC now publishes the data to answer it: its fall 2026 statistics from 791 midsize and community banks give the median board limit and the spread of actual exposures at every shock. Set side by side, they show that the median bank's EVE exposure uses less than a third of the median EVE limit. Botminds' ALCO Reporting compares every limit a board has set, every month, and drafts the note when one gets close.
The bank-specific example is a fictional sample bank, Tessaly Community Bank, $3.4 billion in assets, as it runs through the solution; its limits and exposures are sample data. The peer figures are the OCC's, from examination data, linked where they appear.
How much of the median EVE limit the median bank, and the bank at the riskier quartile, use
What limits does ALCO set?
ALCO proposes, and the board approves, limits on how far earnings and capital may move for given rate changes, and the committee monitors them. The FDIC sets out the expectation: "Risk limits should be explicit dollar or percentage parameters", and "At a minimum, limits should be expressed over one and two year time horizons, correspond to the internal measurement system's methodology, and appropriately address all key IRR risks and their effect on earnings and capital" (FDIC RMS Manual §7.1). Earnings-based limits may address net interest margin, net interest income, net operating income and net income; capital-based limits economic value of equity and other comprehensive income.
In practice most community banks limit 12-month NII and EVE at each parallel shock, and add liquidity limits (minimum liquid assets, maximum wholesale funding, concentration of large depositors) and capital limits. The sample bank has 23: NII and EVE shock by shock, plus liquidity and concentration measures, including a cap of 5.00% of deposits from any single program partner. The OCC's glossary describes what all of them are for: "limits approved by a bank's board of directors that define IRR tolerance over a range of possible interest rate scenarios" (OCC, IRR Statistics Report, Fall 2026).
What are typical EVE limits for banks?
The typical EVE limit for an OCC-supervised community or midsize bank is a 10% loss of EVE at ±100 bp, 20% at ±200 bp, 30% at ±300 bp and 40% at +400 bp (36% at −400 bp). Those are the medians in the OCC's fall 2026 data. The middle half of banks sit within about five points either side: at +300 bp the 25th percentile is −30% and the 75th −25%; at +400 bp, −40% and −30%.
Exposures are much smaller than the limits. At +300 bp the median bank's modeled EVE falls 8%, and the bank at the 25th percentile, the riskier quarter's edge, falls 18%. At +400 bp, the figures are −11% and −24%. The OCC is careful to say the figures are there for information and are not limits it suggests; the guide to the OCC's statistics report sets out that caveat and how to read the rest. They are what banks do, not what they should do.
What is a typical NII limit at +300 bp?
The typical NII limit at +300 bp is a 20% fall in 12-month net interest income: that is the median, and the 25th percentile is the same, −20%, with the tighter quarter of banks at −15%. At the other shocks, the medians run −10% at ±100 bp, −15% at ±200 bp and −25% at ±400 bp, the same on the way up and down.
NII exposure in rising rates looks very different from EVE exposure, because many banks earn more when rates rise. The median bank's modeled 12-month NII rises 2% at +300 bp; the 25th percentile falls 5%. The pressure is on the falling side, where the median bank loses 5% at −300 bp and the 25th percentile 11%. For an NII limit, the shock that matters is the one in the direction the bank's balance sheet is exposed to, and a liability-sensitive bank, like the sample, is exposed to rising rates.
Limit against exposure: how much headroom the median bank leaves
Put the two together and the median bank's limits leave a great deal of headroom: its EVE exposure uses about a fifth of the median EVE limit at ±100 and ±200 bp and under a third at ±300 and ±400 bp. Even the bank at the 25th percentile of exposure uses about 60% of the median limit at every rising shock, below a typical 80% early-warning level. A limit that the riskier quarter of banks would not reach even at its early-warning level is, for most of the population, a limit that will not trip.
A well-managed institution will find a balance between establishing limits that are neither so high that they are never breached nor so low that exceeding the limits is considered routine and not worthy of action.
Interagency Advisory on Interest Rate Risk Management, January 2010
That is not by itself a finding against the median bank. Limits are set for stress, and a bank whose exposure is low because of its balance sheet has done its job. The calibration question is narrower: if the bank's exposure doubled, would any limit notice before the board did? The FDIC's version of the advisory's sentence adds the test: "Effective limits will provide management sufficient flexibility to respond to changing economic conditions, yet be stringent enough to prevent excessive risk-taking."
The opposite failure is a limit that trips and nothing happens. The Federal Reserve found that Silicon Valley Bank "had breached its long-term IRR limits on and off since 2017", and that in the 2020 examination "the examiner proposed an advisory on the lack of escalation, monitoring, and taking actions to remediate breaches" (Federal Reserve, SVB review, April 2023). A limit breached for years has become routine, which is the other half of the advisory's sentence.
Should limits be set on EVE or NII?
Both. The interagency advisory expects a well-managed institution to weigh both the earnings view and the economic value view when it sizes its exposure (EVE vs NII works through the two), because the two measure different horizons: NII limits catch what a rate move does to the next one or two years' earnings, EVE limits what it does to the value of every future cash flow. A balance sheet of long fixed-rate assets funded by deposits can show rising NII in a +200 bp shock for a year while its EVE falls by a fifth.
The 2023 failure shows the cost of watching one. The Federal Reserve's review found that at Silicon Valley Bank, "As EVE was not part of the risk appetite, there is no evidence that the full board was aware of the status of the EVE metric or that it was breaching limits for years." The limits existed; they were not in front of the people who set the bank's risk appetite. An ALCO package that shows NII and EVE limits on the same page, every month, removes that gap. How the full package is laid out is in the annotated ALCO report sample.
Calibrating your own ALCO limits against peers: a worked comparison
To calibrate a bank's ALCO limits against peers, take the OCC's table for its asset size, place each of its limits in the distribution, then place its exposure in the exposure distribution, and read the two together. The sample bank is $3.4 billion, so its peer table is the OCC's $1 billion to $10 billion group.
The sample bank's ALCO limits against the OCC's $1–10 billion peer group
| Measure | Peer median limit | Peer tighter quartile | Sample bank limit | Sample exposure, Sept 30 | Share of limit used |
|---|---|---|---|---|---|
| NII, +200 bp | −15% | −10% | −10% | −6.8% | 68% |
| NII, +300 bp | −20% | −15% | −15% | −9.6% | 64% |
| NII, +400 bp | −25% | −20% | −20% | −12.7% | 64% |
| EVE, +200 bp | −20% | −20% | −20% | −14.2% | 71% |
| EVE, +300 bp | −30% | −25% | −25% | −21.4% | 86% |
| EVE, +400 bp | −40% | −31% | −30% | −27.9% | 93% |
The comparison reads in two steps. The sample bank's limits sit at or inside the tighter quartile of its peers on every rising shock shown: −20% on NII at +400 bp where the median is −25%, −30% on EVE at +400 bp where the median is −40%. And its exposure sits in the riskier quartile: EVE at +400 bp falls 27.9%, beyond the peer 25th percentile of −25% and more than twice the peer median of −12%. Tight limits and high exposure meet at 93%.
That is the diagnosis the data makes possible. The sample bank's problem is not a limit set too tight; at the peer median its EVE limit would show 70% used and nobody would look. It is an exposure in the riskier quarter of its peers, and a limit that does its job by making the committee look. Loosening the limit to the median would be the counterintuitive move the 2023 review warned about, applied to the limit instead of the assumption.
What is an early-warning level for a limit?
An early-warning level is a point below the limit, set as a share of it, at which the measure is reported and watched before it breaches. No regulation sets the level; the sample bank's policy uses 80% for reporting to ALCO and 90% for a written note. The point of two levels is that the first makes the trend visible and the second forces an explanation while there is still room to act.
One ALCO limit, fully specified: the sample bank's EVE limit at +400 bp
Measure
EVE at risk, +400 bp parallel shock
Limit
−30% of base EVE, board-approved, Interest Rate Risk and Liquidity Policy v7 (June 23, 2026)
Early-warning level
80% of the limit (−24.0%): reported to ALCO
Written note required
90% of the limit (−27.0%): a watch note with cause and outlook
September 30
−27.9%, 93% of the limit: on watch, note drafted
Owner
Treasurer, who approves the note before it is reported to ALCO
If breached
Exception note with cause, plan, owner and date; to the board
Changing the limit
A new policy version, approved by the board before it is used
Early warning also needs a trend. The sample bank's EVE at +400 bp was at 87% of its limit at the end of August, 90% at the end of September on the existing assumptions, and 93% once a proposed, more conservative assumption on partner balances is included. A measure that crosses 80% and keeps climbing for two months is a different item from one that crosses and falls back, and the package should show which it is.
What happens when an ALCO limit is breached?
When an ALCO limit is breached, management reports it promptly, explains the cause, proposes a plan with an owner and a date, and the board reviews it; the plan may be to reduce the exposure, or, rarely and with reasons, to change the limit. The FDIC expects that "Policies should be in place to ensure excessive IRR exposures receive prompt attention" and that "Reports or stress tests that reflect significant IRR exposure should be promptly reported to the board (or appropriate board committee)". The advisory names the tools: "Should IRR exposure exceed or approach these limits, institutions can mitigate their risk through balance sheet alteration and hedging."
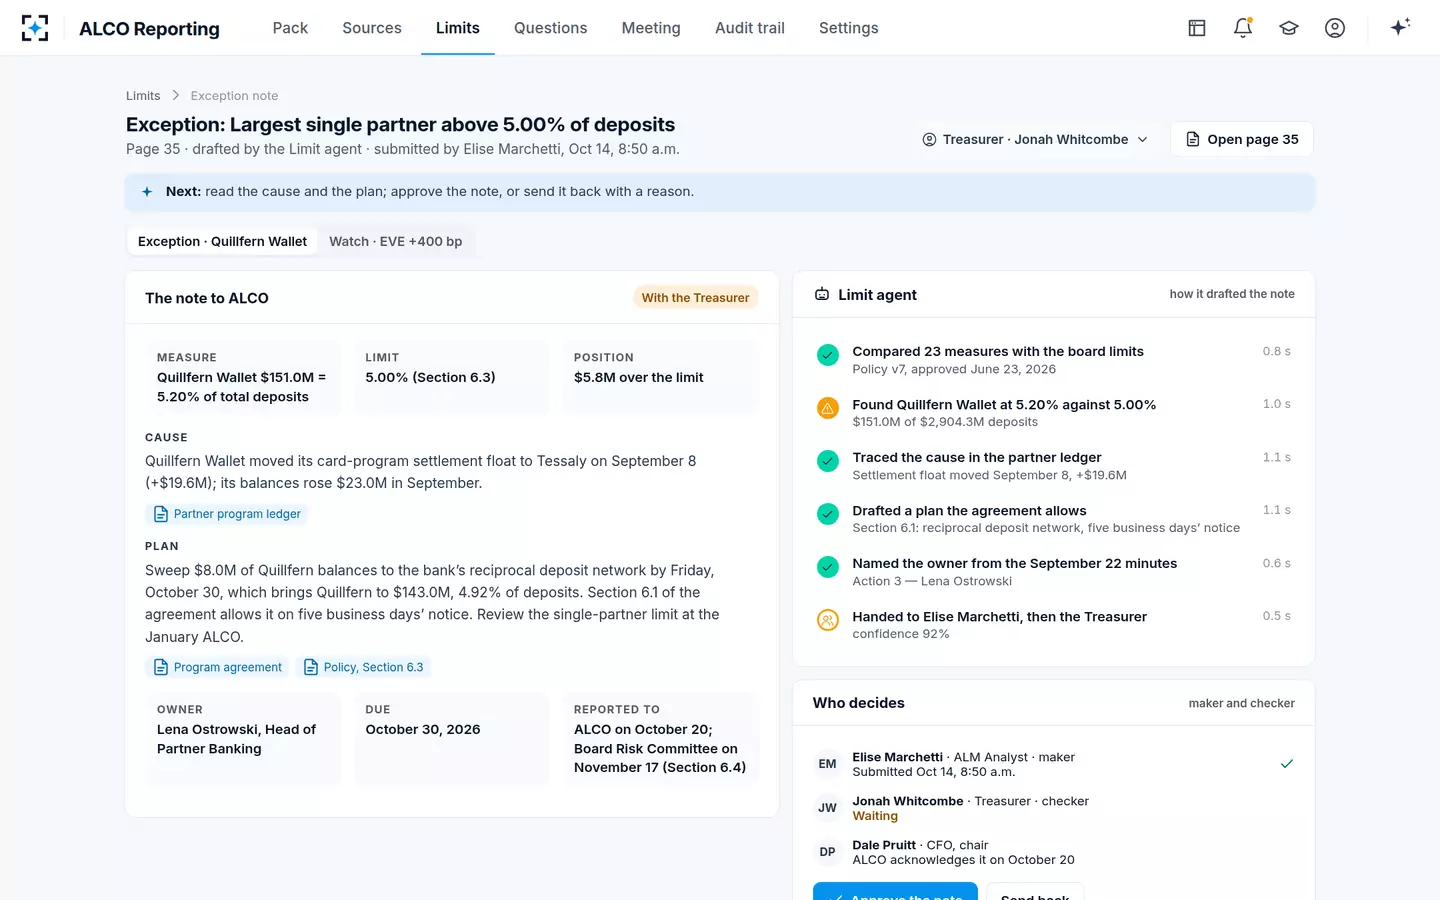
In the sample, the one breach on September 30 was not an interest rate limit but a concentration one: a program partner held $151.0 million, 5.20% of total deposits against a 5.00% limit, $5.8 million over, after moving its card-program settlement float to the bank on September 8. The exception note gives the cause, a plan to sweep $8.0 million to the bank's reciprocal deposit network by October 30, an owner, and the reporting line: the committee on October 20, the Board Risk Committee on November 17. The note also proposes to review the limit itself at the January meeting, separately from curing the breach.
A limit exception drafted with cause, plan, owner and date
How often should ALCO limits be reviewed, and who approves a change?
ALCO limits should be reviewed at least annually and whenever the balance sheet or strategy changes materially, and only the board, or a board committee it delegates to, should approve a change. The advisory puts the board in charge of setting, approving and reviewing every year the strategies, policies, procedures and limits for interest rate risk (who signs the interest rate risk policy). The committee proposes; the board decides.
Two things are not limit changes and should never be treated as one. An assumption change that moves a measure's usage, such as the sample's partner balances' average life, changes the measurement, not the tolerance, and is decided as an assumption with its effect shown. And a temporary tolerance of a breach is a plan, not a new limit. In the sample bank, a change to a board limit opens a new version of the policy that the board must approve before it is used, so the limits page always cites the version it measures against. How often the committee meets to look at all of this is the subject of ALCO meeting frequency.
Checks to run on your ALCO limits once a year
- Place each limit in the OCC peer distribution
Median, quartiles, for your asset size and charter.
- Place each exposure in the same way
A tight limit with low exposure is fine; a loose limit with high exposure is the risk.
- Ask whether any limit would trip if exposure doubled
If none would, the limits are not measuring the bank.
- Count breaches and near misses over two years
A limit breached repeatedly has become routine.
- Cover both earnings and value
NII and EVE at every shock, in the same report.
- Set early-warning and note levels
And show each measure's trend against them.
- Write the change process into the policy
Board approval, version and reason, separate from assumption changes.
Checking every limit every month with ALCO Reporting
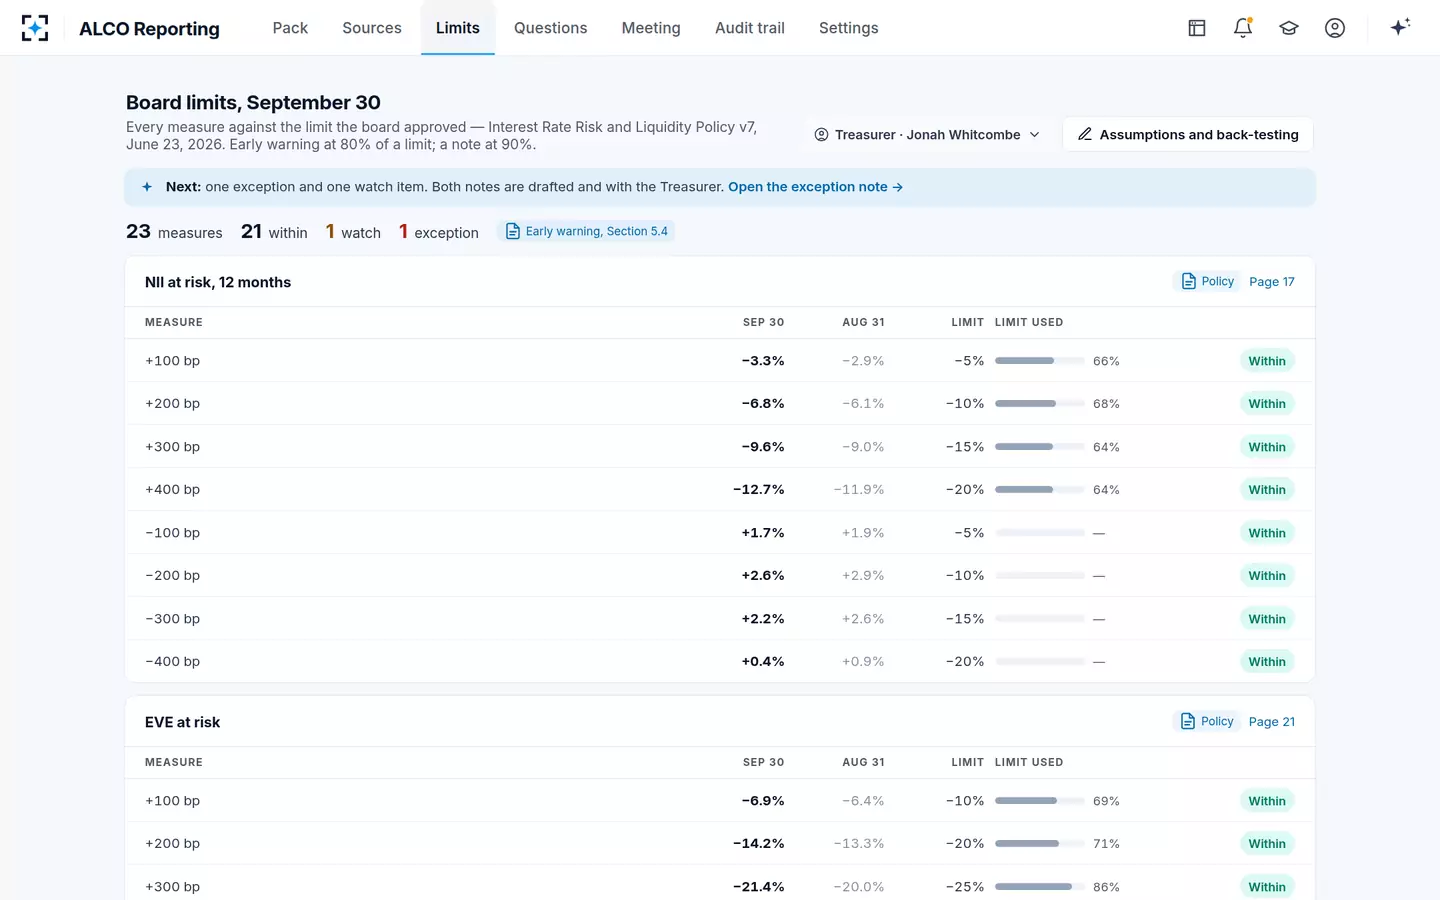
ALCO Reporting compares every measure the board limits, every month, with the share of the limit used and last month's value beside it, against the policy version in force. In the sample, of 23 board limits, 21 were within, one was on watch and one over. The agent that checks limits never changes a limit, never marks an exception resolved and never sends a note a person has not approved; it drafts the watch and exception notes with cause, plan and owner, and the Treasurer decides.
Every board limit with the share used, and August beside September
Questions people ask
Are the OCC's limit statistics a benchmark the OCC expects banks to meet?
No. The OCC publishes them for information and says plainly that they are not limits or exposures it suggests. They come from examination data on 791 OCC-supervised banks, with as-of dates from September 30, 2024 to June 30, 2026, and are best used to place a bank's own limits and exposures in context.
Should ALCO limits be set on parallel shocks only?
Parallel shocks are where the peer data and most policies start, but the advisory also names basis risk and yield curve risk among the scenarios stress testing should include, depending on the bank's profile. A bank with exposure to non-parallel moves should report them, and limit them if they matter to the board's tolerance.
What is the difference between a limit and a risk appetite?
A risk appetite states how much risk the board is willing to take; limits put numbers on it for specific measures. The SVB review showed the gap that opens when a measure is limited but sits outside the risk appetite the full board watches: EVE limits were breached for years without evidence the full board knew.
How many ALCO limits should a community bank have?
Enough to cover earnings and value at every shock the policy runs, plus liquidity, concentration and capital measures the balance sheet needs, and no more than the committee will read every month. The sample bank's 23 fit on two pages of its package.
Do credit unions use the same limits?
Credit unions set NII and net economic value limits in their own board-approved policies under NCUA's Appendix A, and NCUA applies its own NEV Supervisory Test alongside them. The OCC's statistics cover banks and federal savings associations only, so a credit union should use them as context, not as its peer group.