Net interest margin analysis explains why a bank's margin moved by splitting the change into drivers, such as a shift in the deposit mix, a repricing of a funding source, new loans or securities running off, each stated in basis points of the margin, so that the drivers add up to the whole move with nothing left over. The margin itself is net interest income divided by average earning assets. The analysis is hard because the same move can be described many ways and explained in only one: "the margin fell 9 basis points because deposit costs rose" describes, while "−6 bp from $61.0 million moving into money market accounts at 3.15%, −3 bp from a contractual partner rate step" explains, and can be checked. Botminds' ALCO Reporting puts an agent on that bridge for the ALCO package: it traces each driver to its source and will not publish a note whose drivers do not sum to the move.
The worked month comes from a fictional sample bank, Tessaly Community Bank, as it runs through the solution; its balances and partners are sample data. The industry figures are the FDIC's, linked where they appear.
A 9 bp fall in net interest margin, explained by drivers that sum to it
3.30%
−6 bp
−3 bp
+1 bp
−1 bp
3.21%
How is net interest margin calculated?
Net interest margin is net interest income divided by average earning assets, expressed as an annual rate. The FDIC defines it as "The difference between interest and dividends earned on interest-bearing assets and interest paid to depositors and other creditors, expressed as a percentage of average earning assets. No adjustments are made for interest income that is tax exempt" (FDIC, 2026 Risk Review, glossary). Many banks also report a tax-equivalent margin internally, grossing up tax-exempt municipal income; the two should never be mixed in one trend line.
For a month, the arithmetic has one trap. If a month's net interest income is annualized by multiplying by twelve, a 31-day month shows a higher margin than a 30-day month on an identical balance sheet, because interest that accrues daily earns one more day. At a 3.30% margin, one day in thirty is worth about 11 bp, more than the sample bank's whole move. Annualizing by the days in the month (multiplying by 365 and dividing by the days) removes most of the effect; loans that accrue on a 30/360 basis are unaffected either way. Before attributing any monthly move, check that August and September were annualized the same way.
In the sample, September's margin of 3.21% on $3,182 million of average earning assets is about $102.1 million of net interest income at an annual rate, or roughly $8.4 million for the 30-day month, by our arithmetic. Each basis point of margin is therefore worth about $318,000 a year to this bank, which is the conversion a committee needs to hear alongside every driver.
Net interest income vs net interest margin
Net interest income is dollars; net interest margin is the same dollars as a rate on the earning balance sheet. The two usually move together, but not always: a bank that grows its earning assets faster than its net interest income can report more income and a lower margin in the same month. That is why a margin bridge must account for the denominator as well as the numerator.
The FDIC's second-quarter 2026 profile reports the two side by side: "The industry's NIM increased to 3.32 percent, up 1 basis point from the prior quarter and up 6 basis points from the year-ago quarter", while net interest income rose $5.3 billion, or 2.8%, on the quarter. Community banks did better: their NIM "increased to 3.81 percent, up 10 basis points from the prior quarter" (FDIC Quarterly Banking Profile, Q2 2026). In the sample month, earning assets grew $22 million while the margin fell 9 bp: the margin page has to show both.
What affects net interest margin?
Net interest margin is affected by four things: what the bank earns on its assets, what it pays for its funding, the mix of each (above all, how much funding is non-interest-bearing), and the size of the earning base. Behind those sit the market rate path, the shape of the yield curve, competition for deposits, loan demand and the timing of repricing on both sides.
The FDIC's account of 2025 is a clean example of a margin explained by its drivers. "Bank funding costs, which generally reflect short-term market rates, declined from 2.61 percent in 2024 to 2.26 percent in 2025", most of it "driven by a 33-basis point decline in the cost of deposits"; asset yields "declined from 5.83 percent in 2024 to 5.56 percent in 2025, largely reflecting lower loan yields"; and "NIMs widened as the decline in cost of funds outpaced the drop in asset yields", by 8 bp to 3.30% (FDIC, 2026 Risk Review).
The industry's 2025 margin, explained by two drivers that sum exactly
The bars make the point of this whole guide at industry scale. The FDIC's two figures close the bridge exactly: +35 bp from funding and −27 bp from assets sum to the +8 bp move with nothing left over. That is the standard a bank's own margin page should meet every month, one level of detail further down.
How do you analyze net interest margin? Build the bridge
To analyze net interest margin, build a bridge from last period's margin to this period's in five steps, and do not stop until the bridge closes. First, fix the denominator and the day count, so the two margins are comparable. Second, go line by line through the balance sheet and find the lines whose interest moved. Third, attribute each line's change to a cause: a balance change, a rate change, a mix shift between products, or a one-off such as a prepayment fee or a nonaccrual reversal. Fourth, convert each cause to basis points of margin. Fifth, add them up; whatever does not reconcile is a remainder, and a remainder is a finding, not a rounding line.
The conversion in step four is simple arithmetic, and writing it out is what makes a driver checkable. A change in annual interest, divided by average earning assets, is the margin effect.
The margin effect of each driver, worked on the sample month
Deposit mix
$61.0M × 3.15% ÷ $3,182M
$1.92M a year of new interest expense on balances that paid nothing in August: 6.0 bp
Core banking system, deposit migration report
Partner repricing
$412.0M × 0.25% ÷ $3,182M
A contractual step from 3.40% to 3.65% on September 1: 3.2 bp, shown as 3
Program agreements, Schedule B
New loans
Production at 7.05%
Adds about 1 bp
Loan production and runoff
Securities paydowns
$16.0M at 2.40% to cash
Takes about 1 bp; the two asset effects net to zero
Securities activity
What is rate volume analysis, and where it stops?
Rate volume analysis splits the change in each line's interest into a part caused by the change in its balance (volume) and a part caused by the change in its rate, with a third, joint term that has to be allocated to one or the other or shown on its own. It is the examiner's method: the OCC tells examiners to "analyze trends in the bank's volume, rate, and mix variances to determine whether there have been significant changes in the bank's portfolio composition or in its earnings performance that could signal a change in the bank's current or potential IRR profile" (OCC, Interest Rate Risk booklet).
Rate volume analysis is necessary and not sufficient. Run on the sample month, it would show money market interest expense up on volume, non-interest-bearing demand down on volume, and partner deposits up on rate. All true, and none of it says why. The cause of the largest driver is in the core banking system's migration report: 2,912 customers moved $61,004,318 from non-interest-bearing demand into money market accounts, where the weighted rate paid was 3.15%. That is a promotion working, within existing relationships, and it is a decision the committee can revisit. A line-item variance cannot tell the committee that; a driver traced to its source can.
Why did net interest margin decrease? A 9 bp month, worked
In the sample, the margin fell from 3.30% in August to 3.21% in September, and the cost of deposits rose 12 bp to 2.18%, because of two funding decisions, neither of them a surprise. The money market promotion launched on September 1 at 3.15%; the September minutes note the Treasurer reporting it and the chair asking to see what it does to the margin. And the program agreements with the bank's fintech partners carried a contractual year-two rate step on the same date, $412.0 million of balances moving from 3.40% to 3.65%.
“NIM fell 9 bp” against a margin note that explains it
A description: Net interest margin decreased 9 bp to 3.21% due to higher deposit costs.
An explanation: Net interest margin 3.21%, down 9 bp. Two funding drivers explain all of it; asset yields net to zero.
A description: Deposit costs rose.
An explanation: −6 bp: $61.0M moved from non-interest-bearing demand into money market at 3.15%, within the same 2,912 customer relationships.
A description: —
An explanation: −3 bp: the partner agreements' year-two rate took effect September 1, $412.0M from 3.40% to 3.65%.
A description: Loan growth was positive.
An explanation: 0 bp net: new loans at 7.05% added 1 bp; $16.0M of securities paydowns held at the Federal Reserve took 1 bp.
A description: None.
An explanation: Notes sum to −9 bp; unexplained 0.0 bp. Each amount opens its source.
The explanation also tells the committee what happens next, which the description cannot. The partner step is contractual, so its 3 bp does not reverse unless the balances or the terms change. The promotion's 6 bp depends on how long the promotional rate runs and how much of the $61.0 million stays when it ends. Asked on the page how much of the $61 million went into the promotion, the sample bank's answer was $47.2 million, in 1,284 promotional accounts: the number that sets next quarter's margin.
How do you explain NIM compression to the board?
Explain NIM compression to the board in drivers that sum, each with a source, then say which drivers are permanent and which are decisions, and compare the actual margin with what the bank forecast, not only with last month. The last step is the one most often skipped, and the one the 2023 failures made essential.
The Federal Reserve's November 2022 finding on Silicon Valley Bank, quoted in its review, was about exactly that comparison: "SVBFG's interest-rate risk simulations are unreliable." The model had forecast rising net interest income and margin while both were falling (Federal Reserve, SVB review, April 2023; the full finding is quoted in what back-testing checks). A margin bridge that runs only month to month can describe a compression for a year without anyone noticing the model expected expansion.
For a board, three sentences usually do it: what moved and by how much, in drivers that sum; which of those are contractual or market-driven and which the bank chose; and how the margin compares with the forecast and the plan, with the reason for any gap. The six-month trend belongs beside it. The sample bank's margin ran 3.36%, 3.35%, 3.33%, 3.31%, 3.30% and 3.21% from April to September: a slow drift, then one funding-driven step.
What is a good net interest margin for a bank?
There is no single good margin; the useful comparisons are with the bank's own plan, its own history and its peers. For scale, the industry's margin was 3.32% in the second quarter of 2026 and community banks' was 3.81%, and the FDIC reports that "91 percent of banks reported a higher NIM in 2025." A margin well above peers can mean a strong deposit franchise or more credit and rate risk taken for it; one below can mean a liability-sensitive balance sheet in a rising-rate year or a deliberate choice to fund with rate-paying deposits.
The sample bank is liability-sensitive: its own NII page shows rising rates costing earnings and falling rates helping. A falling margin there is the expected direction when funding reprices up, and the board's question is whether the speed matches the assumptions. That is where the margin note hands off to the model's deposit betas; the sample's back-test compared modeled and realized betas, money market at 0.42 against 0.47.
The agent that writes the margin note in ALCO Reporting
In ALCO Reporting, the Change agent writes the margin note, and its rules are the standard above made mechanical. It reads the page as drafted and the same page in last month's package, finds the measures that moved by more than a threshold, traces each move to a source passage, converts each to an amount, and checks that the amounts sum to the move. It never publishes notes whose amounts do not sum, and never explains a move it cannot trace to a source; a remainder shows as unexplained and holds the page for the ALM Analyst.
Each amount in the margin note opens the passage it came from
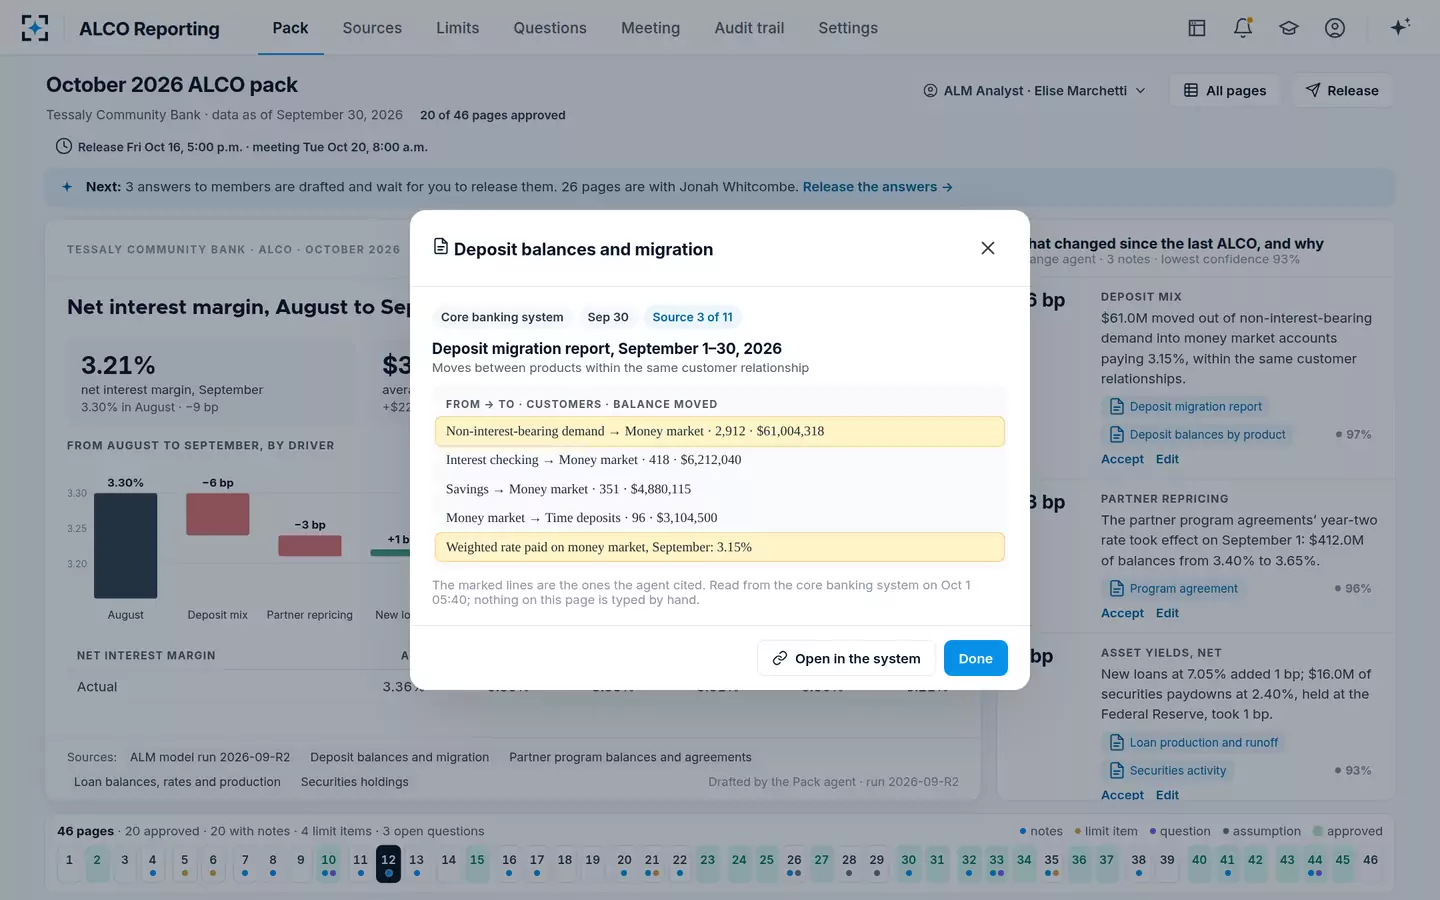
The agent's work is shown on the page, not hidden behind it. Under the notes, the steps it took are listed with the sources each one read, and the check that matters is printed first: notes sum to −9 bp, unexplained 0.0 bp. Its confidence in each note is shown too, and a note below the bank's 85% threshold is held for the analyst before the page is drafted; on this page the lowest was 93%. The ALM Analyst accepts or edits each note with a reason, and the Treasurer approves the page; members see nothing until then. How that fits beside the ALM model, rather than inside it, is the subject of AI in asset liability management.
How the agent in ALCO Reporting worked the margin out, and checked it sums
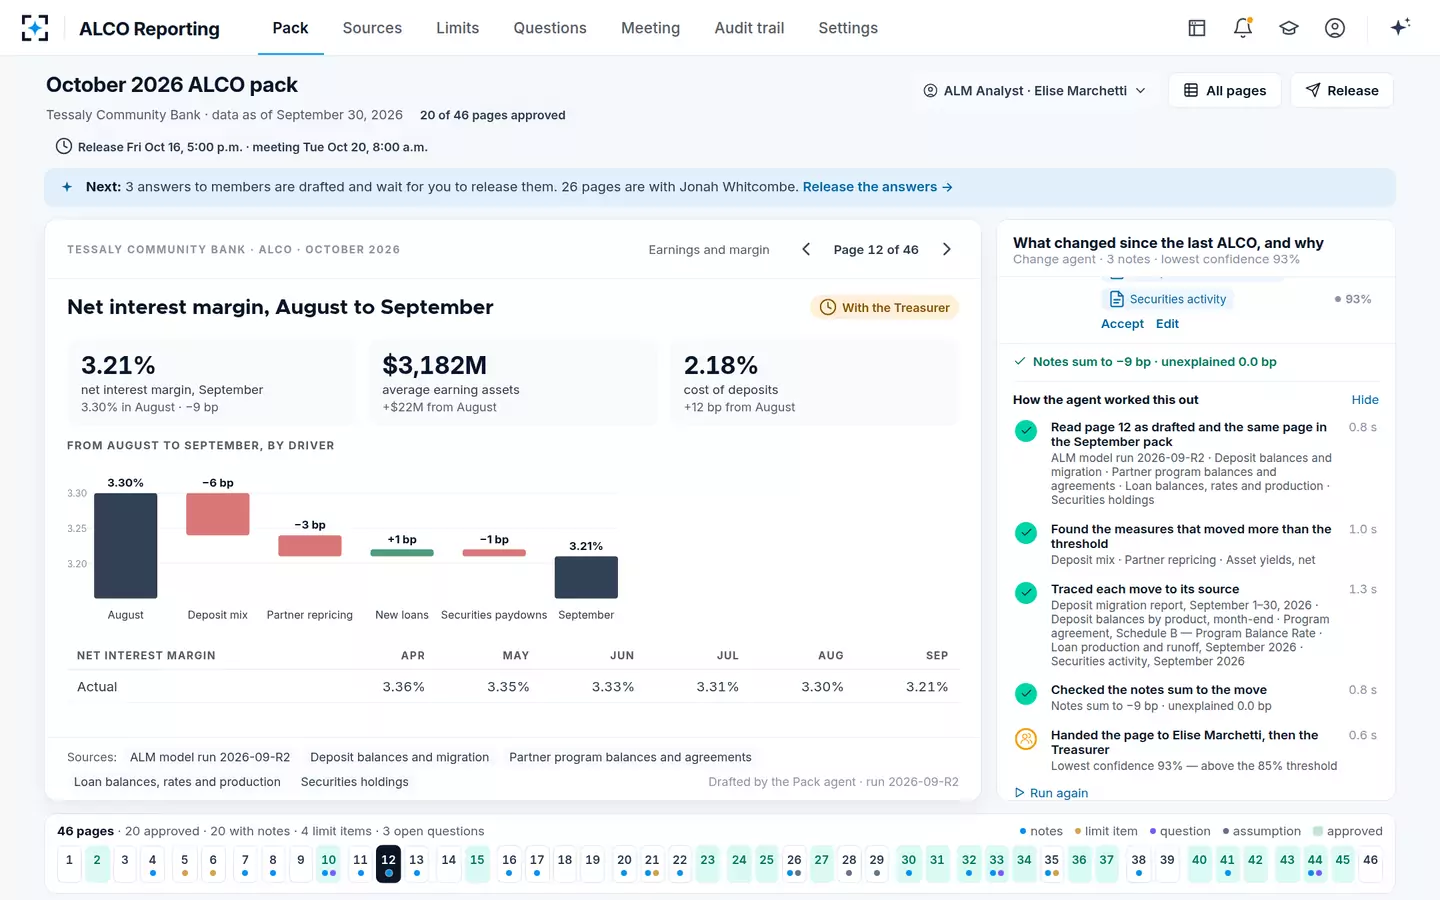
The margin page is one of 46 in the sample package; where it sits, and what the pages around it must tie to, is laid out in the annotated ALCO report sample.
Questions people ask
What is NIM compression?
NIM compression is a fall in net interest margin because funding costs rise faster than asset yields, or asset yields fall faster than funding costs. It is the reverse of what the FDIC described for 2025, when "the decline in cost of funds outpaced the drop in asset yields" and margins widened. Compression is a description; the analysis is which drivers caused it and whether they will persist.
Does net interest margin include fee income?
No. The FDIC's definition counts interest and dividends earned on interest-bearing assets less interest paid to depositors and other creditors, over average earning assets. Loan fees that are deferred and amortized into yield do flow into interest income, which is why a burst of prepayment fees can lift one month's margin and should be shown as a one-off driver.
How often should net interest margin be analyzed?
Monthly for a monthly ALCO package, and over longer windows for trend. The OCC's examination procedures tell examiners to analyze the bank's quarterly margin since the last examination and its annual margin over at least the previous two years, in the context of the rate environment of each period, so a bank should keep both views ready.
Can net interest income rise while net interest margin falls?
Yes, when earning assets grow faster than net interest income. A bank that adds lower-yielding securities or holds more cash at the Federal Reserve can earn more dollars at a lower margin. A margin bridge should therefore show any denominator effect as a driver in its own right.
What is a tax-equivalent net interest margin?
A tax-equivalent margin grosses up tax-exempt interest, usually from municipal securities and loans, to what it would be if taxable, so it can be compared with taxable yields. The FDIC's industry figures make no such adjustment, so a bank comparing its tax-equivalent margin with FDIC aggregates should convert one to the other first.