The FDIC national rates and rate caps are a monthly table of the average rate paid on each standard deposit product, weighted by deposits, and the maximum rate a bank that is not well capitalized may offer on it. The national rate for a product is the average of rates paid by insured banks and credit unions, weighted by each institution's share of domestic deposits. The national rate cap is the higher of the national rate plus 75 basis points, or 120% of the yield on a Treasury of similar maturity plus 75 basis points (the federal funds rate plus 75 for savings, checking and money market accounts). Under 12 CFR 337.7 the cap binds only insured banks and savings associations that are less than well capitalized. For every other bank and credit union, the same table is a free, dated benchmark for a rate sheet. Botminds' Deposit Pricing reads market rates of this kind each day so that a pricing decision is made against the market, not against last week's sheet.
The October 2026 table, annotated: the Treasury leg sets every cap
| Product | National rate | National + 0.75 | Treasury or fed funds | Treasury leg | Rate cap |
|---|---|---|---|---|---|
| Savings | 0.38% | 1.13% | 3.88% (fed funds) | 4.63% | 4.63% |
| Interest checking | 0.07% | 0.82% | 3.88% (fed funds) | 4.63% | 4.63% |
| Money market | 0.63% | 1.38% | 3.88% (fed funds) | 4.63% | 4.63% |
| 3-month CD | 1.14% | 1.89% | 4.20% | 5.79% | 5.79% |
| 6-month CD | 1.39% | 2.14% | 4.33% | 5.95% | 5.95% |
| 12-month CD | 1.76% | 2.51% | 4.54% | 6.20% | 6.20% |
| 24-month CD | 1.55% | 2.30% | 4.88% | 6.61% | 6.61% |
| 36-month CD | 1.39% | 2.14% | 5.00% | 6.75% | 6.75% |
| 60-month CD | 1.41% | 2.16% | 5.09% | 6.86% | 6.86% |
What are the FDIC national rates?
The FDIC national rates are averages of what insured institutions pay on standard deposit products, published once a month. The regulation defines the national rate as "the weighted average of rates paid by all insured depository institutions and credit unions on a given deposit product, for which data are available, where the weights are each institution's market share of domestic deposits" (12 CFR 337.7(a)(1)). The products are savings, interest checking, money market accounts and certificates of 1, 3, 6, 12, 24, 36, 48 and 60 months.
Three details shape what the numbers mean. The FDIC publishes them every third Monday, using rates and yields from the last business day of the prior month, so the October table describes the end of September. Savings and interest checking rates are those for a $2,500 balance; money market and certificate rates average the $10,000 and $100,000 tiers. And the method changed on April 1, 2021: earlier figures were weighted by branch and excluded credit unions, so a series that runs across 2021 joins two different averages (FDIC, National Rates and Rate Caps).
How is the FDIC national rate cap calculated?
The FDIC national rate cap is calculated as the higher of two legs. For a certificate, the regulation's text is the higher of the "National rate plus 75 basis points, or" "120 percent of the current yield on similar maturity U.S. Treasury obligations plus 75 basis points"; for a non-maturity deposit the second leg is "the federal funds rate plus 75 basis points" (12 CFR 337.7(a)(2)).
Worked on the twelve-month certificate for October 2026: the national-rate leg is 1.76% + 0.75 = 2.51%; the Treasury leg is 120% × 4.54% + 0.75 = 6.20%; the cap is the higher, 6.20%. For savings, the national-rate leg is 0.38% + 0.75 = 1.13% and the fed funds leg 3.88% + 0.75 = 4.63%, so the cap is 4.63%. A product whose term the FDIC does not publish, such as a 26-month certificate, uses the next lower published term, here the 24-month row.
When rates fall, the rule softens the step: for an institution that is less than well capitalized, "a national rate cap that is lower than the previously published national rate cap will take effect 3 days after publication", and the FDIC may delay a large decrease further (12 CFR 337.7(b)(2) and (f)).
What is the national rate on a 12-month CD, and why it sits so low
The national rate on a 12-month CD was 1.76% in October 2026, and it has moved within a narrow range for three years while market yields swung widely. Since mid-2023 it has stayed between 1.5% and 1.9%, while the 12-month Treasury yield the FDIC publishes alongside it ranged from 5.46% in October 2023 to 3.48% in early 2026 and back to 4.54%.
The national rate barely moves; the Treasury yield, and so the cap, does
The rate sits low because of how it is weighted. Each institution counts in proportion to its deposits, so the institutions with the most deposits set the average, and research finds that they pay less. A study by d'Avernas, Eisfeldt, Huang, Stanton and Wallace concludes that "Large banks offer superior liquidity services but lower deposit rates" (NBER working paper 31865), and New York Fed researchers found in 2024 that "For the largest banks, betas have been going up at a slower pace than those of other banks" (Liberty Street Economics, March 2024). The national rate therefore describes what the average deposit dollar earns, not what a depositor shopping for a certificate is offered. Can you negotiate CD rates with banks uses the same table from the depositor's side.
Since April 2021 the national-rate leg has set a cap in no more than 9 of 68 months, all in 2021
Who is subject to the national rate cap?
The national rate cap applies to FDIC-insured banks and savings associations that are not well capitalized. The rule says such an institution may not "Solicit deposits by offering a rate of interest that exceeds the applicable rate cap", nor, where it has accepted brokered deposits under a waiver, pay above the cap on them when accepted (12 CFR 337.7(c)(2)). "Insured depository institution" in federal banking law means "any bank or savings association the deposits of which are insured by the Corporation" (12 U.S.C. 1813(c)(2)), so federally insured credit unions are not covered by this FDIC rule, although their rates are in the national average.
The cap exists to stop a weak bank from buying its way out of trouble with deposits. The OCC's interest rate risk booklet describes the purpose: the restrictions prevent a bank that is not well capitalized "from circumventing the prohibition on brokered deposits by offering rates significantly above market in order to attract a large volume of deposits quickly" (OCC, Comptroller's Handbook, Interest Rate Risk, 2020).
Which banks the cap binds, and which cap applies
Is it an FDIC-insured bank or savings association?
If not, as with a federally insured credit union, 12 CFR 337.7 does not apply. Its rates still count in the national average.
Is it well capitalized?
If yes, it “may pay interest without restriction by this section”. The table is a benchmark only.
If not: the national rate cap
It may not solicit deposits above the published cap for the product and term, or the next lower published term.
Or the local market rate cap, by notice
For deposits gathered in its local market, 90% of the highest local rate, after notice and evidence to the FDIC regional director, updated monthly.
Adequately capitalized and taking brokered deposits?
Only with an FDIC waiver, and then at no more than the applicable cap when accepted. An undercapitalized bank may not accept them at all.
Does the rate cap apply to well capitalized banks?
No. The rule is explicit: "A well capitalized institution may pay interest without restriction by this section" (12 CFR 337.7(c)(1)). A well capitalized bank can pay any rate its pricing policy allows, including above the cap.
The cap still matters to a well capitalized bank in two ways. A bank whose capital could fall below well capitalized needs to know which of its products are priced above the cap today, because those prices would have to come down, and a rate sheet that relies on above-cap certificates to fund growth would lose that tool exactly when it was needed. And for a non-maturity account, the rule treats more than the opening of a new account as solicitation: raising the rate on an account that existed when the bank was last well capitalized, or crediting funds for a new depositor to such an account, both count (12 CFR 337.7(g)(1)). A pricing system that can show every rate against the current cap answers the first question in seconds.
What is the local market rate cap, and the evidence it needs
The local market rate cap is the alternative to the national cap for deposits a bank gathers in its own market: "Ninety (90) percent of the highest interest rate paid on a particular deposit product in the institution's local market area", based on rates offered by banks or credit unions with a physical location there (12 CFR 337.7(a)(3)). A local market area can be a state, county or metropolitan statistical area.
It is not automatic. A bank that wants to use it must give the FDIC regional director notice and evidence of the highest local rate for the product, update the evidence and calculations for existing and new accounts monthly, and keep that information for at least the two most recent examination cycles (12 CFR 337.7(d)). That is a documentation obligation more than a pricing one: a bank relying on the local cap needs a dated file of local competitors' rates each month, product by product, which is exactly the kind of evidence a pricing exception file should be able to hold.
How brokered deposits relate to rate caps
Brokered deposits and rate caps are two halves of the same statute. "An adequately capitalized insured depository institution may not accept, renew, or roll over any brokered deposit unless it has applied for and been granted a waiver", and an undercapitalized one may not accept them at all (12 CFR 337.6(b)). A bank that accepts brokered deposits under a waiver may not pay more than the applicable rate cap at the time the deposit is accepted (12 CFR 337.7(c)(2)). The rate cap closes the route around the brokered deposit restriction: paying far above market to attract the same money directly.
The brokered deposit rules themselves have moved twice recently. In March 2025 the FDIC withdrew its 2024 proposal to tighten the brokered deposit framework, saying that "If the FDIC decides to pursue future regulatory action in any of these areas, it will issue a new proposed rule" (90 FR 12115, March 14, 2025). And an interim final rule effective September 1, 2026 conformed the FDIC's regulations to changes to the reciprocal deposit provisions made by the 21st Century ROAD to Housing Act, which took effect on July 11, 2026 (91 FR 56022). Neither changed the rate cap formula.
Using the FDIC table as a benchmark for a rate sheet
Any bank or credit union can use the FDIC table as a free benchmark, as long as it reads it for what it is. The national rate shows how far a posted rate sits from the deposit-weighted average; the Treasury column gives a same-maturity market yield each month; the cap column says what a less than well capitalized bank could pay. None of them is a competitor's offer, and none is the institution's own marginal cost of funds.
Reading the FDIC table against a rate sheet: six checks
- Distance from the national rate, by product
A posted rate far above it is buying deposits; far below it, or below money market funds, is relying on depositors not looking.
- Distance from the same-maturity Treasury yield
The FDIC prints it in the table. A certificate priced well under it is cheap funding while depositors stay, and fragile when they compare.
- Every rate against the cap
Essential below well capitalized, prudent above it: know which products would have to be repriced if capital fell.
- The date of the data
The table describes the last business day of the prior month; in a moving market it is a month old on the day it appears.
- The tier
Certificate rates average the $10,000 and $100,000 tiers. A jumbo rate sheet needs its own comparison.
- What the table is not
Not a competitor’s offer and not a funding cost. Price exceptions against same-term funding, not the national rate.
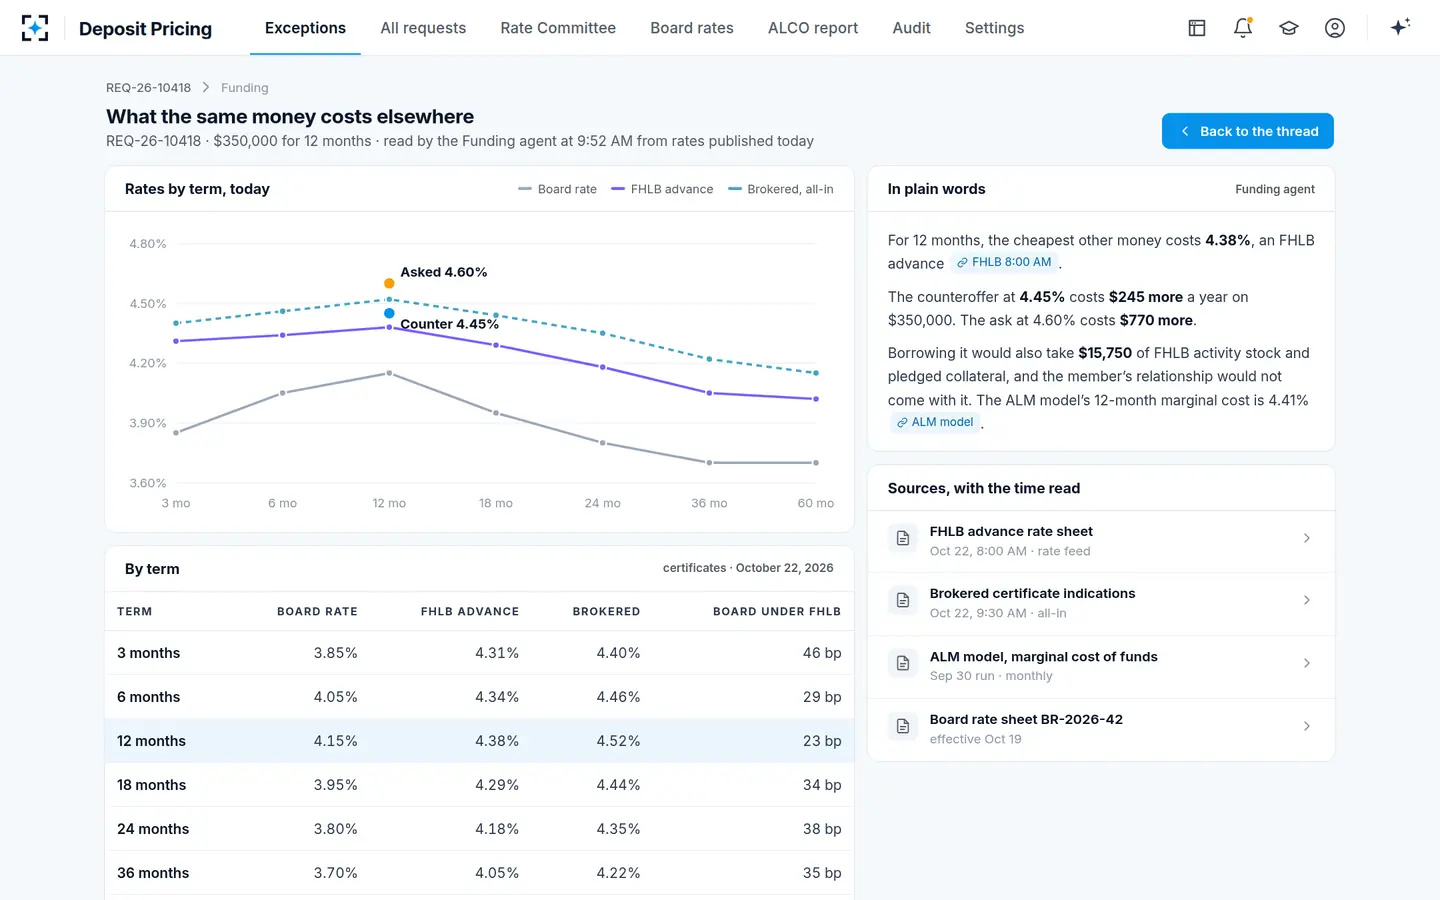
The sample credit union in Deposit Pricing, Norrell Federal Credit Union, a fictional $6.8 billion credit union, is outside the FDIC rule because it is a credit union, and its rate sheet reads the market differently: each certificate's posted rate beside the same-term FHLB advance, the month's exception count, and the median of its weekly rate survey. On October 22, 2026 its twelve-month certificate was posted at 4.15%, far above the national rate of 1.76% and below the 4.38% FHLB advance of the same term.
A rate sheet read against same-term funding, with a board-rate proposal drafted from exceptions
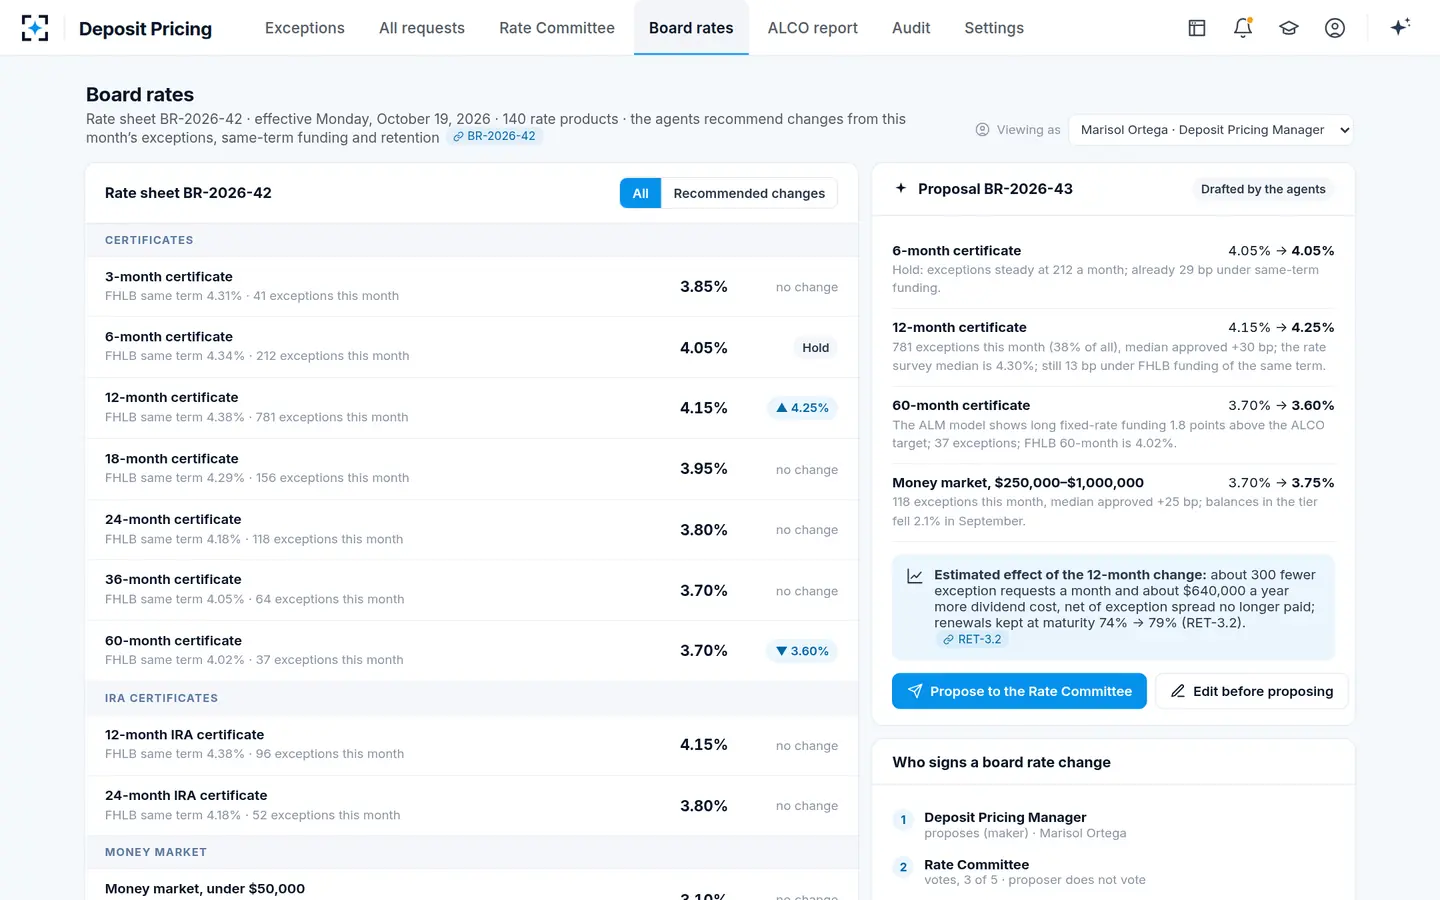
The comparison that decides a price is the one on that screen: the posted rate against the same term of other money, and the exception count as the signal that the posted rate no longer holds. The FDIC table adds the outside view. Used together they answer the rate committee's two questions, whether the rate sheet is in the market and whether it is cheaper than the alternatives, and the marginal cost of funds turns the second into a number. To see a rate sheet read against funding and exceptions, start from Deposit Pricing.
The same-term funding the rate sheet is read against, with the time of every rate
Questions people ask
How often does the FDIC publish national rates?
Monthly, on the third Monday, or the next business day if that Monday is a federal holiday. The rates and yields are those available on the last business day of the prior month; the October 2026 table, published October 19, reflects the end of September.
Where does the FDIC get the rate data?
The FDIC's page says the rates come from a commercial data provider, with the calculations the FDIC's own. The products and terms published are those most commonly offered by the institutions for which data are available.
Does the national rate cap apply to credit unions?
No. The cap in 12 CFR 337.7 applies to insured depository institutions as federal banking law defines them, banks and savings associations insured by the FDIC. Credit unions' rates are included in the national rate average, but the cap does not bind them.
What happens to deposits already on the books if a bank falls below well capitalized?
The cap restricts soliciting deposits above it and, for brokered deposits accepted under a waiver, paying above it when they are accepted. For non-maturity accounts the rule spells out what counts as soliciting: opening an account, raising the rate on an account that existed when the bank was last well capitalized, or crediting a new depositor's funds to one.
Why was the national rate for 12-month CDs only 0.14% in 2021?
Because market rates were near zero: the 12-month Treasury yield the FDIC published was under 0.1% for most of 2021. In those months the national-rate leg, 0.14% plus 0.75, set the 12-month cap at 0.89%; from November 2021 the rising Treasury yield took over.