A counterparty risk dashboard shows, for every bank and broker a firm trades with, how much it is exposed, against what limit, how the counterparty itself is doing and what has changed since the last review, so that the people who approve ratings and limits see trouble before the market prices it. Building one is a data problem more than a display problem: exposure lives in the risk engine and the custodian, limits in the credit policy and the limit system, the counterparty's condition in its own filings and its regulator's public data, and the warning signs in news and notices in a dozen languages. Botminds' Counterparty Risk Management reads the filings and the signals, proposes ratings and limits from them, and puts them beside the exposure the risk engine already calculates, with a credit officer deciding.
What bank supervisors expect of counterparty reporting
Daily
counterparty-level current and potential exposure, from the previous day's positions and collateral
1month
at most between senior management reviews of counterparty reports
3weeks
the oldest the data in those monthly reports should be
Top 20
largest exposures assessed under each primary metric, as an example
What should a counterparty risk dashboard show?
A counterparty risk dashboard should show exposure against limits, the largest and the weakest counterparties, how both are changing, and what needs a decision today. The interagency counterparty guidance lists what institutions generally report: total counterparty risk, "Counterparties with the largest exposures, along with detail on their exposure amounts", significant concentrations, exposure to weak counterparties, how exposure has grown and a written account of what drives it (Interagency Supervisory Guidance). Senior management "should review CCR reports at least monthly, with data that are no more than three weeks old".
The Basel Committee's 2024 guidelines add the decision layer. Reporting should include "the key CCR exposure metrics used at both a single name and portfolio level of aggregation; the evolution of CCR exposure over time; top CCRs; relevant limits, breaches and other flagged risks (such as concerning or potentially distressed counterparties or industries)" (BCBS, CRI40.101). A dashboard that shows utilisation bars and nothing else meets the first half of that sentence.
The counterparty risk dashboard stack: four layers, four kinds of source
4
Decisions
Ratings, limits, excess cures and off-cycle reviews, each signed with a reason
Comes fromCredit officers and the CRO
RefreshAs needed
3
Signals
News, regulator notices, rating actions, bond spreads and equity moves, in the language published
Comes fromNews and regulator feeds, market data, ratings feeds
RefreshDaily or intraday
2
Counterparty condition
Capital, liquidity, asset quality and their trend, from the counterparty's own filings
Comes fromAnnual reports, Pillar 3 data, Call Reports, CFTC FCM data, broker statements
RefreshMonthly to yearly
1
Exposure and limits
Current and potential exposure by fund and product, against limits and legal caps
Comes fromRisk engine, order management, custodian, collateral system, limit system
RefreshDaily, ideally intraday
Layer 1: exposure, from the systems that already compute it
Exposure belongs to the systems that already compute it, and a dashboard should read it, not recompute it. The interagency guidance says "Counterparty-level current exposure and potential exposure should be calculated daily, based on the previous day's position data and any exchange of collateral", and that management "should be able to view the various forms of exposures to a given counterparty in a single report and/or system" (Interagency guidance). Basel asks that exposures be monitored against limits "at least on a daily basis" and encourages intraday monitoring (CRI40.114).
For an asset manager the inputs are scattered: OTC derivatives in the risk engine, repo and securities lending in the custodian or lending agent's records, cash at banks in treasury, collateral in the collateral system. The dashboard's first job is to put them under one legal entity per counterparty, using a stable identifier such as the LEI, and per fund, because a UCITS fund's legal cap is tested fund by fund. Valuing the trades and calculating potential exposure stays in the risk engine.
Layer 2: limits, and who is allowed to change them
Limits on a dashboard are only as good as the governance behind them: who set them, on what rating, and who may change them. Basel is blunt: the business may not set or verify its own limits, and an exception needs an independent risk function's approval, with an audit trail (CRI40.108, 40.109; quoted in counterparty credit risk and AI). A dashboard that lets a desk head edit a limit cell is a liability.
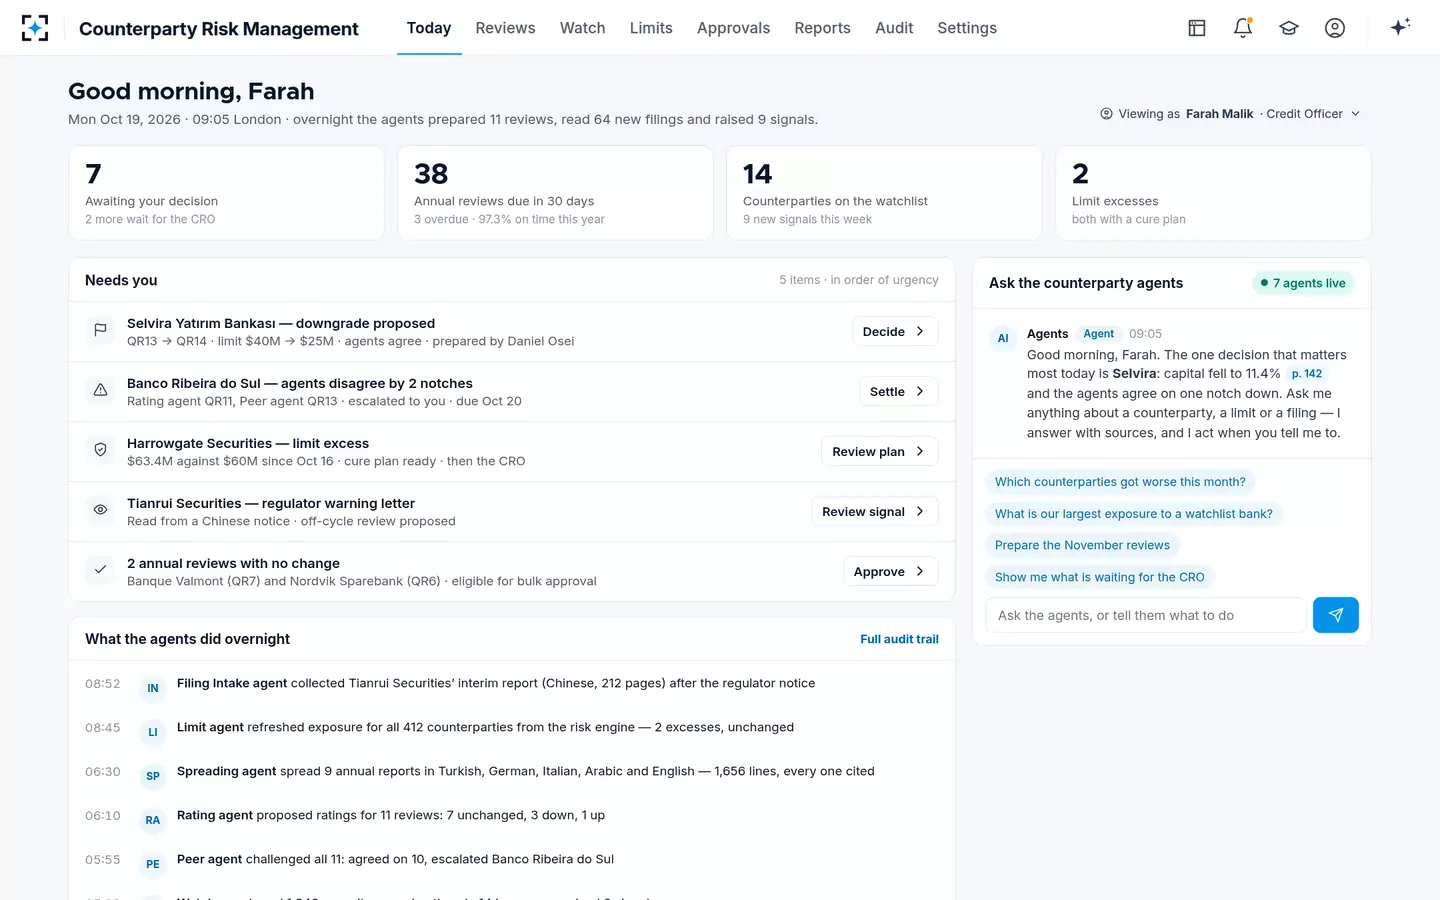
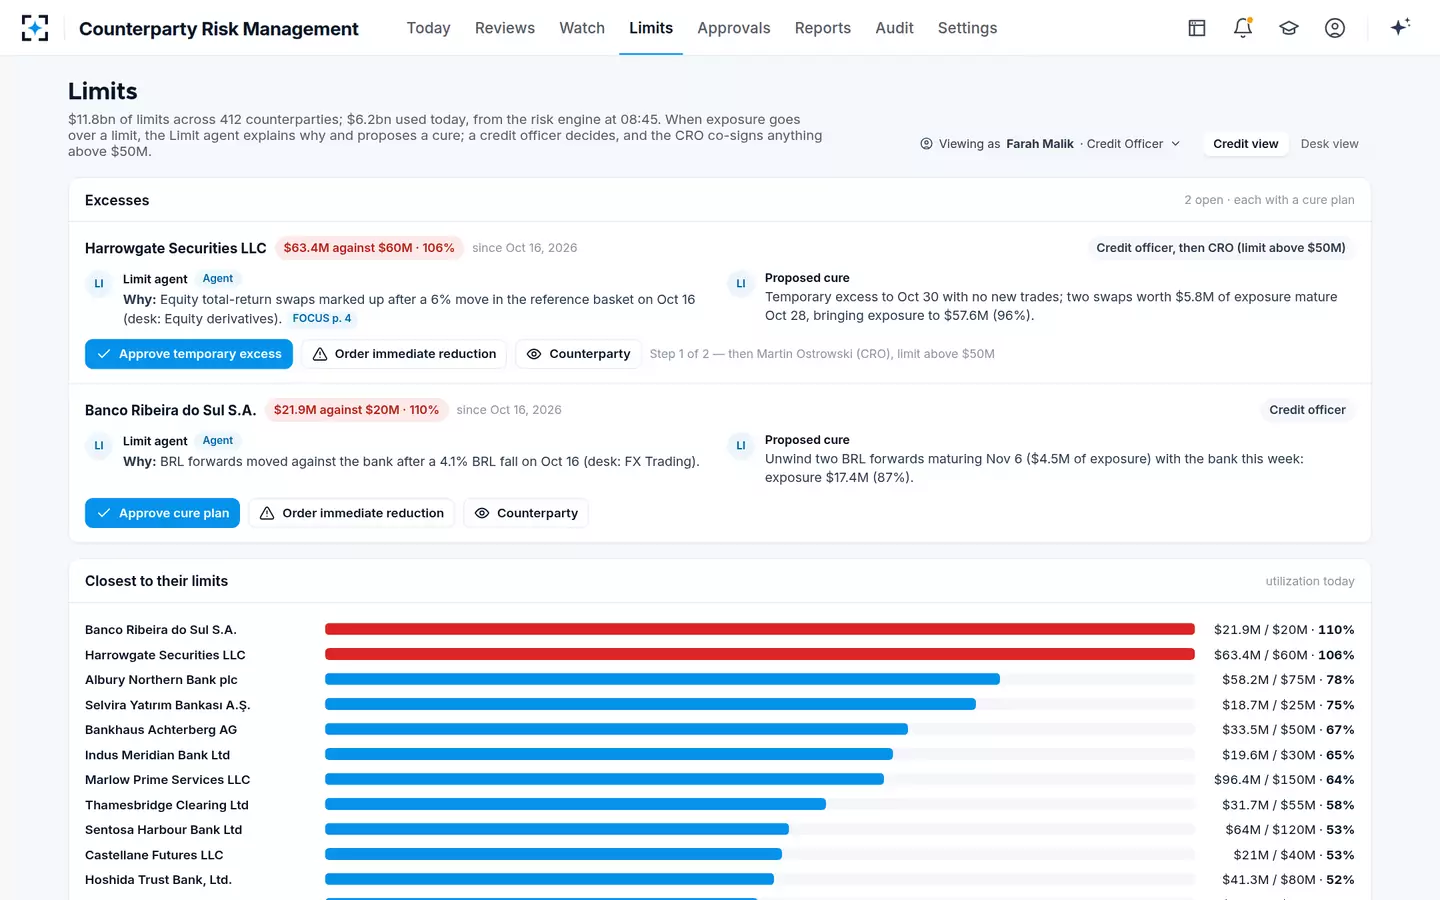
Take a fictional sample asset manager, Quillfield Capital, as it runs through Counterparty Risk Management. It holds $11.8bn of limits across 412 counterparties, $6.2bn of them used on the morning shown, refreshed from the risk engine at 08:45. Two limits were in excess, both passive, both with a cure plan; the trading desks see limits and headroom but no role, including the CRO, can set a limit directly. Limits change only through a signed approval.
The credit officer's morning: decisions, reviews due, the watchlist and excesses on one screen
What public data exists on bank capital?
More public data on bank capital exists than most counterparty dashboards use. For EU and EEA banks, the European Banking Authority's Pillar 3 data hub went live in January 2026, putting every EEA institution's prudential disclosures on one public, harmonised platform for the first time (what it holds, bank by bank), with a visualisation tool, bulk downloads and a planned "dynamic dashboard of key indicators" (EBA). For US banks, every national bank, state member bank and insured nonmember bank files a Call Report "as of the close of business on the last day of each calendar quarter", and individual banks' data are "typically made available approximately 6 hours after submission" in the FFIEC's public repository (FFIEC Central Data Repository).
The same repository publishes the Uniform Bank Performance Report, which "compares the performance of a given bank both against itself over time and against the performance of a group of peer banks", with peer averages and percentile rankings. For a US bank counterparty that is a ready-made peer view of capital, liquidity and asset quality. Outside the EU and US, the bank's own annual report and its home regulator's disclosure rules decide what exists, and it may be in the home language only; how to read those is covered in counterparty due diligence on a bank's own filings.
The public data a counterparty dashboard can join, and how fresh it is
| Source | Covers | Key figures for a dashboard | Freshness |
|---|---|---|---|
| EBA Pillar 3 data hub | EU and EEA banks | Prudential disclosures in harmonised templates, starting with key metrics and risk-weighted exposure amounts | Quarterly, half-yearly or yearly by bank |
| FFIEC Call Reports and UBPR | US insured banks | Balance sheet, income, past-due loans; UBPR ratios against peer groups | Quarter-end; individual banks about 6 hours after submission; bulk files from 45 days |
| CFTC Financial Data for FCMs | US futures commission merchants | Adjusted net capital, net capital requirement, excess net capital, customer segregation | Monthly; filed within 17 business days, posted generally within 12 more |
| Broker-dealer annual statement | US broker-dealers | Audited statement of financial condition with net capital and required net capital | Yearly within 105 days; unaudited half-year within 65 days |
| Annual and interim reports | Every bank and broker | Full statements, notes, restatements, management commentary | Yearly and half-yearly, often in the home language |
Where do FCM capital figures come from?
FCM capital figures come from the monthly financial reports futures commission merchants file with the CFTC, which the CFTC summarises on its website. FCMs "must file monthly financial reports with the CFTC's Market Participants Division (MPD) within 17 business days after the end of the month", and the most recent month-end data "generally is added within 12 business days after FCMs and RFEDs file their reports" (CFTC, Financial Data for FCMs).
The fields are the ones a limit on a clearing broker needs. Adjusted net capital "is the amount of regulatory capital available to meet the FCM's minimum net capital requirement", and excess net capital "is the amount by which the adjusted net capital exceeds the net capital requirement" (CFTC field descriptions). One caution for anyone storing the series: "Once posted, the CFTC does not revise this information to reflect any amended financial information subsequently received", so a dashboard should keep the as-of date beside each figure and note when the firm itself has restated.
How do you monitor counterparties between reviews?
Counterparties are monitored between reviews by watching the signals that arrive every day, deciding which matter, and turning the important ones into an action: a watch, an off-cycle review or a hold on limit increases. Basel describes the tool: banks "may set early warning indicators when limit utilisations increase significantly or are elevated but do not yet result in limit breaches" (CRI40.117), and should keep a watch list of names on which only restricted or risk-reducing trades are allowed (CRI40.133).
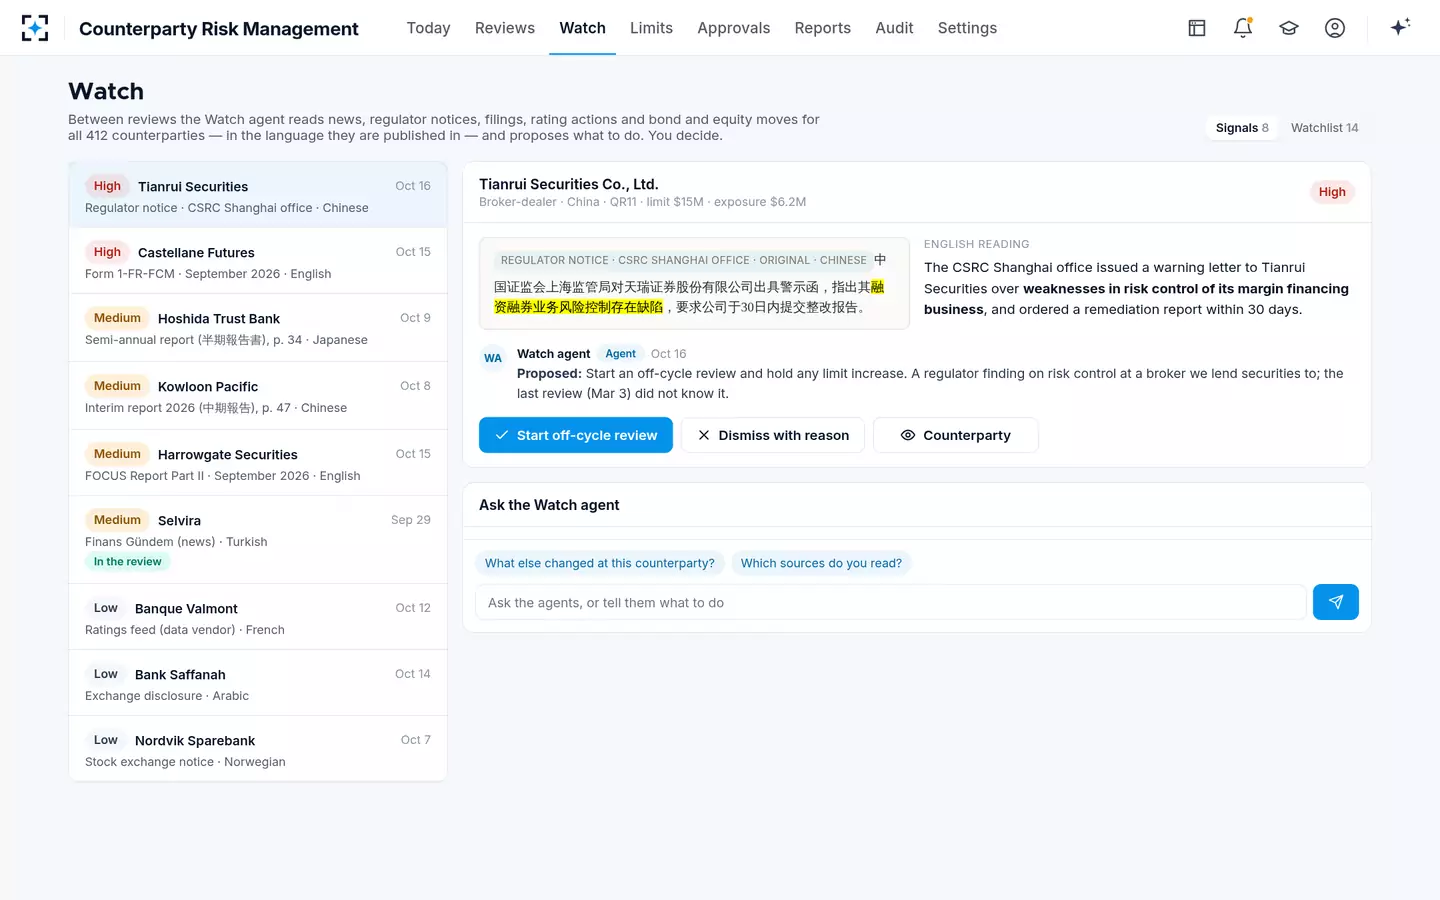
The signals that matter for a bank counterparty are rarely in English when they matter most: a local regulator's notice, a domestic news item, a postponed bond issue, an interim report filed in the home language. In the sample, the Watch agent read the overnight news and notices for all 412 counterparties and proposed an off-cycle review of a Chinese broker after a regulator's warning letter on its margin-financing controls. It cannot change a rating or a limit; a credit officer accepts or dismisses each proposal with a reason.
Watch signals between reviews, in the language they were published
One bank through the four layers: a worked morning
The stack is easiest to judge on one name. In the sample, the Istanbul bank Selvira Yatırım Bankası came up for its annual review in October; here is what each layer contributed to one decision, and where each figure came from. A dashboard that shows only the first two rows would have shown a bank comfortably inside its limit.
One counterparty decision, layer by layer
| Layer | What it showed | Where it came from |
|---|---|---|
| 1. Exposure | $18.7M across four funds: $8.4M and $2.9M in two US funds, $6.1M and $1.3M in two UCITS funds at 0.43% and 0.01% of assets | The risk engine, refreshed for all 412 counterparties at 08:45 |
| 2. Limits | Limit $40M at QR13; utilisation under half; the grid at QR14 would be $25M, below a capital test of $32.2M | The firm's limit grid and capital test, as settings |
| 3. Condition | CET1 ratio 13.1% to 11.4% as risk-weighted assets grew 25%; LCR 168% to 142%; NSFR 121% to 114%; prior-year NPL ratio restated 2.2% to 2.4% | The bank's Turkish annual report, pages 97, 142, 143, 151 and 152 |
| 4. Signals | A $500M Eurobond issue postponed; the USD 2029 bond spread wider by 86 bps at 498 | A Turkish news item and market data, after the report date |
| Decision | QR13 to QR14, limit $40M to $25M, next review in six months; the FX desk told with $6.3M of headroom | Credit officer's signature with reason APR-01; no CRO step below $50M |
The order in which the layers were read is the argument for joining them. Exposure was well inside the limit. The bank's own figures showed it growing faster than its capital, the signals showed the market noticing, and only then did the limit move. Read the other way, from utilisation up, nothing would have triggered a look until the exposure grew or the bank failed.
Why most counterparty dashboards stop at exposure
Most counterparty dashboards stop at exposure against limits because those two layers already sit in structured systems, while the counterparty's condition sits in documents. Exposure and limits can be wired once; capital ratios, restatements and regulator notices have to be read, reconciled and reviewed every period, often in several languages. The result is a screen that shows utilisation precisely and the counterparty's own health not at all.
Supervisors have named the cost. The Federal Reserve warned that "poor communication frameworks and inadequate risk management functions, as well as fragmented systems and ineffective governance, hamper their ability to identify and address risk" (SR 21-19). Basel tells banks to "discourage fragmented reporting environments for CCR" and to redesign them "without delay" if they are too fragmented, and to keep an MIS "that does not overwhelm users with data" (CRI40.104, 40.126). A dashboard with every metric and no decision on it fails the second test as surely as one with too few fails the first.
Limits with their cause, cure and approval route, beside utilisation for every counterparty
Counterparty risk dashboard or counterparty risk system: what to ask before you buy
Before buying a counterparty risk dashboard, ask which of the four layers it fills itself, which it expects you to feed, and who may change what it shows. A product may be a reporting layer over the risk engine, a credit-data feed with standardised bank fields, or a workflow for reviews and approvals. Each is useful; none of them alone is the whole stack.
Questions for any counterparty risk dashboard or system, before the demonstration
- Where does the counterparty's capital figure come from, and can I open the page?
A ratio without a source document is a vendor's number. Ask to click through to the filing.
- Which languages can it read in the original?
If the answer is English plus translated summaries, the banks that need the closest review get the thinnest.
- Does it compute exposure, or read it from my risk engine?
Two exposure engines will disagree. Prefer one, with the dashboard reading it.
- Who can change a limit, and is that logged?
Basel: limits set and verified independently of the business, exceptions approved by an independent risk function, with an audit trail.
- How does a signal become a decision?
A news alert nobody actions is noise. Look for a proposed action, an owner and a reason when it is dismissed.
- Are passive breaches treated like active ones?
A market move can push exposure over a limit with no new trade; Basel says such passive breaches need the same review and challenge.
- Can internal audit re-perform a rating from what it stores?
Who decided, when, on which figures from which pages, under which policy version.
- What do I have to keep feeding it?
If every filing must be keyed in by your analysts, the dashboard has moved the retyping, not removed it.
Where Counterparty Risk Management fits: it fills layers 2 to 4. The agents collect and read the filings, propose ratings and limits from the firm's scorecard and grid, challenge them against peers, watch for signals and draft the monthly report, and people sign. Where it does not: it does not value trades or calculate potential exposure, and it does not replace the limit system or the order management system's pre-trade check; it reads exposure from the risk engine and writes signed ratings and limits back. The inputs a firm brings to switch it on are listed in what you bring to a counterparty risk system, and the measures a risk committee should see from it in counterparty credit risk metrics.
Questions people ask
How often should counterparty exposure be refreshed?
At least daily. The interagency guidance expects counterparty-level current and potential exposure to be calculated daily from the previous day's positions and collateral, and Basel's 2024 guidelines ask for monitoring against limits at least daily with intraday monitoring where feasible. The counterparty's own condition refreshes as its filings do, monthly to yearly.
What is the difference between a counterparty dashboard and a limit system?
A limit system holds the approved limits and blocks or flags trades that would breach them. A dashboard shows exposure, limits, the counterparty's condition and signals together for the people who set those limits. The limit system enforces a decision; the dashboard informs the next one.
What is a counterparty watch list?
A list of counterparties under closer monitoring, usually with restricted or risk-reducing activity only and a shorter review cycle. Basel's guidelines ask independent credit officers to maintain one. In the sample, watchlist names are reviewed every six months instead of every twelve.
Can a counterparty dashboard use rating agency ratings?
Yes, as a signal and a cross-check, but not as the internal rating itself. Basel's guidelines expect banks to analyse counterparties themselves and warn against granting credit because a counterparty is perceived to be highly reputable. A rating action is a reason to look, not the review.
Do US broker-dealers publish capital figures monthly?
No. Their monthly and quarterly FOCUS reports are confidential filings with the SEC. The public figures are the audited statement of financial condition with its net capital footnote, yearly, and an unaudited statement six months later. Futures commission merchants are different: the CFTC posts their capital figures every month.