Bank credit analysis is the review of a bank's capital, liquidity, asset quality, profitability and funding to judge whether it will meet its obligations, and for a counterparty team it ends in an internal rating and a limit. It starts with spreading: copying a few hundred figures from the bank's annual report and regulatory disclosures into a standard template, two years side by side. When agents do the spreading, the question every credit officer and model validator asks is how accurate it is. The honest answer is that accuracy has to be measured per line, weighted by what each line does to the rating, and checked against the page of the filing it came from. Botminds' Counterparty Risk Management spreads each bank's filings in their own language into the firm's template with every figure cited to its page, and flags restatements and reclassifications for the analyst instead of resolving them itself.
One bank spread in the sample, by the numbers
184lines
in the firm's spreading template, two years side by side
24lines
marked as key lines, the ones the scorecard reads
3lines
flagged for the analyst, among them one restatement
184/184
lines cited to a page of the filing: the design target is every line
What is bank credit analysis? Five drivers and the evidence behind each
Bank credit analysis judges a bank's ability to pay from five families of evidence: capital, liquidity and funding, asset quality, profitability and market signals, read over at least two years and against peers. US occupational data describes two tasks: reading a firm's credit data and financial statements to judge how risky it is to lend to it, and comparing its liquidity, profitability and credit history with similar firms in the same industry and region (O*NET OnLine, Credit Analysts). Bank counterparty work is the second task done on banks, with regulatory capital and funding added.
For a counterparty review the output is narrower than for a bond investor: one notch on an internal scale and the limit that goes with it. That narrowness is what makes accuracy measurable. Each figure either feeds a driver or it does not, and the drivers carry weights the firm wrote down in advance.
What is financial spreading, and why does it decide the analysis?
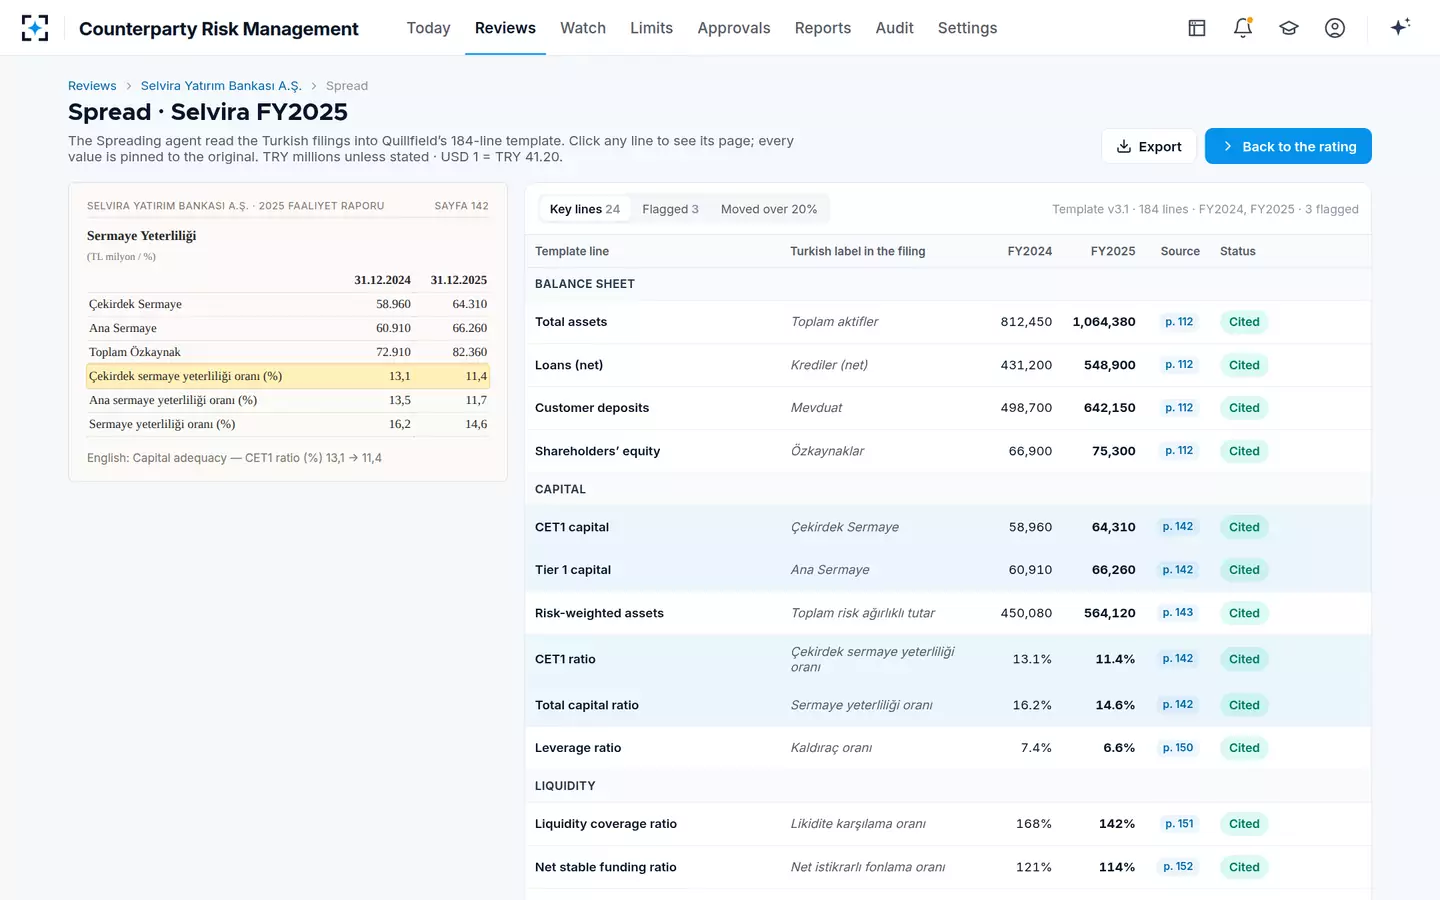
Financial spreading is the step that turns a bank's own statements into the firm's standard lines: total assets, loans, deposits, equity, capital measures, risk-weighted assets, capital and liquidity ratios, non-performing loans, income lines, each in the same place for every bank and every year. It decides the analysis because every later step reads the spread, not the filing. A wrong figure in the spread becomes a wrong driver, a wrong score and, sometimes, a wrong notch, and nothing downstream looks back at the page.
Supervisors put the requirement in terms of verification, not accuracy rates. The Basel Committee's 2024 guidelines ask banks to verify what they are told during due diligence wherever that is practicable, so that no credit decision rests only on unverified or verbal information (BCBS, CRI40.15; the full wording is quoted in counterparty due diligence in the bank's own language). A spread whose lines open their source pages is verifiable; one copied from a vendor screen is not, however accurate it happens to be.
A bank spread with the original label and the page on every line
How accurate is automated financial spreading?
No regulator or independent study publishes an accuracy rate for automated spreading of bank filings, and a single rate would mislead anyway: 99% of 184 lines correct still allows two wrong figures, and if one of them is the CET1 ratio the review is wrong. The useful answer is a measurement a firm runs on its own banks, by line family, with the stakes of each family stated up front.
Three properties matter more than the headline. Coverage: what share of lines carry a page reference at all. Accuracy where it counts: the share of correct figures on the lines the scorecard reads, measured separately for each driver. And behaviour at the edges: whether the agent leaves a gap, flags it or fills it when a figure is missing or has been restated. A spreading tool that never leaves a gap is the one to worry about.
Where accuracy matters most: the lines that drive the rating
Accuracy matters most on the lines with the most weight in the scorecard, because an error there moves the notch. In the sample firm's scorecard, capital carries 30% of the score, liquidity 20%, asset quality 20%, profitability 15% and market signals 15%. A test that spreads its checks evenly across 184 lines spends most of its effort where a mistake changes nothing.
Where a spreading error can move the rating: scorecard weight by driver
The weights also say where to look first when the agents' rating moves. In the sample review of an Istanbul bank, capital pushed the score down by 0.55 of a notch, asset quality by 0.30, liquidity by 0.25 and market signals by 0.15, while profitability pushed it up by 0.10: a net push of 1.15 notches. The CET1 ratio behind the largest push sits on page 142 of a Turkish report; that one figure is worth more checking than the rest of the balance sheet together.
Seven ways a bank spread goes wrong
A bank spread goes wrong in a small number of recognisable ways, and an accuracy test should count each separately, because they have different causes and different fixes. Two of them, the restatement and the reclassification, are not errors of reading at all: the figure is copied correctly from the wrong year's version of the truth.
An error taxonomy for bank spreads, and how each is caught
| Error | What it looks like | How it is caught |
|---|---|---|
| 1. Transcription | A digit wrong or transposed: 64,310 entered as 64,130. | Page citation and a second reader on key lines; totals that foot. |
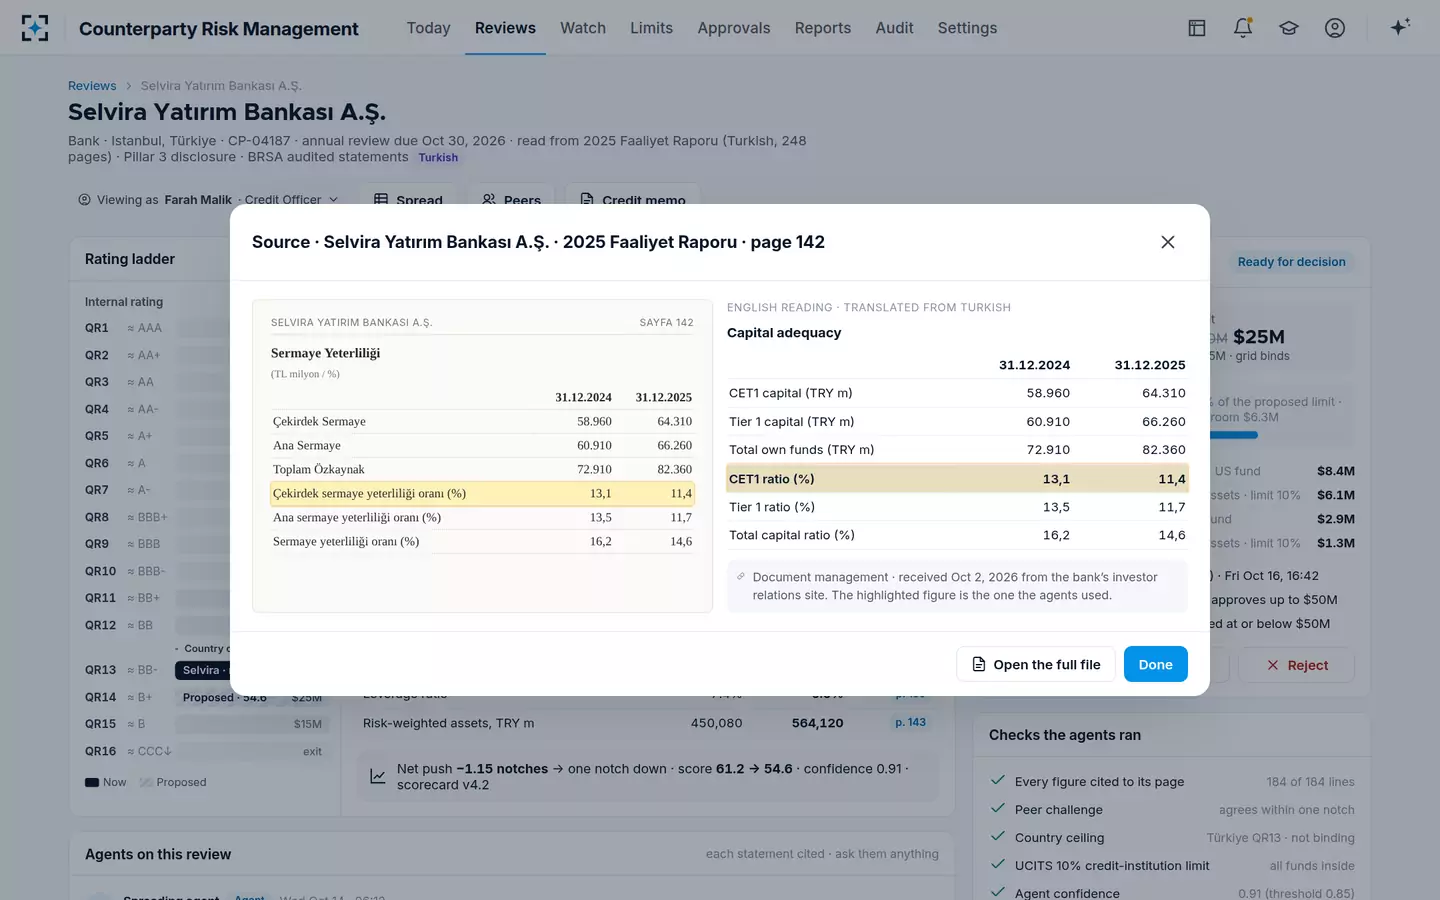
| 2. Number format | A decimal comma read as a thousands separator: 58.960 read as 58.96. | Format rules per language; magnitude checks against last year. |
| 3. Scale and unit | Millions read as thousands, or a ratio in percent read as a fraction. | Units captured from the table header; cross-checks between ratio and its parts. |
| 4. Period | A half-year figure in an annual column, or last year's column for this year. | Period detected per document; two-year layout side by side. |
| 5. Mapping | The right number on the wrong line: accounting equity where regulatory capital belongs. | Original label kept beside the template line; mapping review by template version. |
| 6. Restatement missed | Prior-year figure left as first reported after the bank restated it. | Compare prior-year column with last year's spread; flag every change. |
| 7. Reclassification missed | A line moved between categories, breaking the trend. | Notes read for reclassifications; flagged rather than resolved. |
How do you check a spread against the filing?
A spread is checked against the filing by opening each sampled line on its source page and comparing value, unit, period and label, with the sample weighted toward the lines that drive the rating and toward anything that moved sharply. Where every line carries its page, the check takes minutes per line; where it does not, the checker repeats the original spreading work.
The bank supervisors' own data controls offer a model for running it as a process rather than a one-off. Basel's guidelines describe "data reconciliation and variance analysis processes", "a robust process to manually adjust missing or incorrect data", and "KPIs tracking the level of manual intervention (ie data adjustments)", escalated to governance forums (CRI40.124). Applied to spreading, the manual-intervention KPI is the share of lines an analyst had to correct, by family and by template version.
The check itself: the page behind the number, original beside the English reading
How do you handle a restated figure in a bank review?
A restated figure is handled by keeping both versions, flagging the change to the analyst with the note that explains it, and measuring how often restatements are caught as a separate rate. Restatements are where a spreading tool and a human analyst both fail most quietly, because the copied figure is correct for the document it came from.
In the sample review, the prior-year non-performing loan ratio had been restated from 2.2% to 2.4%, explained in note 7 on page 97 of the new report. The Spreading agent flagged the line instead of overwriting it; the analyst opened the note, accepted the restated figure with a reason code, and the audit trail shows when. The asset quality driver was then computed on the corrected trend. A restatement catch rate, restatements flagged over restatements present, is the measure that tells a validator whether this happens every time.
An accuracy framework a credit committee and a validator will accept
An accuracy framework for bank credit analysis should report a handful of measures, each defined in advance, each by line family, on a sample drawn the same way every period. The interagency guidance's description of model validation sets the bar: "an evaluation of the conceptual soundness of relevant models", "an ongoing monitoring process that includes verification of processes and benchmarking", "an outcomes-analysis process that includes backtesting", and "The validation should either be independent, or subject to independent review" (Interagency guidance, Appendix B).
Six measures for spreading accuracy, defined before the test
| Measure | Definition | Why it matters |
|---|---|---|
| Citation coverage | Lines with a page reference ÷ lines filled | Unverifiable lines cannot be checked; the design target in the sample is every line. |
| Key-line accuracy, by driver | Correct figures ÷ checked figures on the lines the scorecard reads, per driver family | The figure that moves the notch; report capital separately. |
| Restatement catch rate | Restatements flagged ÷ restatements present | Restatements are copied correctly and still wrong. |
| Gap honesty | Missing figures left blank and flagged ÷ missing figures | A filled gap looks verified. The right answer is 100%. |
| Analyst correction rate | Lines corrected by the analyst ÷ lines reviewed, by template version | Basel's manual-intervention KPI, applied to the spread. |
| Rating impact | Reviews where corrections changed the proposed notch ÷ reviews | Accuracy in the unit the credit committee cares about. |
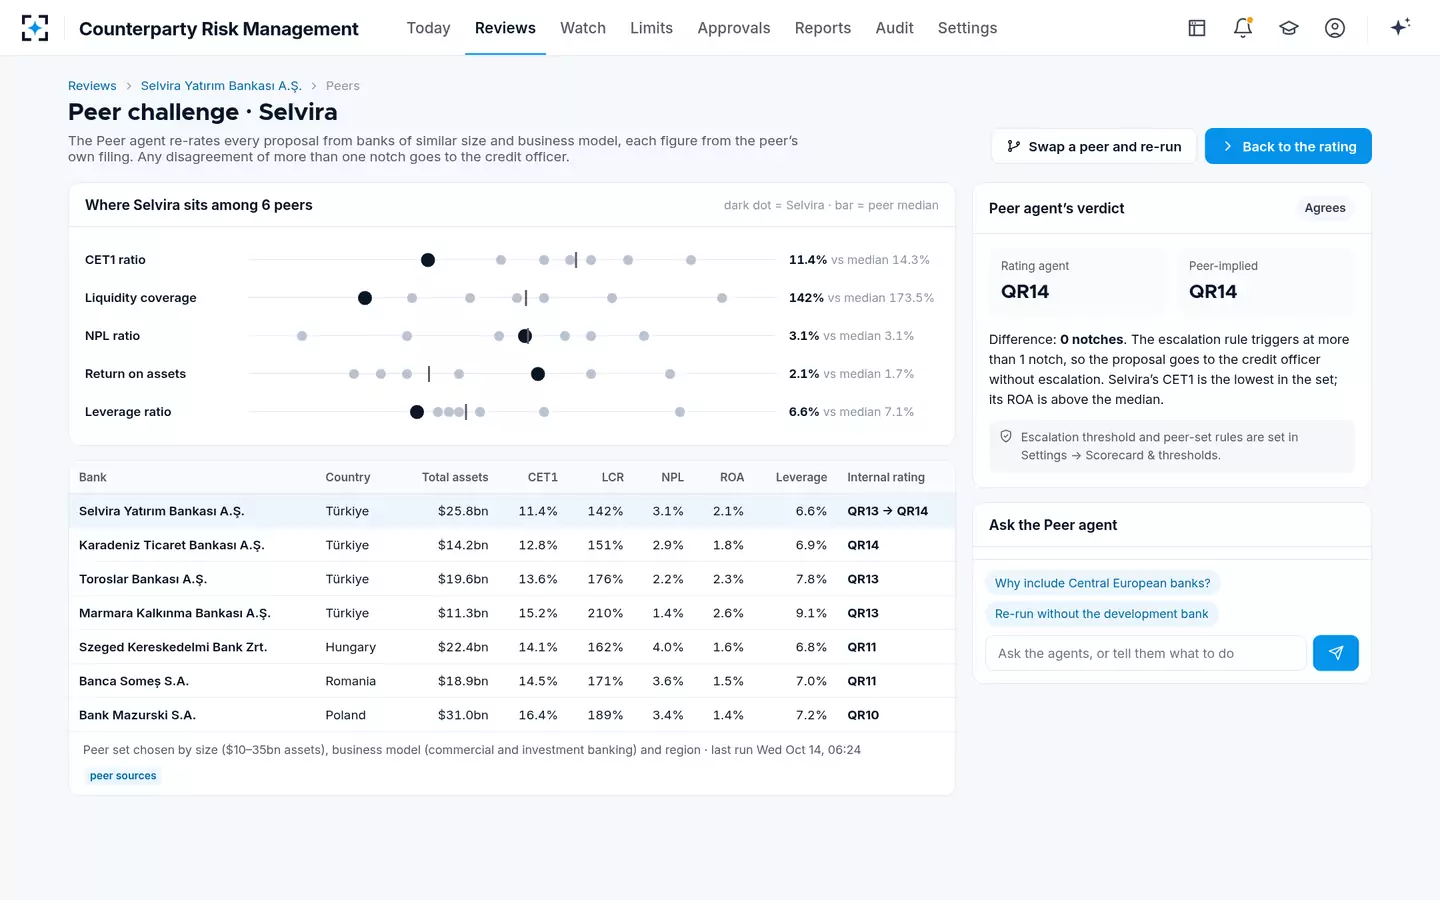
Peers are the last accuracy check, and the cheapest. In the sample, the Peer agent re-rates every proposal from six banks of similar size and business model, each figure read from that peer's own filing; a spreading error large enough to move the notch usually shows up as a bank out of line with its peers on a single driver. How the two agents' disagreements are settled is covered in counterparty credit risk and AI.
Peers as a check: one bank against six on the lines that drive the rating
Bank credit analysis software: what to test before you buy
Test bank credit analysis software on your own banks, in their own languages, with the measures defined before the vendor sees the sample. A demonstration on a large English-language bank proves little; the reviews that cost a team most are the ones that will expose a tool. The Federal Reserve's warning against accepting "incomplete and unverified information" in credit reviews applies to the tool as much as to the counterparty (SR 21-19).
Eight tests for bank credit analysis software, run on your own counterparties
- Bring five banks the tool has never seen
Include two that publish only in their own language and one with a restatement last year.
- Check the key lines, not all lines
Sample the lines your scorecard reads, weighted by driver; open each on its page.
- Count gaps left honestly
Remove a page from one filing. A good tool leaves the figure blank and says why.
- Look for the restatement
Did it flag the prior-year change, or quietly overwrite last year's figure?
- Test number formats on purpose
Decimal commas, thousands separators, units in the header, negative numbers in brackets.
- Ask for the original label beside each line
Mapping errors are invisible without it.
- Measure the analyst's corrections
Time and count, by line family: that is the real cost of the spread.
- Re-rate with corrected figures
Count the reviews where corrections changed the notch; that is the accuracy that matters.
The same evidence, figures cited to pages and corrections kept with their reasons, is what the review of the counterparty itself depends on; how to apply it to a bank that publishes in its own language is set out in counterparty due diligence.
Questions people ask
What ratios matter in bank credit analysis?
Capital (CET1, total capital and leverage ratios, with risk-weighted assets), liquidity and funding (liquidity coverage and net stable funding ratios, deposit concentration), asset quality (non-performing loans and coverage) and profitability (return on assets, margin). The trend and the peer position matter as much as the level.
Is 99% spreading accuracy good enough?
Not as a single number. On a 184-line template, 99% allows one or two wrong figures per review; whether that matters depends on which lines they are. Measure accuracy on the lines the scorecard reads, separately for each driver, and count restatements on their own.
What is a bank credit analysis handbook useful for?
For the method: which ratios to read, how to adjust for accounting differences and how to compare banks across systems. It does not solve the volume problem, reading hundreds of banks' reports a year, which is where agents help and where accuracy has to be measured.
How do you compare banks that report under different accounting rules?
By mapping each to the same template lines while keeping the original label and basis on file, and by preferring regulatory measures, such as capital and liquidity ratios computed under a common framework, where they exist. The Filing Intake agent in the sample notes each document's accounting basis for that reason.
Should a credit analyst re-check every agent-spread line?
No; that recreates the old work. Check every flagged line, every line that moved sharply, and a weighted sample of key lines each period, and track the correction rate. If it stays low on a driver, the sample there can shrink; if it rises, it grows.