There is no official Consumer Duty dashboard template. The FCA's rules do not set a template for the board report or the MI behind it, and its 2026 message to boards was to push beyond MI dashboards for insight. A Consumer Duty dashboard still needs a clear shape: for each of the four outcomes, the measures, their values, a threshold with a stated reason, how different groups of customers fare, and the action and owner for anything outside threshold. Firms build it in one of three ways: a spreadsheet template, a business intelligence dashboard, or findings drafted by agents with every number cited to its source. Botminds' Consumer Duty Outcomes Monitoring is the third kind. This guide compares the three on the question that decides them, whether the dashboard can answer a director who says “show me” in the meeting, and is plain about where a spreadsheet is enough.
Worked examples use a fictional sample bank, Corvane Bank UK, as it runs through the solution with its 2026 report. The FCA's findings and estimates are linked where they appear.
What the Consumer Duty costs, and how much the FCA has read
£2.4bn
top of the FCA’s range for one-off industry costs of the Duty, from £688.6m
£176.2m
top of its range for ongoing annual costs, from £74.0m
180
firms’ first board reports the FCA reviewed in 2024
56
firms in the FCA’s 2026 outcomes monitoring survey
Is there an FCA Consumer Duty dashboard template?
No. The FCA has said so for the board report, and its guidance says the same of monitoring evidence. Its information for firms reads: “Our rules do not set a specific template for the Board report, and it is for individual firms to determine what is appropriate for them” (FCA, Consumer Duty information for firms). FG22/5 adds that “There is no prescribed format for the way in which firms evidence their monitoring of customer outcomes”, while expecting firms to keep records they can provide on request (FG22/5, paragraph 11.26).
What exists instead is a body of published findings that tells a firm what a dashboard has to survive. The FCA has reviewed first-year and second-year board reports and, in July 2026, outcomes monitoring across sectors. Templates sold or shared in the market are a starting point, not a safe harbour: the FCA's June 2026 consultation acknowledged that trade-body templates have helped consistency in some sectors, but nothing in the rules makes a template's measures the right ones for a particular bank's products and customers.
What should a Consumer Duty dashboard show?
A Consumer Duty dashboard should show, for each outcome, a small set of outcome measures, each with its value, threshold, the reason for the threshold, a trend, how the main customer groups compare, and the status and owner of any action. Those columns come straight from the FCA's findings: thresholds without stated reasons, groups averaged away and actions without owners were the commonest weaknesses in the first reports. The 2026 review added a further one: “Many firms set specific thresholds but did not clearly explain how they indicated good or poor outcomes” (FCA outcomes monitoring review).
The columns a Consumer Duty dashboard needs, and why
| Column | What goes in it | Why the FCA would look for it |
|---|---|---|
| Outcome | Products and services, price and value, consumer understanding, consumer support | The best first reports had a section for each of the four outcomes |
| Measure | An outcome a customer experiences, at a stage of the journey | The 2026 review criticised activity metrics used as proxies for outcomes |
| Value and trend | This period, and the last four, from a named source and date | Lagging, unexplained data was a 2026 finding |
| Threshold and reason | Where good becomes poor, and why there | Thresholds without a rationale were a finding in both reviews |
| Groups | The same measure for customer groups of the same product | PRIN 2A.9.10R requires the comparison |
| Status | Within, outside, data late, no evidence yet | A missing number is a finding, not a blank |
| Action and owner | What is being done, by whom, by when | Actions without owners and timescales were a 2024 finding |
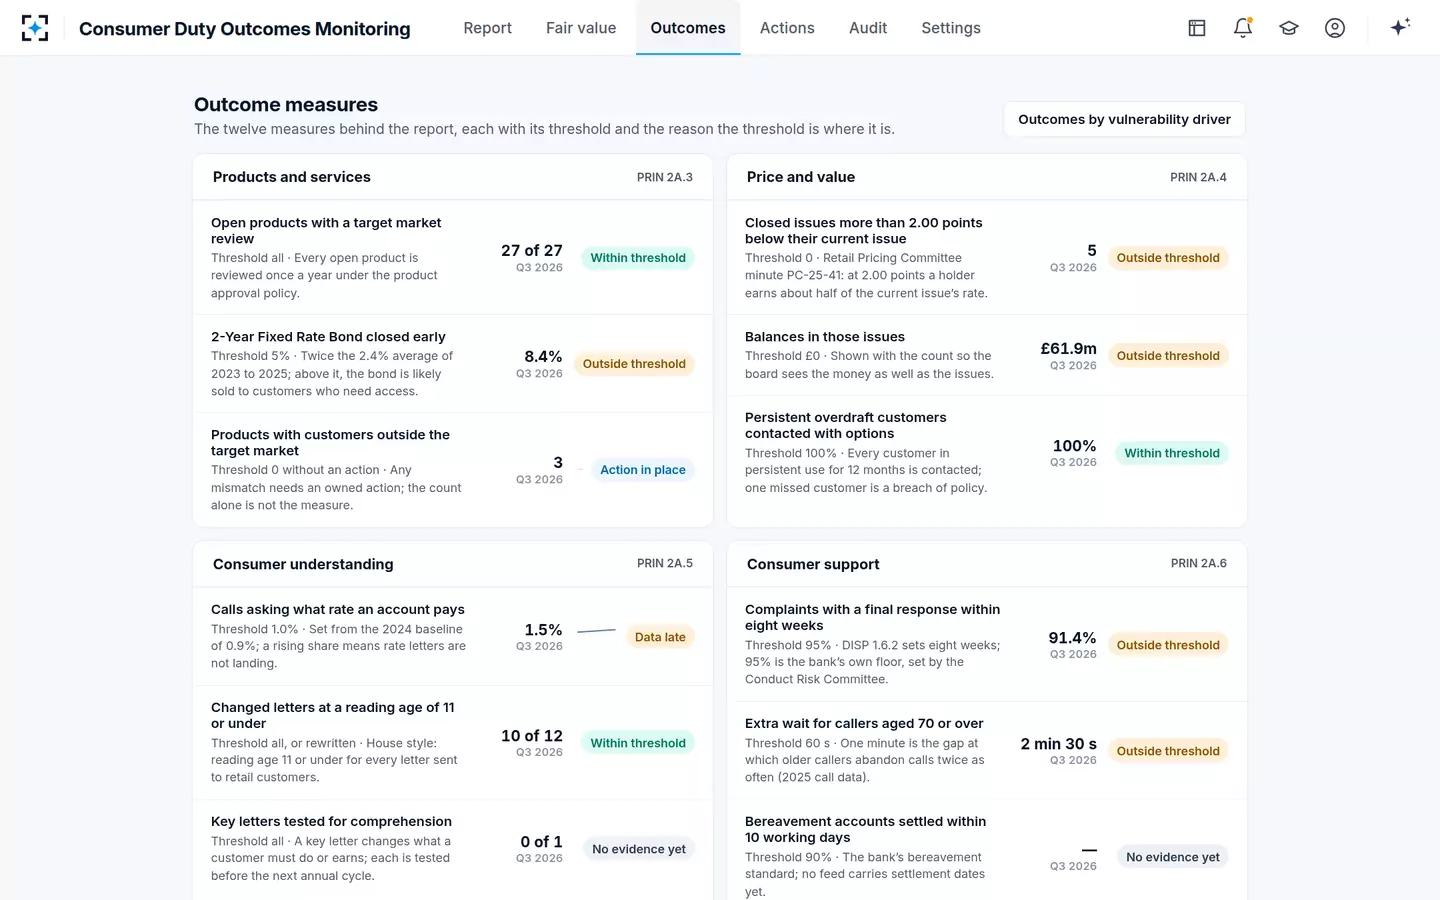
The sample bank's outcome measures screen is one layout of those columns: twelve measures, three for each outcome, each with its Q3 2026 value, threshold, written reason and status. It is a dashboard. What makes it more than one is what happens when somebody clicks.
A Consumer Duty dashboard example: twelve measures, each with its reason
Three ways to build a Consumer Duty dashboard
The three approaches differ less in how they look than in where the evidence lives. A spreadsheet holds numbers someone pasted in. A BI dashboard holds numbers it can refresh from a data warehouse. Agent-drafted findings hold sentences whose numbers are bound to the queries that produced them, plus evidence from places a warehouse rarely reaches, such as letters and call transcripts.
Spreadsheet template, BI dashboard or Consumer Duty Outcomes Monitoring, compared
| Spreadsheet template | BI dashboard | Agent-drafted, cited findings | |
|---|---|---|---|
| Where numbers come from | Pasted from team returns each quarter | Refreshed from the data warehouse | Read from the bank’s systems with query, as-at time and confidence |
| Threshold reasons | A notes column, if anyone fills it | Usually outside the tool | Each threshold carries its written reason; a change needs a second person |
| Group comparisons | Manual, and rarely below one “vulnerable” line | Possible if the warehouse holds the attributes | By group and driver, with small groups suppressed |
| From number to sentence | Written by hand in the report | Written by hand in the report | Drafted with numbers cited; “No evidence yet” where unsupported |
| Challenge before the board | Whoever reads the draft | Whoever reads the draft | One question per weak point, held open until a person answers |
| Audit trail | File versions | Refresh logs | Who did what, when, why and on which evidence, exportable |
| Set-up | Days | Weeks to months, for data engineering | Connection to the systems the conduct team reads |
| Best fit | Few products, few sources, a small firm | A firm with a mature warehouse and BI team | Many products, a closed book, several sources, a board that asks “show me” |
None of the three is wrong in itself. The FCA's 2026 review described governance that used “Consumer Duty MI dashboards, tolerance levels, complaints data and monitoring outputs to identify issues they should investigate” as good practice. The problem it and the year-two review describe is the dashboard that stops at the number.
One board finding, answered three ways
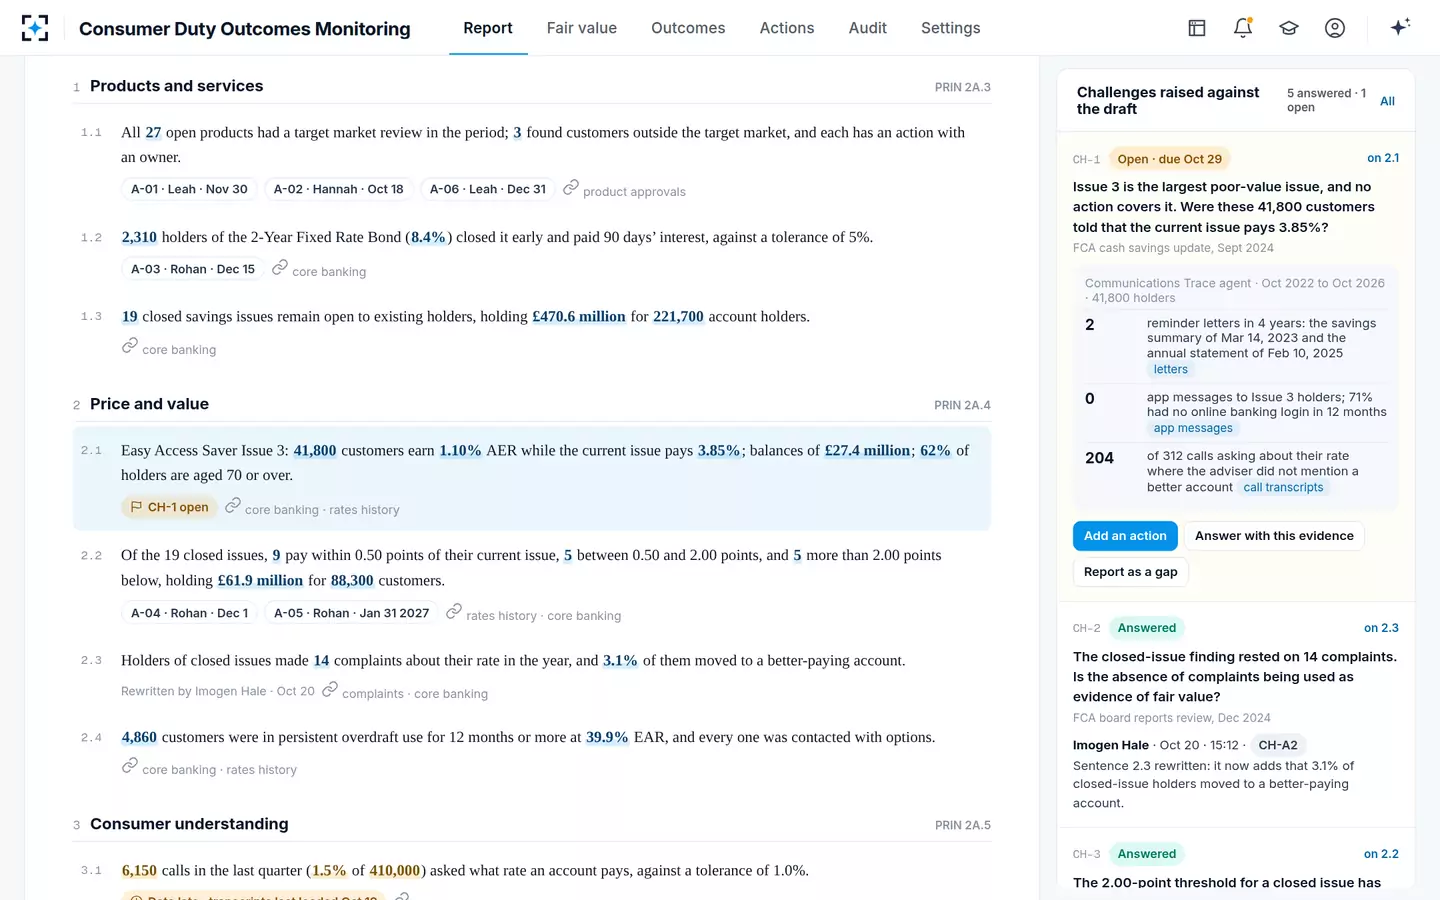
Put the same finding in front of a board three times. The sample bank's MI shows five closed savings issues paying more than 2.00 points below the issue on sale, holding £61.9 million for 88,300 customers, the largest being Easy Access Saver Issue 3: 41,800 holders on 1.10% against 3.85%. A director asks the question the FCA's 2024 cash savings update made central: were these customers ever told?
“Were they told?” — the same director’s question, put to three kinds of dashboard
Spreadsheet template
What the board sees
A cell: “5 issues outside threshold, £61.9m”. The analyst who built it knows which issues; the workbook does not say whether holders were told.
When the question is answered
Answer next quarter, after someone pulls letters and call notes by hand.
BI dashboard
What the board sees
A drill-down: the five issues, holders, balances and ages, refreshed from the warehouse. Letters, app messages and call transcripts are not in the warehouse.
When the question is answered
Answer in a week, if the communications team can search its archive.
Agent-drafted, cited findings
What the board sees
The sentence carries its sources. A trace of four years of letters, app messages and calls: two mentions, no app message, 204 of 312 rate calls without a better-rate mention.
When the question is answered
Answer in the room, from evidence already attached to the sentence.
The difference is not speed for its own sake. An answer that arrives next quarter means the board approves this year's report, and confirms whether it is satisfied on compliance, without knowing. An answer in the room lets it agree an action under PRIN 2A.8.5R on the spot. At the sample bank the trace found two mentions of a better rate in four years, no app message to a group of which 71% had not logged in to online banking in a year, and 204 of 312 calls about their rate in which the adviser did not mention a better account. The action that followed, a rate rise from 1 December 2026, was approved before the board pack closed.
The answer to “were they told?”, attached to the finding
Spreadsheet or software for Consumer Duty MI?
A spreadsheet is enough when a firm has a few products, a few data sources and a person who can explain every number. The FCA's 2026 review said as much: “Smaller firms could use a focused set of indicators without complex systems or large teams.” Its smaller-firm examples used complaints, customer feedback, missed service standards and file checks, linked to plain descriptions of good outcomes at each stage of the journey.
Software earns its cost when the evidence is spread across systems and the board asks questions the MI was not built to answer. A retail bank with dozens of products, a closed book of old savings issues, a vulnerability register, a contact centre and a letters archive has the evidence for most board questions somewhere; the cost is in finding it, matching it and writing it up before the pack closes. That is where a spreadsheet template turns into weeks of requests, and where the FCA's year-two warning bites: “Boards must push for analysis that goes beyond management information (MI) dashboards and provides insights” (FCA, 16 April 2026).
What a dashboard shows, and what a board needs from it
What a dashboard shows: 5 issues outside threshold
What a board needs: Which customers, how many, how much money, and who they are
What a dashboard shows: Red against a 2.00-point threshold
What a board needs: Why 2.00, and who agreed it
What a dashboard shows: 7.3% of customers in a poor-value issue
What a board needs: The group at 16.5% that the average hides
What a dashboard shows: Issue 3 at 1.10% since March 2024
What a board needs: What was done, and whether it worked
What a dashboard shows: No data for bereavement settlement times
What a board needs: A named gap, with an owner and a date to fix it
What does Consumer Duty monitoring cost?
The FCA's own estimate, made before the Duty was finalised, was that it would cost industry between £688.6m and £2.4bn to implement and between £74.0m and £176.2m a year to run, shared between some 51,000 regulated firms (FCA, CP21/36). Monitoring and board reporting sit in the running cost: they recur every year, and they grow with the number of products, groups and sources a firm has to cover.
For a single firm the cost has three parts: assembling the data, turning it into findings, and the governance around them. A spreadsheet minimises tooling cost and maximises the assembly and drafting time of the people who run it. A BI build front-loads data engineering, then refreshes cheaply, but leaves the drafting and the evidence outside the warehouse to people. Agent-drafted findings move assembly and first drafts to software, and leave the time of the conduct team, product owners and board for challenge and decisions; the solution's target is a full draft with cohort MI in two days. The FCA is also clear that more data is not the goal: its June 2026 consultation proposed guidance that “Firms are not expected to collect data that does not meaningfully help them to understand how they influence retail customer outcomes” (FCA CP26/23).
Where agent-drafted findings fit, and where they do not
Agent-drafted findings fit a firm whose outcome evidence is spread across several systems, whose board wants every claim traceable, and whose conduct team spends the run-in assembling rather than judging. They do not fit, or do not pay, in three cases: a small firm whose handful of indicators already fits on one page; a firm that has not yet decided what good outcomes look like for its products, because no tool can supply that definition; and a firm whose data cannot be connected, where the first job is data, not drafting.
They also do not prove anything on their own. The FCA's 2026 review put it in one line for smaller firms that bought new tools: “A new tool or checklist, by itself, does not necessarily show that customer outcomes have improved.” A dashboard of any kind is evidence of monitoring; the evidence of outcomes is what changed for customers afterwards, measured by the same numbers. Consumer Duty MI measures sets out the tests each number should pass first.
What to ask any Consumer Duty software vendor
Ask about evidence and authority, not screens. Every vendor can show a dashboard; fewer can show where each number came from, what happens when the data is late, and who is allowed to decide what.
Eight questions for any Consumer Duty dashboard or monitoring software
- Can a director open the source of any number in the report?
The system, the query and the as-at date, from the sentence itself.
- Can a threshold be saved without a written reason?
If it can, the FCA’s commonest finding is still available to you.
- How does it show a number it does not have?
“No evidence yet” and “data late” should be visible states, never a blank or last quarter’s figure.
- Can it split any measure by customer group?
Age, channel, tenure and vulnerability driver, with small groups suppressed so they cannot be over-read.
- What does it read beyond the warehouse?
Letters, app messages and call transcripts are where “were they told?” is answered.
- Who can approve what, and can anyone approve their own work?
Answers, actions, prices and report versions each need a named person, and a different checker.
- What does the audit trail export?
Who did what, when, why and on which evidence, in a form internal audit and the FCA can read.
- What will a pilot on our own data prove?
Agree the finding you want reproduced, and the measure of success, before it starts.
To see the three answers side by side on the sample bank's report, start from Consumer Duty Outcomes Monitoring; the run-in it is built for is set out in the Consumer Duty board report deadline.
Questions people ask
What is a Consumer Duty dashboard example?
A common layout has four panels, one per outcome, each with three to five measures showing value, threshold, reason, trend and status. The fictional sample bank's version has twelve measures, including closed savings issues more than 2.00 points below their current issue and complaints with a final response within eight weeks, each with the reason for its threshold.
Can AI write Consumer Duty findings?
AI can draft them, because PRIN 2A.8.3R does not say who writes the report, but the governing body must approve it and agree the actions. The safe design binds every number to its source and marks unsupported findings as gaps; the FCA's October 2026 good practice describes AI that supports rather than replaces people's judgement.
Do we need a separate Consumer Duty dashboard if we have BI?
Not necessarily. If the warehouse holds the outcome data, the customer attributes for group comparisons and the thresholds with their reasons, a BI dashboard can carry the measures. What it usually lacks is the evidence outside the warehouse, such as letters and calls, and the drafting and challenge that turn numbers into findings.
How many measures should a Consumer Duty dashboard have?
There is no number in the rules. The FCA's smaller-firm examples used a small number of existing indicators tied to key journey stages, and its 2026 review praised a firm that combined customer feedback, complaints, performance information and outcomes-based testing rather than relying on one measure.
What tools do firms use for Consumer Duty monitoring?
The FCA's 2026 review described MI trackers with triggers and escalation routes, action trackers that record owners, dates and status, dashboards with tolerance levels, AI-assisted chat routing and synthetic testing of communications. It stressed that a tool by itself does not show outcomes have improved.