US bank supervisors use three numeric tests for concentration risk. A concentration of credit is any group of direct, indirect or contingent obligations above 25% of tier 1 capital plus the allowance for credit losses, under the OCC's 2026 handbook. Under the 2006 interagency guidance, a bank's commercial real estate lending draws further supervisory analysis when construction, land development and other land loans reach 100% of capital. It does too when total CRE reaches 300% of capital after growing 50% or more in 36 months. Since March 2020, “capital” in all three tests means the same thing: tier 1 capital plus the allowance. None of the three is a limit. Each tells examiners, and the board, where to look harder. This guide works through the arithmetic and the reporting. It also covers the part the screens leave out, which is where Botminds' Commercial Loan Portfolio Analysis reads the credit files for exposures no call report line shows.
The three concentration tests a commercial bank is measured against
25%
of tier 1 capital plus ACL: the OCC’s threshold for any concentration, direct, indirect or contingent
100%
of tier 1 capital plus ACL in construction, land development and other land loans
300%
of tier 1 capital plus ACL in total CRE, together with CRE balances up 50% or more in 36 months
What counts as a concentration of credit in 2026
Any group of obligations that share a risk and together exceed 25% of tier 1 capital plus the allowance. The OCC's current definition is broad on purpose. Version 3.0 of the “Concentrations of Credit” booklet, issued in September 2026, defines a concentration as “the sum of direct, indirect, or contingent obligations exceeding 25 percent of a bank's tier 1 capital plus the allowance for credit losses (ACL)” (OCC, 2026). Obligations include loans, overdrafts, letters of credit, derivative exposure and “any other actual or contingent liab[ility],” aggregated across all lines of business. The grouping is the bank's to choose: an industry, a property type, a geography, a sponsor or a shared source of repayment.
All three tests now share one denominator, and using the old one is a common error in board reports. The 2006 CRE screens were written against “total capital,” which the guidance tied to total risk-based capital from the call report. A joint statement of March 2020 replaced that base for these ratios: “as of March 31, 2020, the agencies will consistently calculate credit concentrations using tier 1 capital plus the appropriate allowance for loan and lease losses (ALLL) or allowance for credit losses (ACL) as the denominator” (OCC Bulletin 2020-29). A bank that has adopted ASC 326 adds its ACL; one that has not adds its ALLL. A board pack still dividing the CRE screens by total risk-based capital is using the pre-2020 method.
How to calculate CRE concentration: the 100% and 300% screens worked through
Divide the CRE balances the guidance defines by tier 1 capital plus the allowance, and check balance growth over 36 months. The 2006 guidance sets two screens. The first: “Total reported loans for construction, land development, and other land represent 100 percent or more of the institution's total capital.” The second: “Total commercial real estate loans … represent 300 percent or more of the institution's total capital and the outstanding balance of the institution's CRE loan portfolio has increased 50 percent or more during the prior 36 months” (71 FR 74580). Both parts of the second screen must be met together. A bank at 320% with flat CRE balances has not met it, though its examiner will still ask about it. The words “total capital” in those quotes are the 2006 text; since the 2020 joint statement, the agencies compute both screens on tier 1 capital plus the allowance. That change “applies only to supervisory calculations for credit concentration ratios and does not affect the calculation of total capital used for other purposes” (OCC Bulletin 2020-29).
What counts as CRE is defined by repayment, not by collateral. The guidance covers construction and land loans and loans on multifamily and nonfarm nonresidential property “where the primary source of repayment is cash flows from the real estate collateral.” That excludes owner-occupied property, where the business's own operations repay the loan. It adds that “loans to REITs and unsecured loans to developers also are considered CRE loans” if their performance is closely linked to the CRE market. On the call report this maps to Schedule RC-C real estate lines plus Memorandum item 3, loans to finance CRE not secured by real estate. Line numbers have moved since 2006; the 2024 revisions confirmed that Memorandum item 3 also picks up such loans reported on the NDFI line (Federal Register, 2024).
The concentration tests on one illustrative bank
Inputs from the call report
The tests
Any one concentration
Exposure ÷ (tier 1 + ACL)
Line of $110M to one group ÷ $405M = 27.2%
Over 25%: a concentration
Construction and land
C&LD and other land ÷ (tier 1 + ACL)
$310M ÷ $405M = 76.5%
Under 100%
Total CRE
Total CRE ÷ (tier 1 + ACL)
$1,250M ÷ $405M = 308.6%
Over 300%
CRE growth, 36 months
(Total CRE now ÷ three years ago) − 1
$1,250M ÷ $790M − 1 = 58.2%
Over 50%: with the line above, the screen is met
The example bank crosses two thresholds and passes one. Its construction book is under 100%, at 76.5%, but total CRE is 308.6% and has grown 58% in three years, so it meets the second screen. The margin is thin: about $35M of CRE paydowns, or $12M more tier 1 capital, would take it back under 300%. Separately, one sponsor group with $110M of commitments across several property types is above 25% of tier 1 plus ACL, a concentration in the OCC's sense whatever the CRE ratios say. Neither result means the bank must stop lending. Both mean its examiners will expect the risk management the guidance describes, and its board should already be seeing these figures.
CRE concentration limits: what happens if a bank exceeds 300%?
Nothing automatic: crossing a screen brings closer supervisory analysis and higher expectations of risk management, not a ban on lending. The guidance says plainly that it “does not impose lending limits.” A bank that meets a screen “may be identified for further supervisory analysis of the level and nature of its CRE concentration risk.” Being under the screens is not a safe harbour either: “institutions should not view the criteria as a ‘safe harbor’ if other risk indicators are present.” What crossing a screen changes is the expectation of risk management. The 2006 text lists seven elements: board and management oversight, portfolio management, management information systems, market analysis, credit underwriting standards, “portfolio stress testing and sensitivity analysis,” and the credit risk review function.
Each test, its inputs, and what an examiner expects once it is crossed
| Test | Numerator | Denominator | Once crossed |
|---|---|---|---|
| OCC concentration | Direct, indirect and contingent obligations to one group, bank-wide | Tier 1 capital + ACL | Identify, measure, monitor and report it; a board-approved limit for the group |
| Construction and land screen | C&LD and other land loans | Tier 1 capital + ACL (since 2020) | Further supervisory analysis; heightened risk management |
| Total CRE screen | CRE where real estate cash flow repays, plus CRE loans not secured by real estate | Tier 1 capital + ACL (since 2020), plus 50% growth over 36 months | The seven risk management elements of the 2006 guidance |
| Real estate LTV exceptions | Loans above supervisory LTV limits | Total capital | Aggregate capped at 100%; non-1-to-4 family capped at 30% |
The cost of not running these tests is well documented in failed-bank reviews. Citizens Bank of Sac City, Iowa built commercial trucking loans to “310 percent of Tier 1 Capital and Allowance for Credit Losses,” 43% of its portfolio, before failing in 2023 at a $14.8M loss to the Deposit Insurance Fund (FDIC OIG). Trucking is not CRE, and the CRE screens would never have flagged it. The 25% test would have flagged it many times over. First NBC Bank, whose 2017 failure cost the fund $996.9M, at one point had four borrowers whose relationships each exceeded 25% of tier 1 capital (FDIC OIG, AUD-18-002).
CRE concentration guidance at the FDIC, OCC and Federal Reserve: one text since 2006
The FDIC, the OCC and the Federal Reserve apply the same CRE concentration guidance, issued jointly in December 2006 and never replaced; only the denominator changed, in 2020. The Federal Reserve sent it to its banks as SR 07-1; the OCC issued it as Bulletin 2006-46, which its September 2026 “Concentrations of Credit” booklet still cites as current. A bank searching for the “FDIC” or the “OCC” version is reading the same screens.
The agencies have reminded banks of it once since, in December 2015, when CRE prices and competition were rising. Their statement said institutions “should have risk-management practices commensurate with the level and nature of their CRE concentration risk” and urged them to “maintain underwriting discipline” and to “identify, manage, monitor, and control the risks arising from their CRE lending activity” (SR 15-17). The reminder added no new ratio. Its message was that the screens had not been withdrawn simply because they were old.
What has changed is everything around the screens. The call report line numbers have moved, the NDFI line now holds some CRE-related lending, and the OCC rewrote both its concentrations booklet and its portfolio risk booklet in 2026. A board report built in 2016 that still maps the screens to old line numbers will compute the right ratio from the wrong inputs, and is worth re-checking against the current instructions.
Concentrations the CRE screens do not see
The CRE screens are built from call report lines, so they see only what the call report codes. Three kinds of concentration fall outside them. The first is industry concentration inside C&I, such as Citizens' trucking book. The second is concentration by shared counterparty: a sponsor behind several property loans, a guarantor on many credits, a tenant whose lease repays several buildings. The third is indirect exposure through a shared input or customer, such as borrowers in different industries that depend on the same imported material or the same retailer.
The first is a loan-system query. The second and third live in the credit files: in guaranty agreements, rent rolls, supplier lists and annual reviews. The OCC's definition expects all three to be counted. A tariff or supplier concentration, which no code screen finds, is worked through in what industry codes miss. For the C&I and CRE delinquency rates to set beside your own screens, see what the FDIC's numbers say.
Credit concentration risk in banks: where call report CRE and the guidance's CRE differ
The call report and the 2006 guidance do not define CRE the same way, so a ratio built straight from call report lines can be both too high and too low. The guidance anchors its screens in the call report where it can: its footnotes point construction and land loans to Schedule RC-C item 1.a and “total capital” to the risk-based capital reported on Schedule RC-R. Since 2020 the denominator is tier 1 capital from Schedule RC-R plus the allowance from the balance sheet, both from the same call report. But the agencies recorded that commenters found the call report's identification of CRE “did not correspond to the proposed guidance's CRE definition,” and the final text kept a definition based on repayment source rather than on reporting lines (71 FR 74580).
The differences run both ways. Owner-occupied nonfarm nonresidential loans sit in the real estate lines but fall outside the guidance, because the business repays them; a bank that forgets to strip them out overstates its ratio. Unsecured loans to developers, loans to REITs and lines to funds that buy property can fall inside the guidance while sitting in C&I or on the NDFI line; a bank that relies only on real estate lines understates it. Memorandum item 3 catches some of the second group, if the loans were coded correctly in the first place.
Whether a loan is repaid by the property or by the business, and whether an unsecured developer loan is “closely linked” to the CRE market, is written in the credit memo and the annual review, not in the collateral code. That makes the CRE ratio itself partly a file-reading exercise for the loans near the boundary, and it is why the next section's concentrations, the ones the screens never see, need the files entirely.
Reporting concentrations to the board: what, and how often
The board should see each concentration measured against a limit it approved, the trend, and the stress result, at least quarterly. The 2006 guidance makes the board responsible for “the level of risk assumed by the institution” and expects a bank with a CRE concentration to explain it in its strategic plan. The OCC's 2026 request list for a portfolio examination asks for “concentration and portfolio diversification reports” and “results of the most recent loan portfolio stress tests” (OCC, 2026). The OCC's community bank stress testing guidance expects “some form of stress testing or sensitivity analysis of loan portfolios on at least an annual basis” (OCC Bulletin 2012-33).
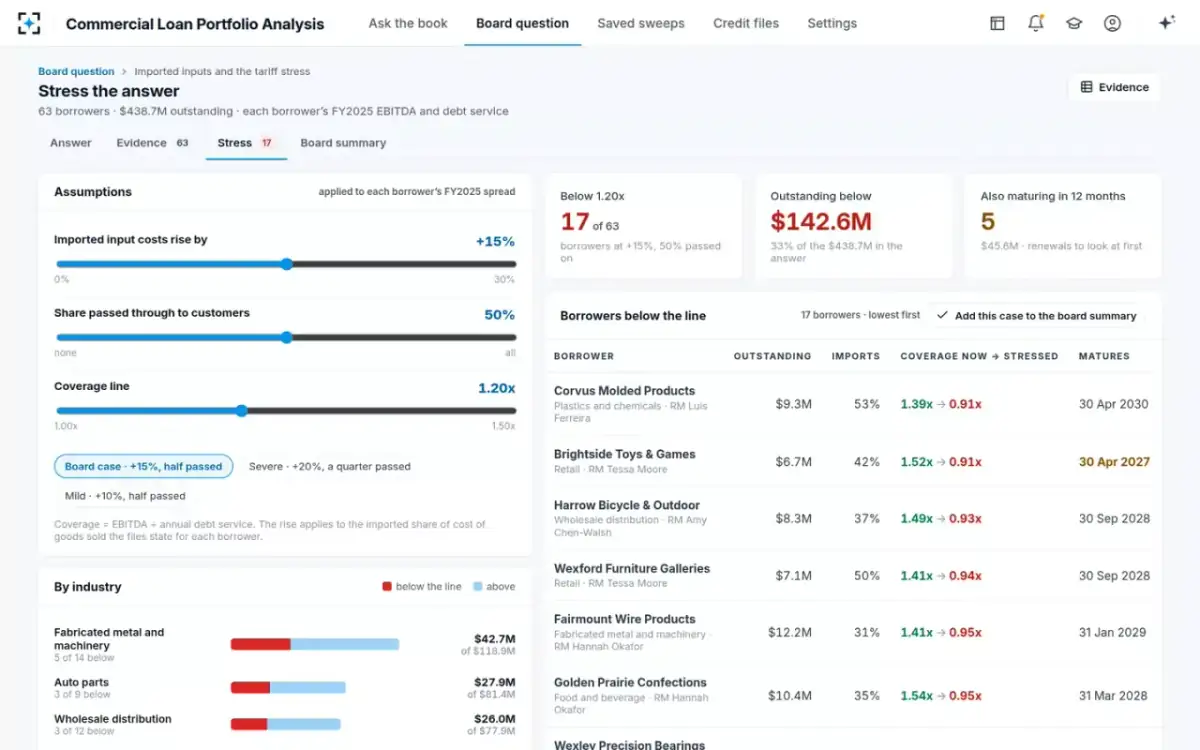
Two habits make those reports more useful than a ratio table. Show every concentration on the one base the agencies use, tier 1 capital plus the allowance, and say so on the page; if an older report used total risk-based capital, restate its history rather than mixing the two. And show what the bank does not know: borrowers whose files do not say what the concentration depends on. In Commercial Loan Portfolio Analysis, a board answer separates the borrowers counted, the borrowers cleared and the borrowers the files cannot answer for. Each total is tied to the loan system at one as-of date. The answer stops if it does not tie.
What the board receives: the exposure by industry, the stress and the approval
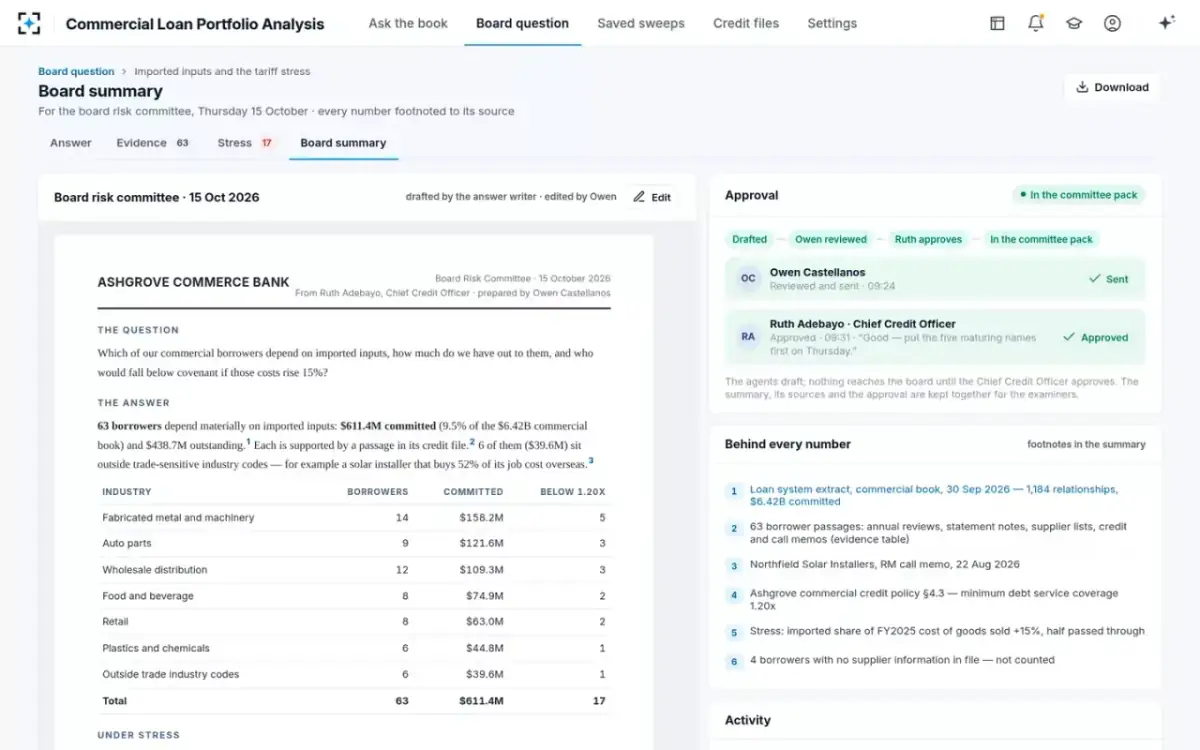
A concentration answer in Commercial Loan Portfolio Analysis, by industry, with the stress applied
A concentration screen checklist
Running the concentration tests each quarter
- Compute one denominator from the latest filing
Tier 1 capital plus the ACL (or ALLL before ASC 326) for the 25% test and both CRE screens, as the agencies have since March 2020. Label it on the page.
- Build total CRE by repayment source
Exclude owner-occupied property repaid by the business; include CRE loans not secured by real estate and those on the NDFI line where they finance CRE.
- Run the growth test on balances, not commitments
The 2006 screen uses the outstanding balance of the CRE portfolio over the prior 36 months.
- Group exposures by shared counterparty, not only by code
Sponsors, guarantors, tenants and dominant customers can create a 25% concentration across several codes.
- Look for indirect concentrations in the files
Shared inputs, suppliers and customers sit in reviews, statement notes and supplier lists, not in the loan system.
- Stress each concentration
At least annually, with results the board can set against its limits and its capital plan.
- Report what is not known
Borrowers whose files do not answer the question belong on a named list, not in or out of the total by default.
- Keep the board’s limits and the screens apart
The screens are supervisory triggers; the limits are the board’s appetite. A report should show both.
The arithmetic of the three tests is simple, and many banks already automate it. The work that remains is the grouping the call report cannot do and the indirect exposures it cannot see. That work needs the credit files, read the same way across the whole book, with every borrower's inclusion traceable to a page. See it on a sample bank's book in Commercial Loan Portfolio Analysis; the guidance's change on leveraged loans, which now also asks each bank for its own definition, is covered in define your own leveraged loan.
Questions people ask
What is the CRE concentration ratio formula?
Total CRE loans as the 2006 guidance defines them, divided by tier 1 capital plus the allowance for credit losses, the base the agencies have used since March 2020 in place of total risk-based capital. For the construction screen, use construction, land development and other land loans over the same capital. The 300% screen also requires CRE balances to have grown 50% or more over the prior 36 months.
Is 300% a CRE concentration limit?
No. The agencies wrote that the guidance “does not impose lending limits.” Crossing the screens identifies a bank for further supervisory analysis and raises expectations for risk management. Many banks set their own board limits, which may be above or below the screens.
Does owner-occupied CRE count toward the 300% test?
Not under the 2006 guidance, which focuses on loans where cash flow from the real estate is the primary source of repayment. Owner-occupied loans are repaid by the business that occupies the property. They still count toward the OCC's 25% concentration test if they form a group of correlated exposures.
What is concentration risk in banking?
It is the risk that many exposures lose value together because they share one driver: an industry, a property type, a region, a counterparty or an input. The OCC treats any such group above 25% of tier 1 capital plus the allowance as a concentration to identify, measure, monitor and control, whether the obligations are direct, indirect or contingent.
Is a concentration above 25% of capital the same as breaching the legal lending limit?
No. The legal lending limit caps lending to one borrower: for a national bank, 15% of capital and surplus, plus another 10% if fully secured by readily marketable collateral (12 CFR 32.3). The 25% concentration test is not a cap on anything; it marks a group of related exposures that needs managing and reporting.