Commercial loan delinquency rates at US banks are low and uneven in 2026. The headline measure, the C&I noncurrent rate, is the share of a bank's commercial and industrial loans that are 90 days or more past due or on nonaccrual. Across all FDIC-insured institutions it was 0.96% at June 30, 2026. Add loans 30 to 89 days past due and the past-due-and-nonaccrual (PDNA) rate was 1.27%; year-to-date net charge-offs ran at 0.57% (FDIC Quarterly Banking Profile). Those are calm numbers for a $2.54 trillion book. Underneath them the picture is uneven by type of bank, community banks are deteriorating slowly, and the industry's loan growth is being led by lending to other lenders. Botminds' Commercial Loan Portfolio Analysis sits after this kind of comparison: once a bank knows where its own rate stands, the agents read its credit files to say which borrowers make up the difference, and why.
Commercial and industrial loans at FDIC-insured institutions, June 30, 2026
$2.54T
C&I loans outstanding, up 6.3% on a year earlier
0.96%
noncurrent: 90+ days past due or on nonaccrual
1.27%
past due 30+ days or nonaccrual (0.31% + 0.96%)
0.57%
net charge-offs, year to date
What is the C&I noncurrent rate, and what is it now?
It is the most-watched measure of commercial loan quality, and the FDIC publishes it every quarter for the whole industry and for groups of banks. The Quarterly Banking Profile draws it from every insured institution's call report: C&I loans from Schedule RC-C, past-due and nonaccrual balances from Schedule RC-N. That makes it directly comparable with a bank's own filing. Of 4,238 institutions reporting at June 30, 2026, C&I balances grew $46.6 billion in the quarter, one of the two largest increases among loan types.
The trend is steady rather than alarming. Survey evidence points the same way: in the Federal Reserve's July 2026 survey, banks reported “basically unchanged standards for commercial and industrial (C&I) loans to firms of all sizes” and stronger demand from large and middle-market firms (SLOOS, July 2026). The October 2026 survey is due in early November. Next to those, a single industry rate is a poor guide to any one bank. The spread across bank types matters more.
C&I loans vs CRE loans: what each is, and why their delinquency differs
A C&I loan is repaid from a business's operating cash flow; a commercial real estate loan is repaid from a property's rents or its sale. That one difference drives everything else. C&I loans are often revolving lines secured by receivables, inventory and equipment, or unsecured; CRE loans are secured by the building. The FDIC reports them on separate lines: $2.54 trillion of C&I loans at June 30, 2026, against $1.94 trillion of nonfarm nonresidential real estate loans and $453 billion of construction and development loans (FDIC QBP, Table II-A).
Maturity differs too, and it changes how fast trouble shows. Among firms with less than $50 million in assets, “three-quarters of credit lines have maturity of 1 year or less at origination and more than one-quarter of loans to these firms are demand loans immediately callable by the lender” (Chodorow-Reich and others, NBER). A small-business line is re-underwritten every year, so a weakening borrower is often caught at renewal before it is 90 days late. A five-year CRE term loan can sit current on a property whose value has fallen, until it has to refinance.
C&I loans vs CRE loans, as a credit officer reads the delinquency numbers
C&I loans: The borrower’s operating cash flow
Commercial real estate loans: Rents, or sale or refinance of the property
C&I loans: Receivables, inventory, equipment, or none
Commercial real estate loans: A mortgage on the property
C&I loans: One-year lines for smaller firms; renewed each year
Commercial real estate loans: Multi-year terms that end in a refinance
C&I loans: Margins, covenant tests, borrowing base
Commercial real estate loans: Occupancy, rents, appraisal and refinance terms
C&I loans: 1.27% (all insured institutions)
Commercial real estate loans: 3.08% non-owner-occupied at banks over $250B
The industry number hides a wide spread by bank type
The FDIC groups banks by what dominates their balance sheet, and C&I quality differs sharply between the groups. Commercial lenders, the group most commercially focused banks fall into, had a C&I noncurrent rate of 1.06% and a PDNA rate of 1.38%. Diversified banks under $1 billion had the weakest C&I loans of any group: 1.51% noncurrent and 2.70% PDNA, a PDNA rate more than two and a half times that of diversified banks over $1 billion.
C&I past-due-and-nonaccrual rate by FDIC asset concentration group, June 30, 2026
The same table gives the other measures a chief credit officer would set beside the bank's own. For commercial lenders, 0.32% of C&I loans were 30 to 89 days past due and year-to-date net charge-offs were 0.46%. For diversified banks under $1 billion, 1.19% were 30 to 89 days past due, nearly four times the industry's 0.31%, but net charge-offs were only 0.41%. Small banks were carrying more late loans without yet writing more of them off. That is the pattern a board should ask about before it shows up in losses.
Community banks are where C&I quality is slipping
The FDIC's annual risk review points the same way over a longer window. “The C&I PDNA rate continued to rise at community banks to 1.81 percent as of fourth quarter and was above the pre-pandemic average of 1.62 percent” (FDIC Risk Review 2026). C&I loans are 12.1% of community banks' loan books and grew 4.9% in 2025, so the deterioration is in a growing portfolio. The review calls 2025 business conditions “tepid,” with “relatively tight bank underwriting and weak business demand for loans.”
Commercial real estate tells a different story at the largest banks. Their non-owner-occupied CRE PDNA rate “declined for the seventh consecutive quarter to 3.08 percent, below the recent peak of 4.99 percent in third quarter 2024 but well above the pre-pandemic average rate of 0.59 percent” (FDIC, August 2026). The FDIC adds that those banks hold less of it relative to capital than smaller banks do. For a regional or community bank the CRE screens remain the first concentration test, and they are worked through in the 25%, 100% and 300% tests.
Syndicated credit: better on paper, for a stated reason
The Shared National Credit review covers commitments of $100 million or more shared by several regulated institutions, and its 2025 results need reading to the end. The 2025 portfolio held 6,857 borrowers and $6.9 trillion of commitments. Non-pass loans, those rated special mention or classified, fell to 8.6% of commitments from 9.1%. The agencies add that the decline “is primarily due to growth in new commitments rather than an underlying improvement in credit quality” (SNC report, January 2026).
The 2025 Shared National Credit review in five numbers
| Measure | 2025 review | What it means for a participant bank |
|---|---|---|
| Borrowers / commitments | 6,857 / $6.9 trillion | Up 6% on the year; a participant holds a slice of credits it did not underwrite |
| Non-pass share of commitments | 8.6% (9.1% in 2024) | Lower because the denominator grew, not because credits improved |
| US banks’ share of commitments | 45% | Other participants hold the rest |
| US banks’ share of non-pass loans | 22% | US banks hold proportionally less of the weak paper |
| Leveraged loans as a share of non-pass | 81% | The definition of a leveraged loan decides where most of the weak paper is counted |
The last line matters more after December 2025, when the OCC and FDIC withdrew the interagency leveraged lending guidance and told each bank to define a leveraged loan for itself. A bank's own definition now decides which of its credits fall in the group that holds four-fifths of the industry's non-pass syndicated paper; see defining your own leveraged loan.
Loans to nondepository financial institutions on the call report: the year's fastest-growing line
Loans to other lenders grew faster than any other loan line, and their reported delinquency is low. Loans to nondepository financial institutions grew $279.1 billion, or 22.4%, in the year to June 30, 2026, leading the industry's 6.8% annual loan growth (FDIC QBP). At the end of 2025 they totalled $1.4 trillion, 5.6% of industry assets, and their PDNA rates were well below C&I rates in every size group: 0.80% at banks under $10 billion, 0.36% between $10 and $100 billion, and 0.11% above $100 billion (FDIC Risk Review 2026).
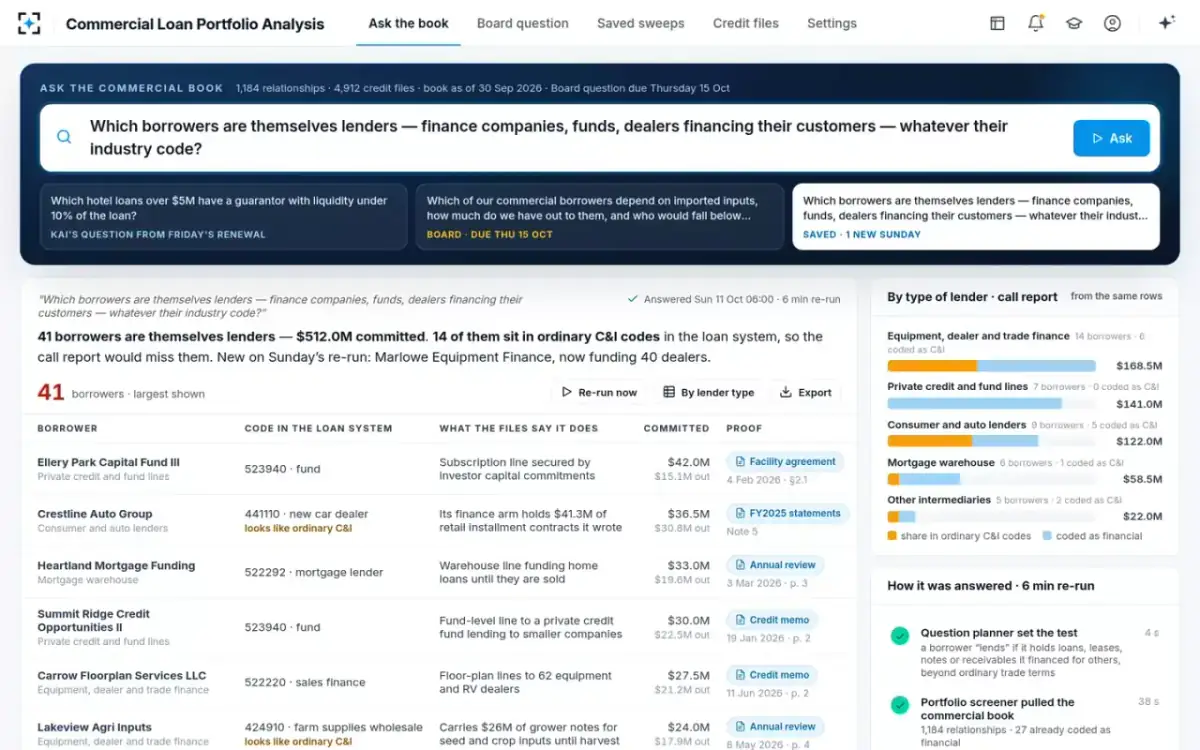
Two cautions keep that comparison honest. Part of the growth is reclassification under new call report instructions, so the line is filling with loans that were previously reported on other lines. And low delinquency on lending to lenders says little about the loans those lenders make. The exposure that matters sits one step away, in the borrower's own book. Finding lenders hidden in ordinary C&I codes is covered in what industry codes miss.
Loans to other lenders, found in the files: one sample bank’s 41
Putting your own call report beside the industry
The comparison takes an afternoon and every number in it is public or already filed. Take your own RC-C and RC-N lines for the same date, compute the same ratios, and set them beside the industry and your FDIC group. The OCC's 2026 booklet lists the inputs examiners use for portfolio analysis: “loan trial balance, loan committee packages, concentration reporting, … lending policy exception and override reporting, and credit risk review reports,” and for commercial books “DSCR, LTV, FCC, leverage ratios, and weighted average risk ratings” (OCC, 2026). Put both views in the same table.
A one-page C&I comparison for the board, June 30, 2026
| Measure | All insured | Commercial lenders | Diversified under $1B | Your bank |
|---|---|---|---|---|
| C&I 30–89 days past due | 0.31% | 0.32% | 1.19% | RC-N ÷ RC-C |
| C&I noncurrent | 0.96% | 1.06% | 1.51% | RC-N ÷ RC-C |
| C&I past due and nonaccrual | 1.27% | 1.38% | 2.70% | Sum of the two |
| C&I net charge-offs, YTD | 0.57% | 0.46% | 0.41% | RI-B, annualised |
| C&I loan growth, year on year | 6.3% | n/a | n/a | RC-C, two dates |
A rate above the group's is a question, not a finding. It can mean weaker underwriting, a regional downturn, a few large problem credits or a book tilted to riskier industries. The call report cannot say which. Only the files can.
From a rate to a reason: questions only the files answer
When a board sees its bank's C&I PDNA rate above the peer group's, it asks what is behind it. The loan system can list the late borrowers by code and size. It cannot say that four of them share a customer that cut orders in the spring, or that two have going-concern paragraphs in their latest audits. That is written in reviews, statement notes and call memos.
What the call report shows, and what the credit files explain
From the call report and loan system: Balances 30–89 days, 90+ and nonaccrual, by loan type
From the credit files: Why each borrower is late, in the RM’s and analyst’s words
From the call report and loan system: Industry code, collateral code, branch
From the credit files: Shared customers, suppliers or guarantors across codes
From the call report and loan system: Maturities and ratings
From the credit files: Going-concern paragraphs, lost customers, covenant waivers
From the call report and loan system: Largest balances first
From the credit files: Borrowers whose files show the cause, with the page
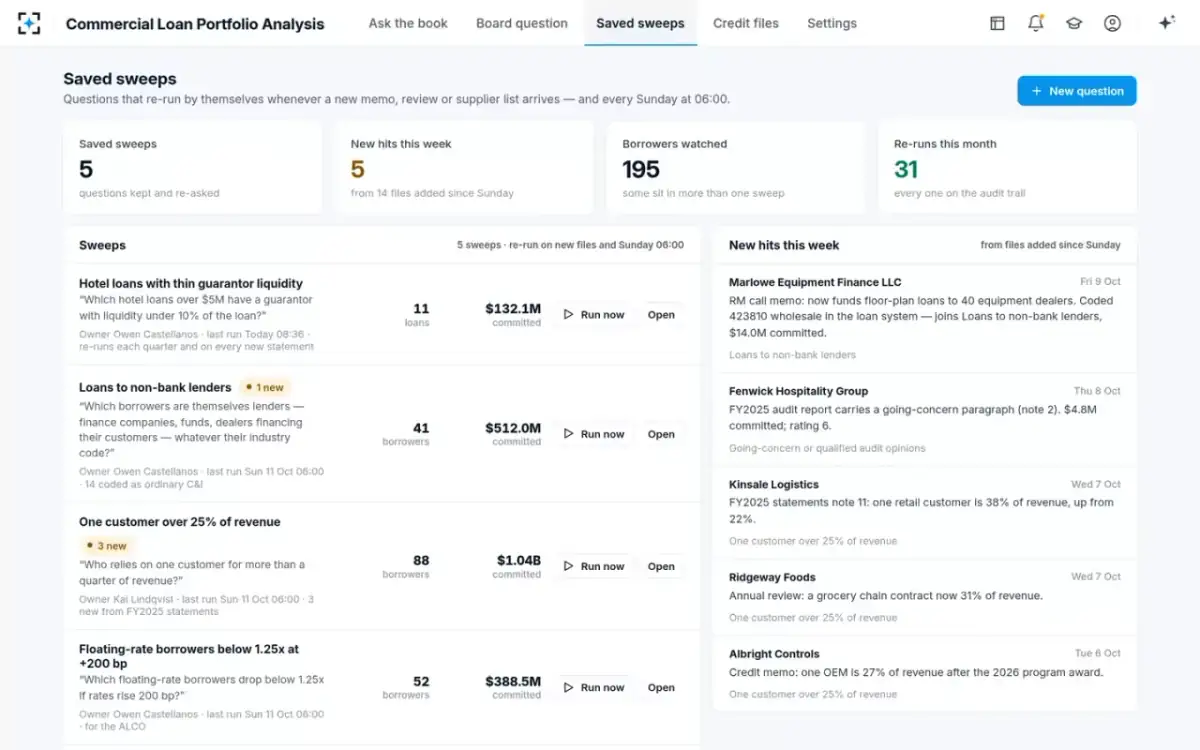
In the solution, those questions can be saved and re-run as files arrive. At a fictional sample bank one such sweep flagged a hospitality borrower whose FY2025 audit carried a going-concern paragraph, and another caught a logistics borrower whose largest customer had risen to 38% of revenue. Neither would have moved the bank's noncurrent rate that week. Both explain what might move it next.
Questions that re-run on new files: the explanations behind next quarter’s rate
Questions people ask
What is the commercial loan delinquency rate in 2026?
At June 30, 2026, 0.31% of C&I loans at FDIC-insured banks were 30 to 89 days past due and 0.96% were noncurrent, for a past-due-and-nonaccrual rate of 1.27%. By type of bank the PDNA rate ran from 0.91% at mortgage lenders to 2.70% at diversified banks under $1 billion.
What is the difference between noncurrent and PDNA?
Noncurrent loans are 90 days or more past due or on nonaccrual. The past-due-and-nonaccrual (PDNA) rate adds loans 30 to 89 days past due, so it moves earlier. The gap between the two is the early-warning part of the book, which is why the 1.19% of C&I loans 30 to 89 days late at the smallest diversified banks deserves attention.
What is the commercial loan default rate at banks?
The FDIC does not publish a default rate; the closest public measures are the noncurrent rate and the net charge-off rate, which counts what banks have written off. Year-to-date C&I net charge-offs were 0.57% of loans at June 30, 2026, annualised.
What did the FDIC Quarterly Banking Profile for Q2 2026 say about C&I loans?
Released on August 25, 2026, it showed C&I balances up $46.6 billion in the quarter to $2.54 trillion, with 4,238 institutions reporting. Loans to nondepository financial institutions rose $49.8 billion in the same quarter, the other of the two largest increases among loan types.
Where does the FDIC publish C&I delinquency by type of bank?
In the Quarterly Banking Profile, Table V-A, which breaks loan performance into asset concentration groups such as commercial lenders, agricultural banks and diversified banks above and below $1 billion. The same release carries balances by loan type in Table II-A.
Are loans to NDFIs riskier than C&I loans?
On reported delinquency, no: NDFI PDNA rates were below C&I rates in every size group at the end of 2025. The risk is less visible than late payments: it depends on the quality of the NDFI's own lending, which the bank sees only through its borrower's reports and its own file.