The way to choose financial spreading software for banks is to test it on your own packages before you buy: plant known errors in borrower packages it has not seen, run them through, and count which errors it catches and which it misses, separately for each kind of error. A single accuracy figure such as "99% of fields extracted correctly" says nothing about the errors that matter: a schedule counted twice, a K-1 on the wrong owner, a balance sheet that only balances because of a plug. Those are rare among a thousand figures and decisive in a credit. This page sets out a seeded-error test for spreading, built around the twelve errors a second-signature reviewer most needs caught, and shows what each does to coverage on a sample borrower in Botminds' Commercial Financial Spreading.
Why one pass of twelve errors is not enough
22%
is still the plausible miss rate for an error type caught 12 times out of 12, at 95% confidence
29
plants of one type, all caught, to bound its miss rate below 10%
59
plants of one type, all caught, to bound it below 5%
Is there a best financial spreading software? Only for your packages
No public benchmark ranks spreading tools: we know of no regulator, academic or professional body that has published a comparative test, and vendor claims are measured on packages the vendor chose. The best financial spreading software for a bank is therefore the one that catches the most of the errors that matter on that bank's own borrowers, with the fewest false alarms, in that bank's template and under its credit policy. That is a measurable question, and the rest of this page is a way to measure it.
The interagency guidance on third parties points the same way. Due diligence "includes assessing the third party's ability to: perform the activity as expected, adhere to a banking organization's policies related to the activity, comply with all applicable laws and regulations", and "Relying solely on experience with or prior knowledge of a third party is not an adequate proxy for performing appropriate due diligence, as due diligence should be tailored to the specific activity" (88 FR 37920). A reference call from another bank, or an industry consortium's review, is useful input, but the guidance asks the bank to judge it "based on the banking organization's own specific circumstances and performance criteria for the activity".
How accurate is automated financial spreading, and how would you know?
Accuracy has two parts, and a test must measure both. The first is transcription: is each figure on the spread the figure on its page? That can be sampled at random, and in a spread where every figure is pinned to its page the sample is quick to check. The second is catching: when the package itself contains a problem, a double count, a missing page, a statement that does not tie, does the spread surface it? That cannot be sampled at random, because such problems are rare. It has to be planted.
The usual alternative, a reviewer reading the spread, measures less than it seems. In a controlled study of data entry, "Visual checking resulted in 2958% more errors than double entry, and was not significantly better than single entry" (Barchard and Pace, 2011). Reading over a grid of numbers finds what looks wrong, and the expensive spreading errors look right. Examiners see the result as unidentified exceptions, which the OCC says "are often the result of errors, miscalculations, breakdowns in the pre- or post-closing review process, or system failures" (OCC).
The test in four steps
A person decides
SeedTake signed packages the tool has not seen. Plant one known error per copy, from the twelve types, and log each plant.
Agent
RunSpread each seeded copy with the tool exactly as in production: same template, same settings, no hints.
A person decides
ScoreFor each plant: caught, with the right pages? Caught, wrongly explained? Missed? Count false alarms on clean copies too.
A person decides
DecideSet a pass mark per error type in advance; re-run after any change to the tool or the settings.
The twelve errors worth planting
The list follows the way commercial spreads fail: in global cash flow, in the keying, in the package, and in the documents themselves. Each row says where to plant the error and what a catch looks like. A catch is an exception that names the error and cites the pages that show it, not a vague flag that the analyst has to investigate from scratch.
Twelve planted errors and what counts as a catch
| Error to plant | Where | A catch looks like |
|---|---|---|
| 1 · Schedule E income added to entity cash flow | Global cash flow | An exception citing Schedule E and the K-1 box, with coverage before and after |
| 2 · Borrower’s K-1 distributions counted again | Guarantor income | The amount removed, citing K-1 box 16D or 19A and the statement of equity |
| 3 · Rent to an affiliate added back on one side only | Operating company | The rent shown as paid and received, eliminated as a pair |
| 4 · A figure keyed with one zero too few | Any expense line | The line fails its tie to the return or the statement, with both pages |
| 5 · Two digits transposed in sales | Income statement | Sales do not tie to the return’s line 1a |
| 6 · A schedule page removed | Package | A missing-page exception before any figure from that return is used |
| 7 · A K-1 attached to the wrong owner | Package | Ownership does not add to 100%, or the K-1 does not tie to Schedule E |
| 8 · Last year’s schedule inside this year’s return | Package | A tax-year mismatch on the schedule |
| 9 · A plug that makes the balance sheet balance | Interim | The plug refused, the difference traced to the general ledger detail |
| 10 · A debt left off the debt schedule | Debt service | Interest or a lender on the return or statement with no matching debt |
| 11 · A stale personal financial statement | Guarantor | Its age against the policy limit, and the liquidity marked unverified |
| 12 · Statement sales inflated against the return | CPA statement | Statement-to-return difference beyond the tie tolerance, with both pages |
What each error does to coverage on a sample borrower
Weight the test by consequence. On Halvorsen Precision Machining, the solution's fictional sample borrower, fiscal 2025 global coverage is 1.47x on $1,588,430 of debt service, against a 1.25x policy. Planting some of the twelve errors in that spread moves coverage by amounts large enough to change a credit decision, and most move it upwards.
How far one planted error moves global coverage on the sample borrower
The errors that cost a bank are the ones that make a borrower look better. Nobody goes looking for them.
Four of the twelve occurred naturally in the sample package, and the run wrote each up with its pages: the owners' Schedule E income added by last year's method (error 1), the $600,000 of distributions (error 2), an interim balance sheet $50,000 out (error 9, an advance to an owner found in the general ledger detail), and a guarantor's personal financial statement 19 months old against a 12-month policy (error 11). That is one package, not a test. It shows what a catch looks like; it does not measure how often catches happen.
What a catch looks like: the error, the pages, the effect
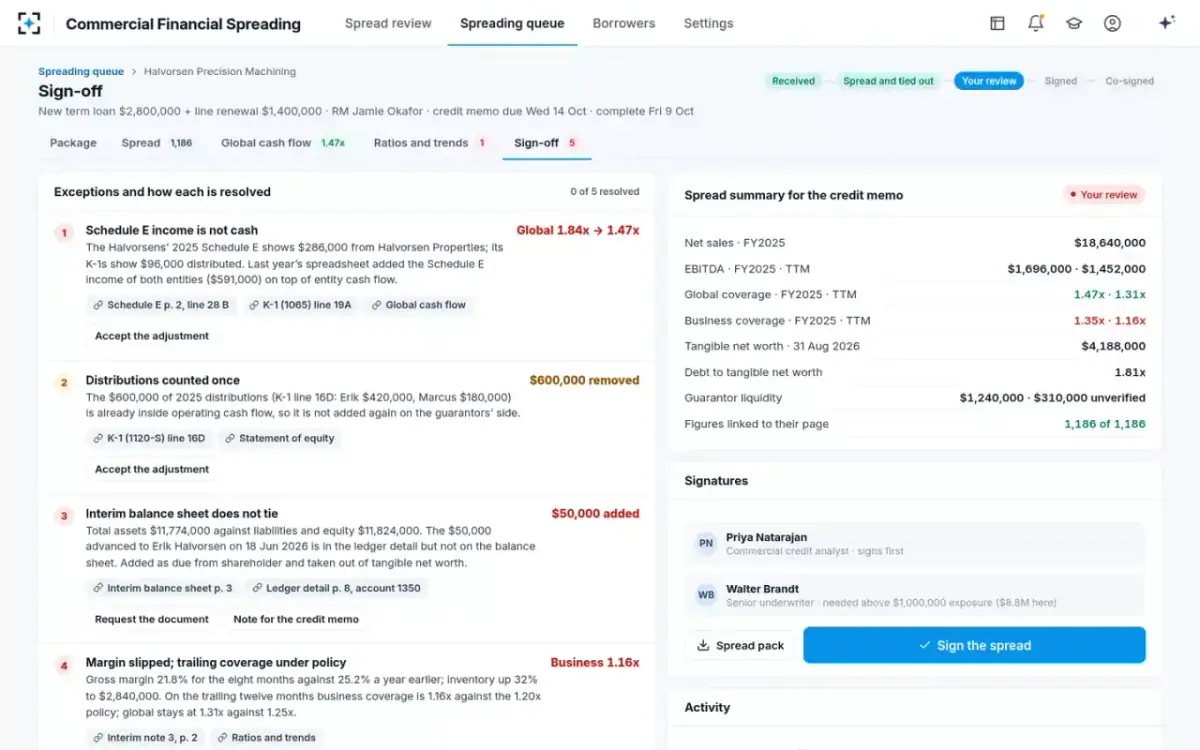
Score a catch only if it cites the right pages; a flag without its evidence still leaves the reviewer to find the error.
How many to plant, and how to score them
Plant enough of each type to bound its miss rate, and score each type separately. The arithmetic is unforgiving. If a tool catches all twelve planted errors of one type, a 95% confidence bound still allows it to miss 22% of that type. To bound the miss rate below 10% with no misses you need 29 plants of that type; below 5%, 59. A test of twelve errors, one of each, is a demonstration. A test of twelve types, 30 to 60 plants each, is a measurement.
The plants should go into real packages, copied and altered, not synthetic ones. A clean synthetic return is easier to read than a scanned CPA statement with a coffee stain, and the test should include the borrowers the tool will actually see: pass-through entities with K-1s, property affiliates with Form 8825, interims in management's own format. Keep some copies clean. A tool that flags everything catches every plant and is useless, so count false alarms on the clean copies and report them beside the catches.
A score sheet that says something
| Measure | How to compute it | What it tells the reviewer |
|---|---|---|
| Catch rate by error type | Caught with the right pages ÷ planted, for each of the twelve | Which errors can be left to the tool and which still need a person |
| Upper bound on misses | 1 − 0.05^(1/n) when all n are caught; an exact binomial bound otherwise | How sure the catch rate is, given how many were planted |
| False alarms | Exceptions on clean copies ÷ clean copies | How much reviewer time the tool spends on non-problems |
| Transcription accuracy | Random sample of figures compared with their pages | Whether ordinary figures are right, separately from the planted ones |
| Explanation quality | Share of catches whose pages and amounts are correct | Whether a catch saves work or only moves it |
How to measure OCR accuracy on a spread: count figures, then count consequences
Measure transcription with a random sample of figures checked against their pages, and report it as an error rate with a bound, not as a single percentage. The unit should be the figure on the spread, not the character on the page: a character-level score of 99.9% can hide a figure-level error rate several times higher, because one wrong digit spoils the whole number. On a four-entity spread of 1,186 figures, a 1% figure-level error rate is about a dozen wrong numbers.
The same binomial arithmetic that sizes the planted test sizes the sample. Check 300 figures chosen at random and find none wrong, and the 95% upper bound on the error rate is just under 1%; check 600 and it is about 0.5%. A vendor's accuracy figure means little without the number of figures it was measured on and how they were chosen. In a spread where every figure opens at its page, checking 300 takes an hour or two of a reviewer's time; in a spread without citations, the same check means finding each figure in the package first.
Then weight what the sample finds. A wrong figure in a line that feeds coverage, such as officers' pay, rent or distributions, matters more than one in prepaid expenses. Report errors in the lines that feed debt service coverage and leverage separately from the rest, because those are the lines a credit decision turns on.
How to evaluate financial spreading software: a bake-off on your own files
Run every shortlisted tool, and your current process, on the same seeded packages, under the same scoring, with the pass marks set before anyone looks at results. Give each vendor the bank's spreading template and the parts of the credit policy a spread applies: which statement leads, the tie tolerance, the global cash flow method, the coverage floors. A tool that cannot be configured to the policy should fail at that point rather than after a pilot.
Score four things beside the catches. Configuration: how long it took to load the template and policy, and who did it. Review time: minutes for an analyst to work a spread to signature, measured, not estimated. Evidence: whether an examiner could follow any figure from the signed spread to its page without the vendor in the room. And change: what happens to a test score when the template or a setting changes, since a re-run should be cheap enough to do every time.
Finally, decide what a pass means for the business case. The cost case for a tool rests on the hours it saves, and what one spread costs sets out the arithmetic; the risk case rests on the catch rates measured here. A tool that saves hours but misses the double counts moves the work from keying to rework, and the test is how a bank finds that out before its borrowers do.
Who should run the test, and when
The people who plant and score should not be the people who sell or configure the tool. In a bank that is credit review, the second-signature reviewers, or validation staff; for a vendor-supplied tool it is part of the bank's own due diligence. The NIST AI Risk Management Framework names "GOVERN, MAP, MEASURE, and MANAGE" as its core functions (NIST), and a seeded-error test is the MEASURE step made concrete for spreading. Whether a spreading tool falls under the bank's model risk guidance is a separate question, taken up in whether spreading software is a model.
Re-run the test whenever something changes: a new template, a change to the global cash flow method, a new version of the tool. Commercial Financial Spreading keeps every spread version and applies settings changes only to spreads started after them, so a test run can be tied to the exact settings it ran under.
A seeded-error test protocol, on one page
- Choose packages the tool has never seen
Signed, real, and of the shapes you lend to: pass-throughs, affiliates, guarantors, interims.
- Plant one error per copy, and log it
From the twelve types, 30 to 60 per type over the test, plus clean copies.
- Run the tool exactly as in production
Same template, same settings, no hints in file names.
- Score catches by type, with their pages
A catch without the right pages is scored as a partial.
- Count false alarms on clean copies
And sample ordinary figures against their pages for transcription accuracy.
- Set the pass marks before you look
Per error type; the double counts deserve the strictest.
- Re-run after every change
Template, method, thresholds or tool version.
The same protocol makes a fair test of the current process: plant the twelve errors in packages for your own analysts and count. That baseline is the honest comparison for any tool. Global cash flow, line by line explains the first three errors in depth; the step-by-step run shows where in the run each check happens; the Commercial Financial Spreading page shows the full set of screens.
Questions people ask
Is 99% extraction accuracy good enough?
It depends which 1%. On a spread of 1,186 figures, 1% is about a dozen wrong figures, and one of them could be the line that moves coverage. Ask for the catch rate on the error types that matter, with the number planted.
Can we use our past spreads as the answer key?
For transcription, partly; for catching, carefully. Past spreads contain their own errors: the sample borrower's previous spreadsheet counted Schedule E income and showed 1.84x where 1.47x is right. Where tool and old spread disagree, check the page before scoring.
Should every vendor get the same packages?
Yes, the same seeded copies and the same clean ones, run blind and scored by the same people, or the comparison measures the packages rather than the tools. Keep a hold-out set that no vendor sees before the final run, so a tool cannot be tuned to the test.
What false alarm rate is acceptable?
There is no standard, so set it before the test in the unit that matters: reviewer minutes per clean spread. If each false alarm takes three minutes to dismiss and the bank will accept ten minutes of noise per spread, the pass mark is about three false alarms per clean package. A tool that misses nothing but needs an hour of dismissals has moved the work, not removed it.
How long does a test take?
The seeding and scoring are the work: twelve types at 30 plants each is 360 seeded copies plus clean ones. Spreading them is the quick part. Start with the double counts and keying errors, which carry most of the risk.